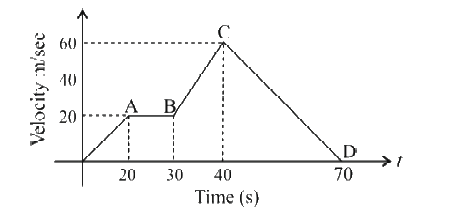
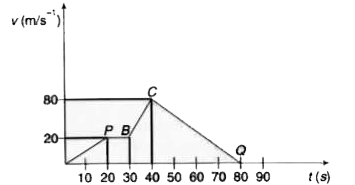
The v-t graph of a moving object is given in Figure. The maximum acceleration is
A
6ms−2
B
8ms−2
C
−6ms−2
D
none of these
Video Solution
Text Solution
The correct Answer is:A
Max , acceleration
= slope of BC =(80−20)(40−30)=6ms−2
|
Topper's Solved these Questions
- MISCELLANEOUS QUESTIONSBook:MCGROW HILL PUBLICATIONChapter:MISCELLANEOUS QUESTIONSExercise:PART-B
Explore 99 Videos
- MEASUREMENTBook:MCGROW HILL PUBLICATIONChapter:MEASUREMENTExercise:ELEMENTARY QUESTIONS (HIGHER ORDER THINKING QUESTIONS)
Explore 13 Videos
- MOTIONBook:MCGROW HILL PUBLICATIONChapter:MOTIONExercise:HIGHER ORDER THINKING QUESTIONS
Explore 48 Videos
Similar Questions
Knowledge Check
The velocity-time graph of a body is given in. The maximum acceleration in ms−1 is .
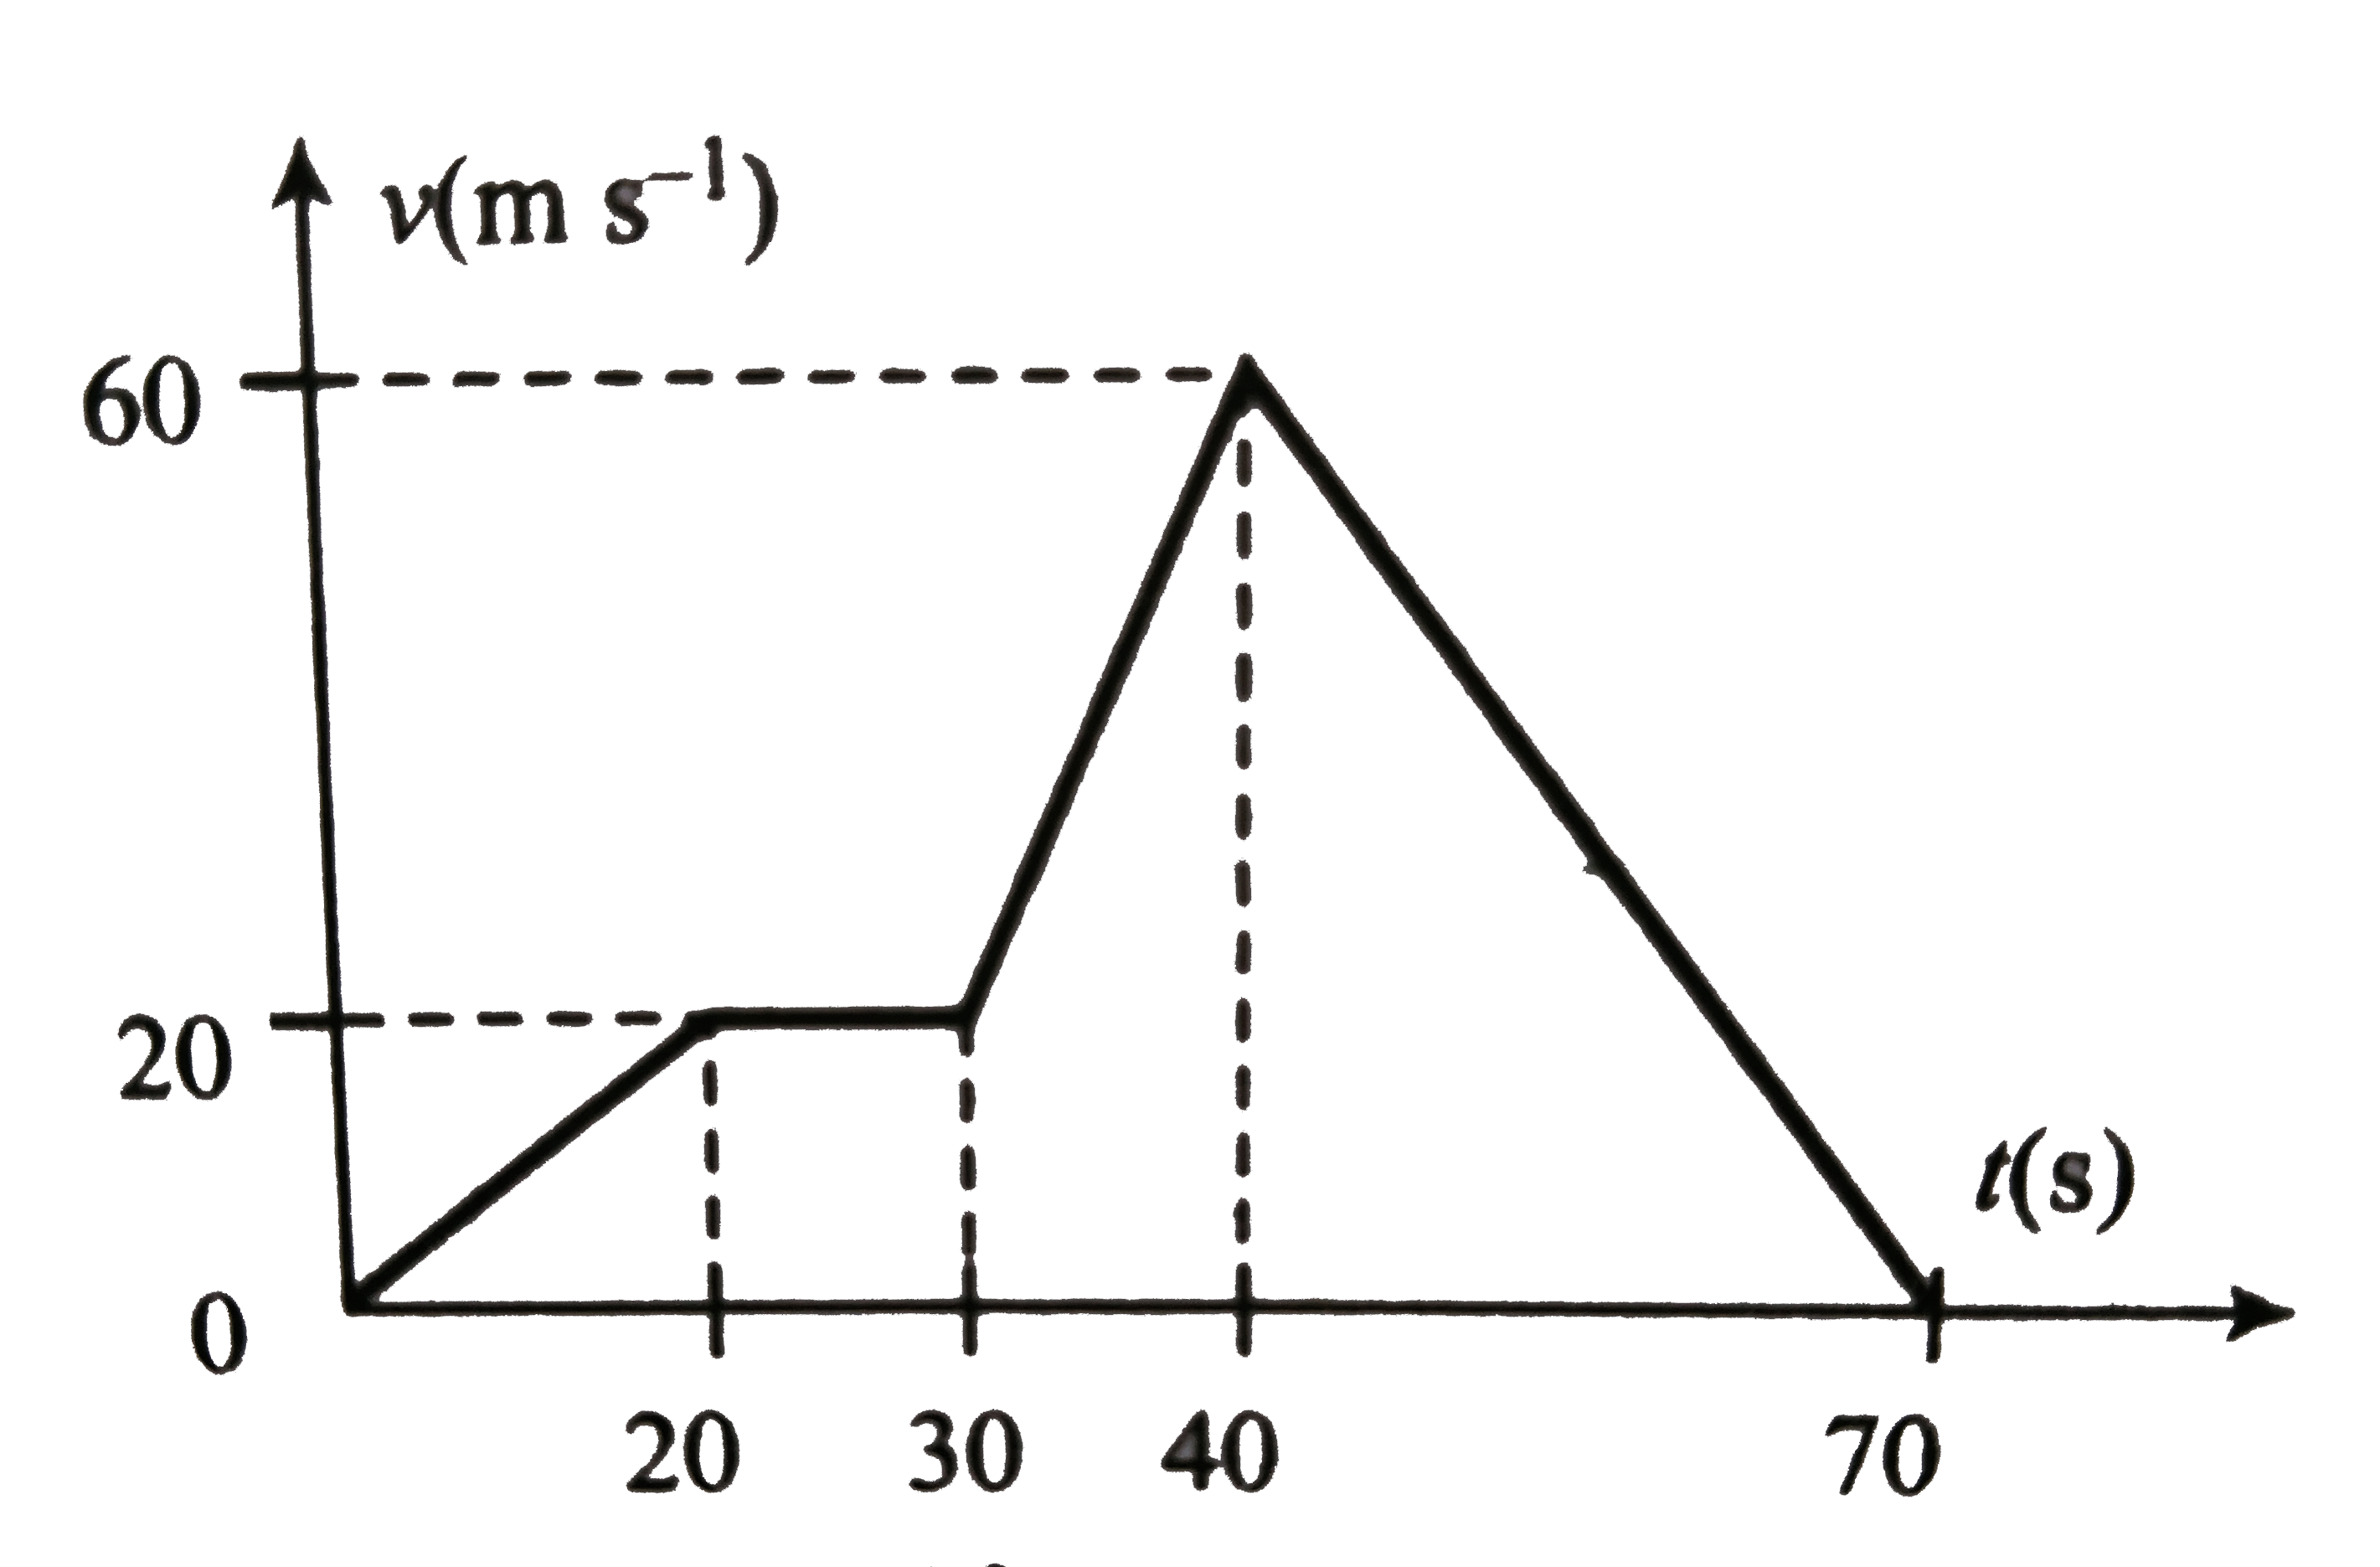 .A4B3C2D1
The following shows the time-velocity graph for a moving object. The maximum acceleration will be:
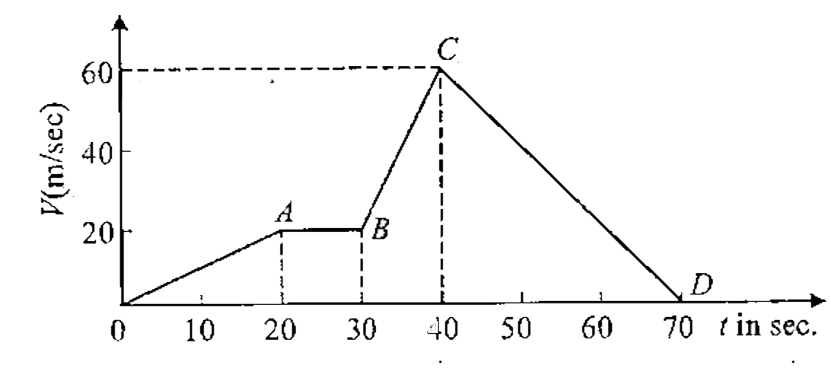 A1m/sec2B2m/sec2C3m/sec2D4m/sec2
The v-t plot of a moving object ios shown in the figure. The average velocity of the object during the first 10 s is
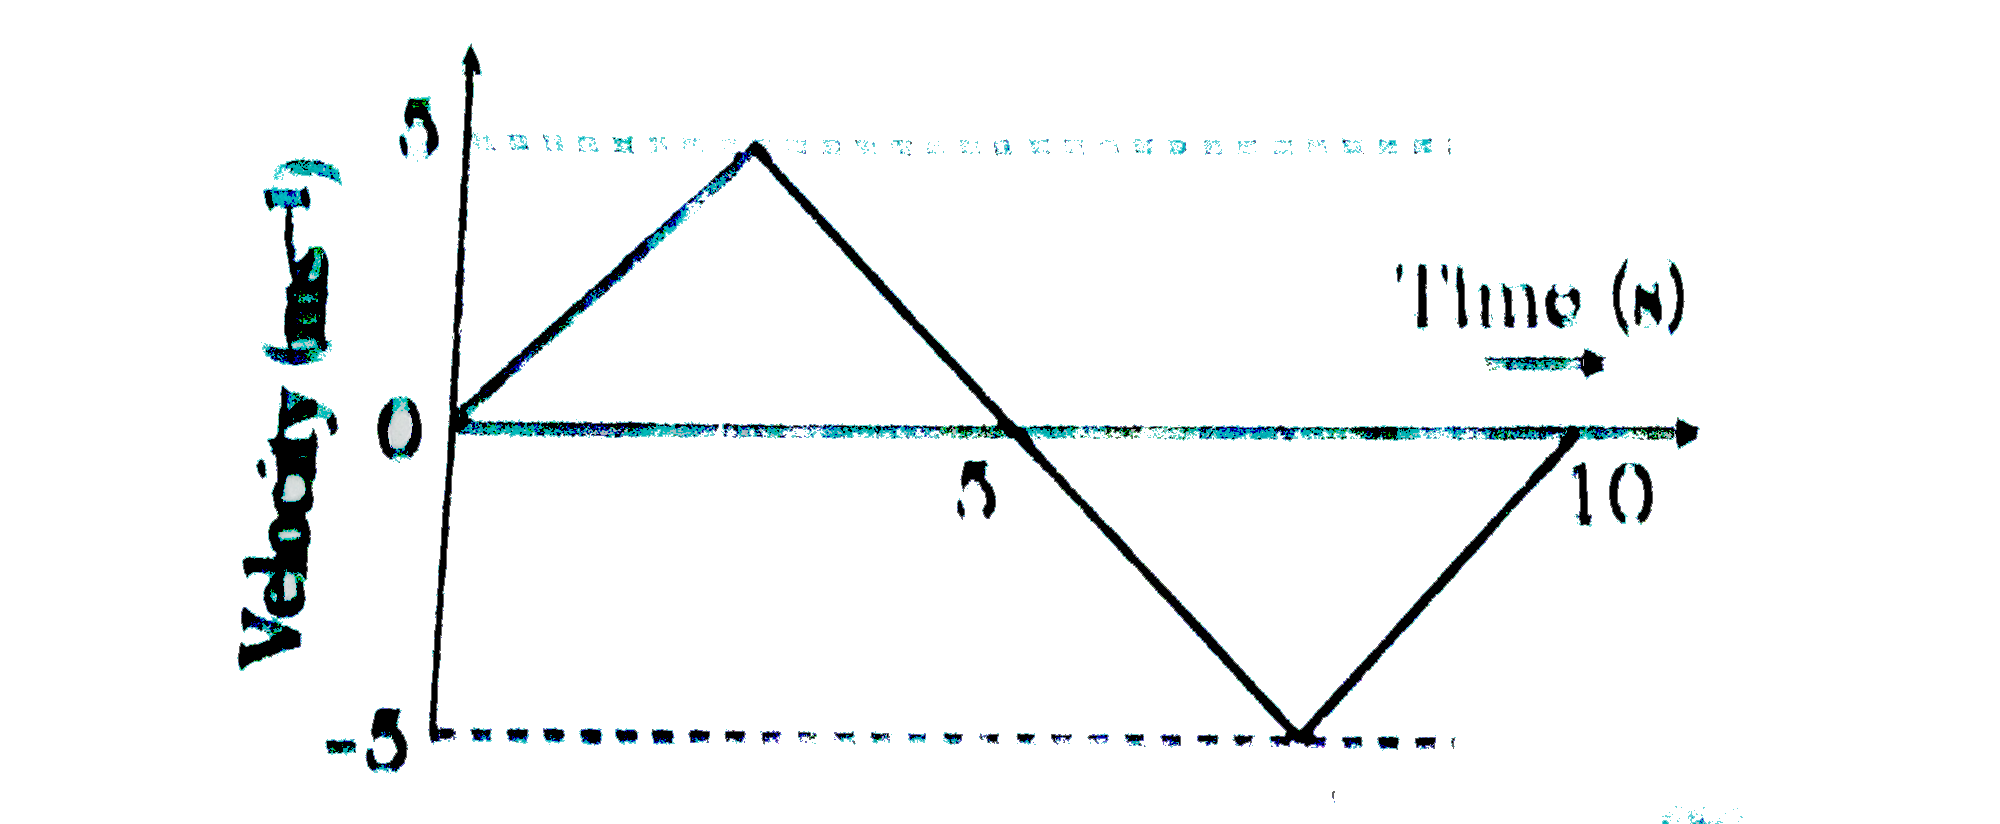 AzeroB2.5ms−1C5ms−1D2ms−1
Acceleration-velocity graph of a moving particle is shown in figure. The particle is
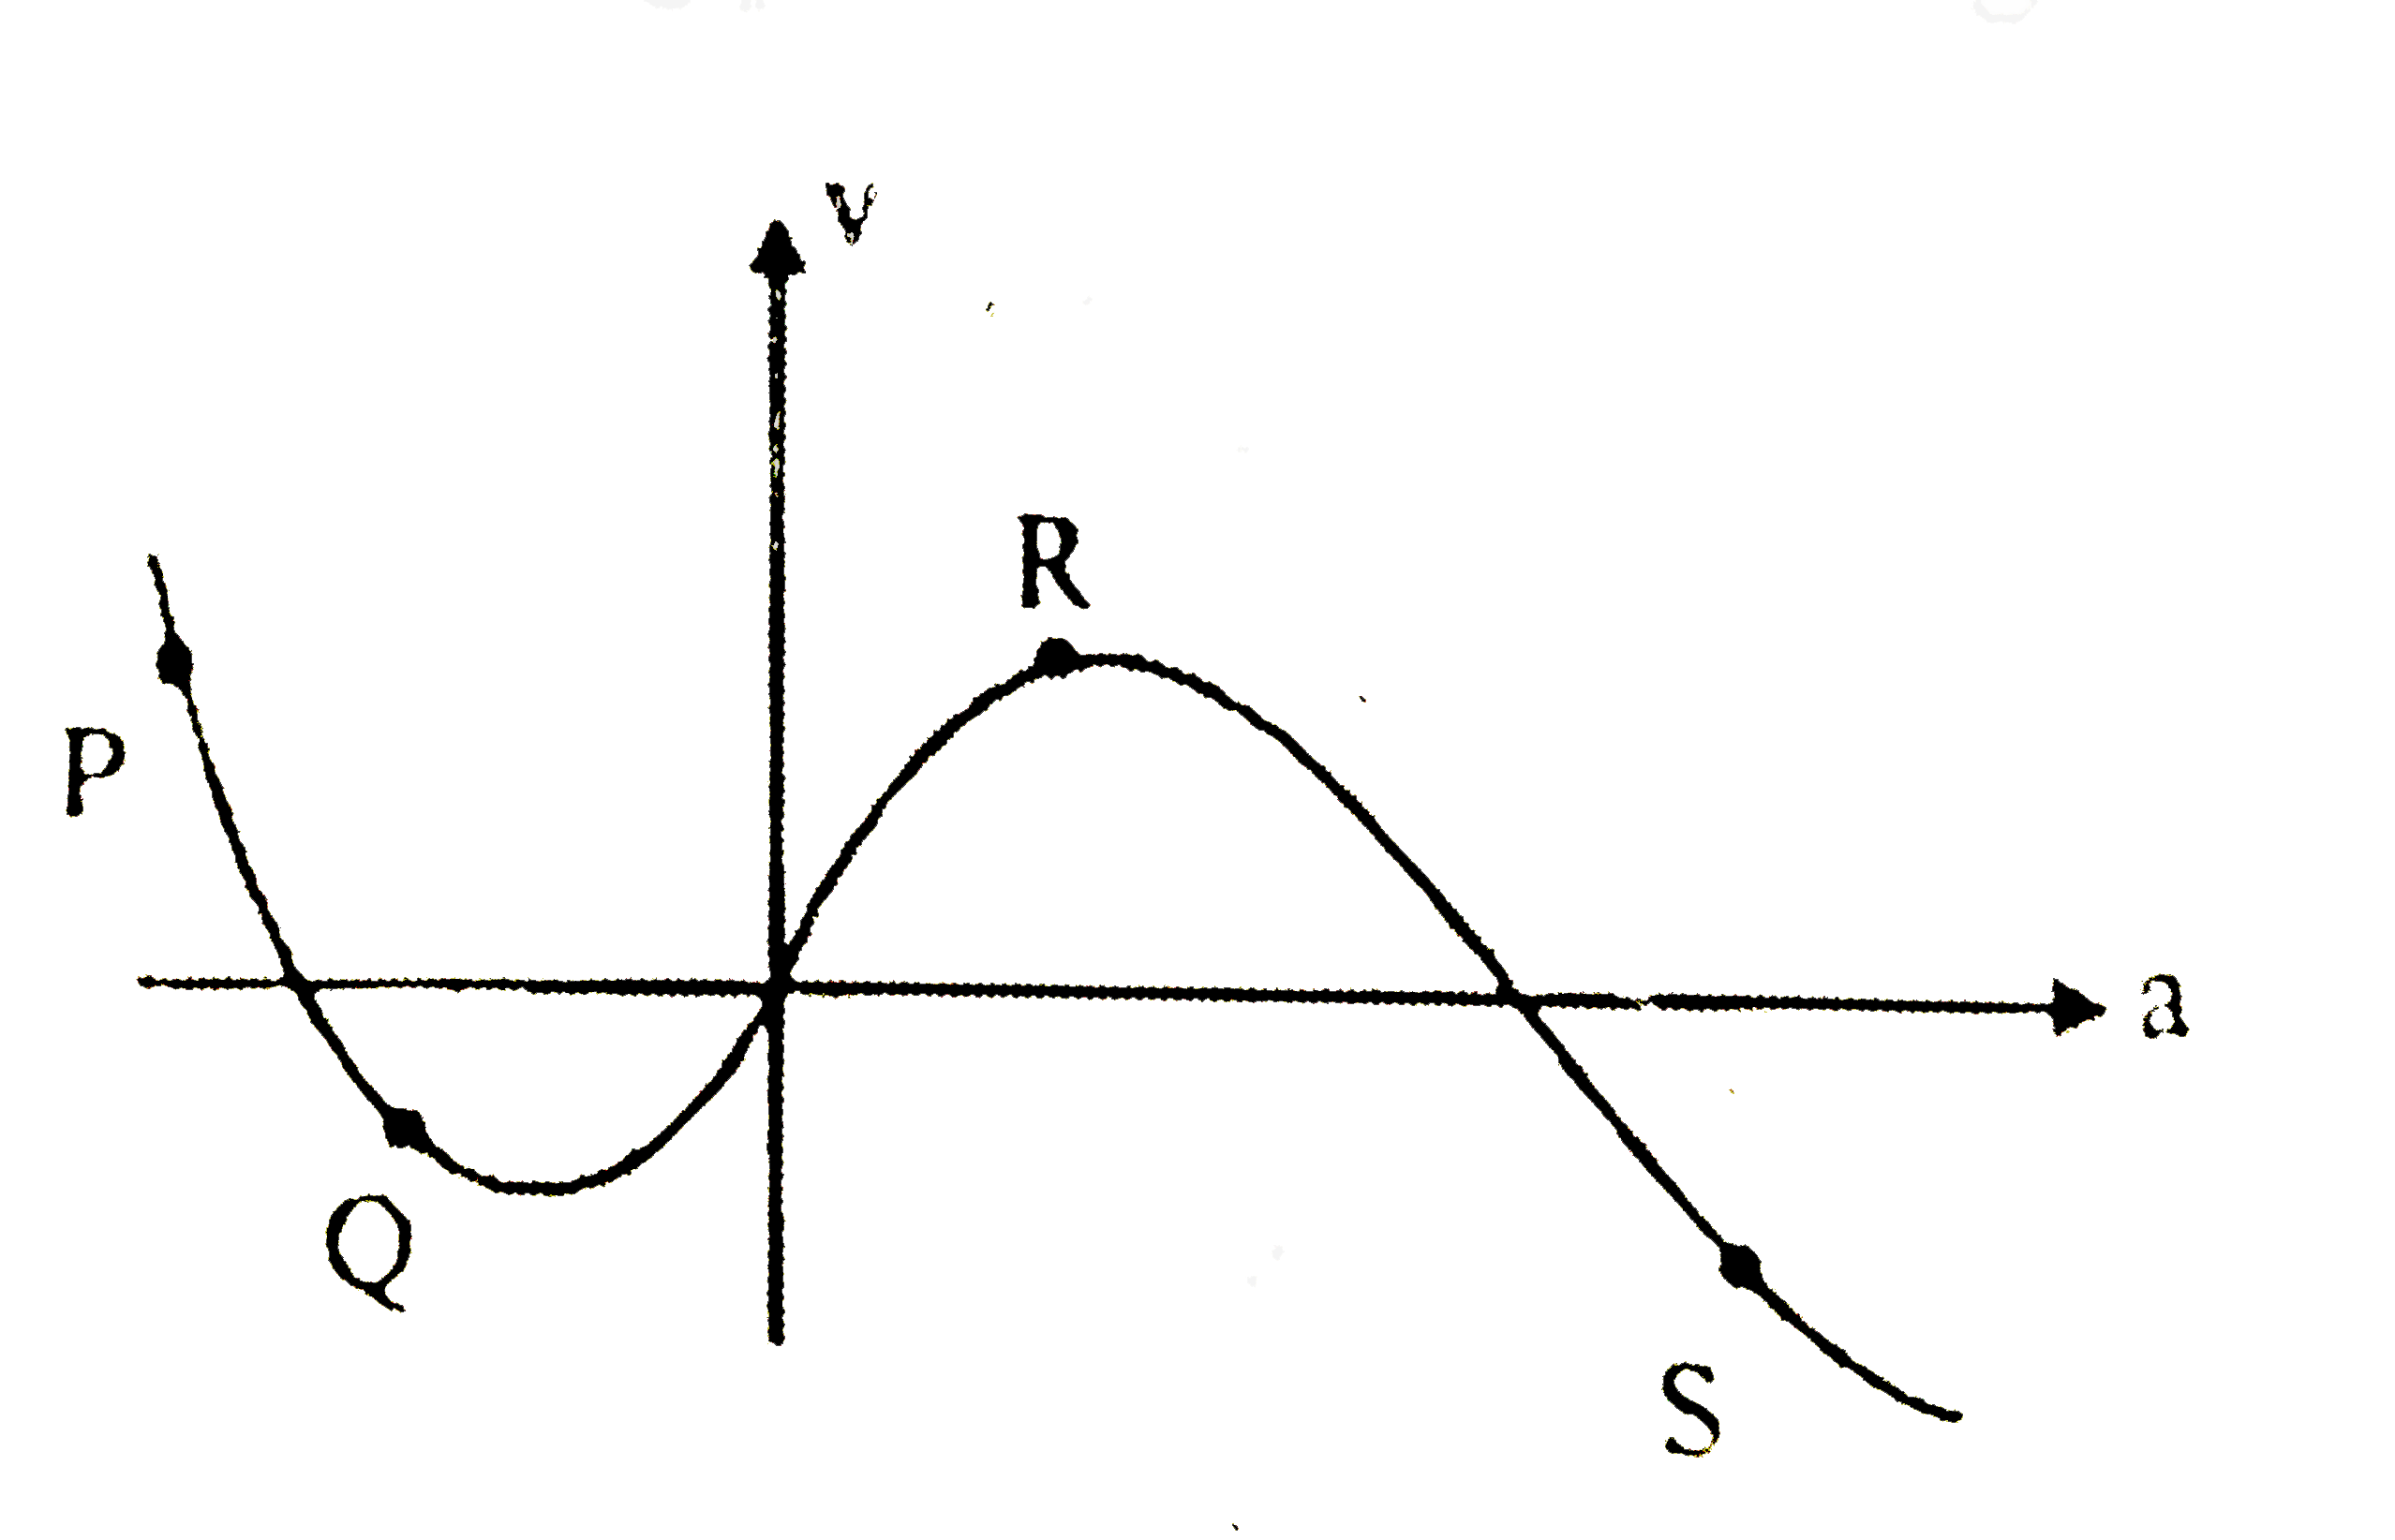
View SolutionDraw the position-time graph of a moving object, moving with zero acceleration.
View SolutionAcceleration-time graph of a moving object is shown in figure. Draw the velocity- time graph and displacement-time graph corresponding to this type of motion.
 .
.
View SolutionVelocity-time graph for a moving object is shown in the figure. Total displacement of the object during the time interval when there is non-zero acceleration and retardation is.
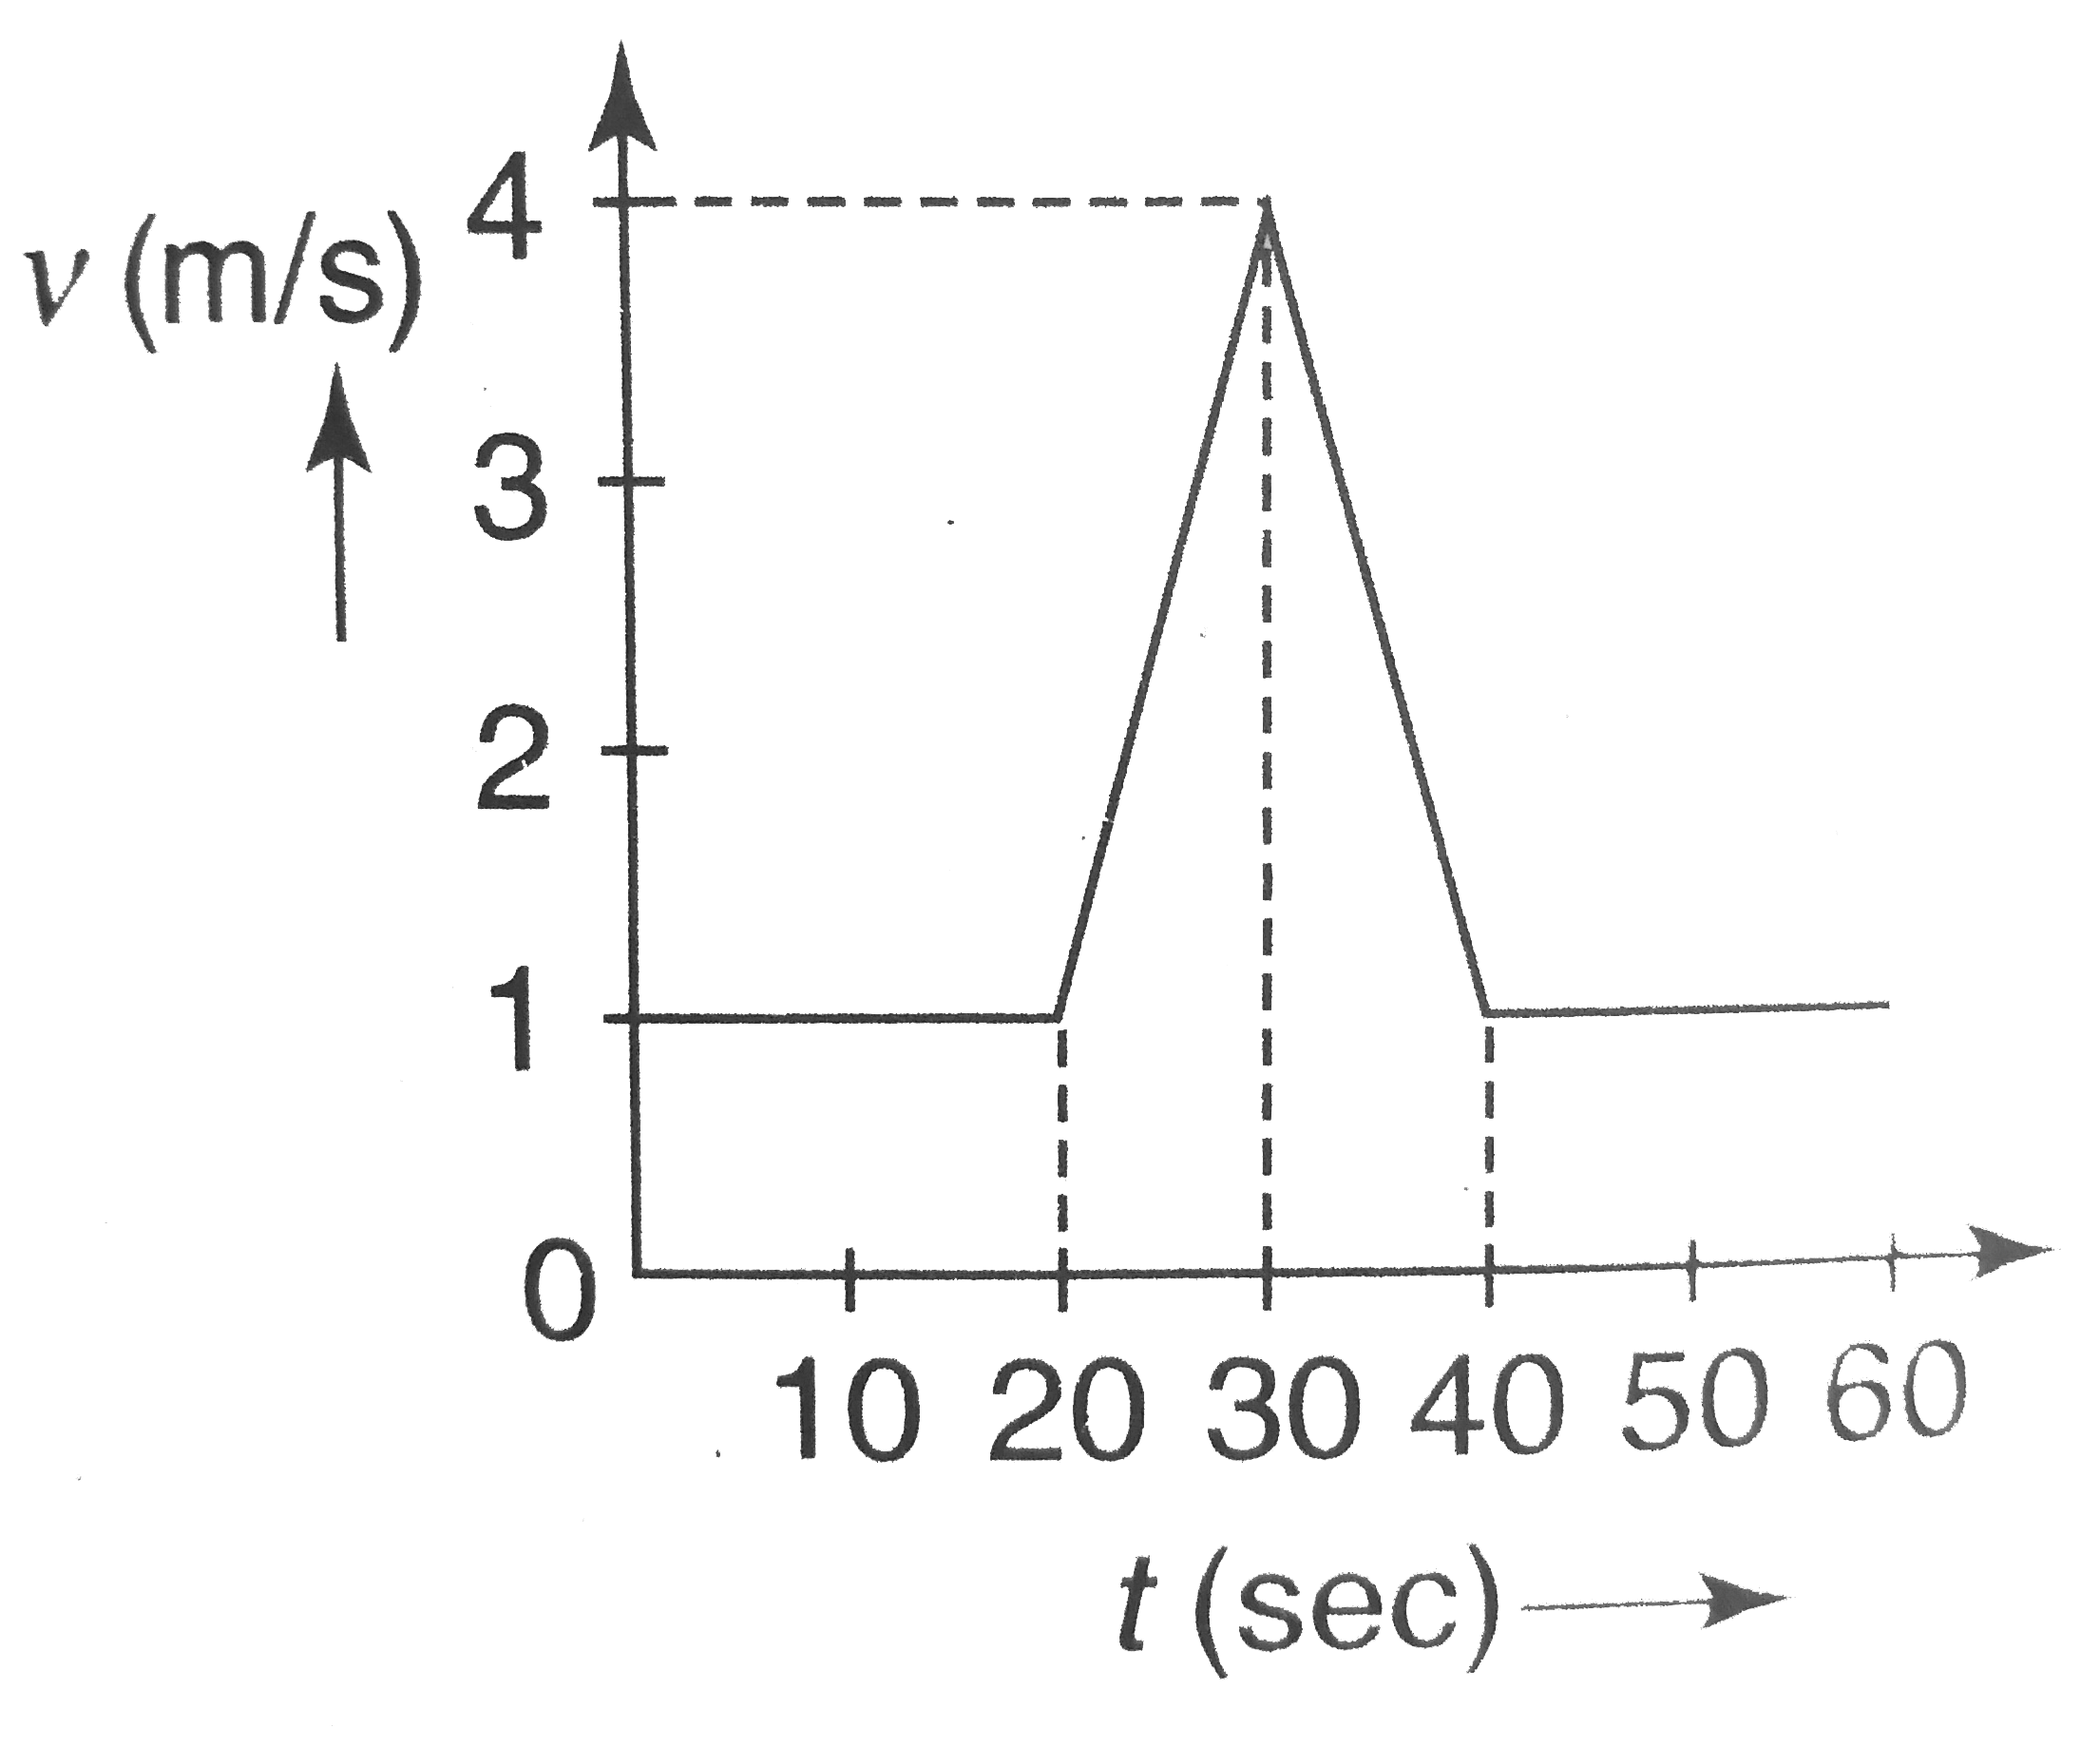
View SolutionThe velocity -time (v−t) graph of a particle moving in a straight line is shown in figure. The acceleration of the particle at t=9 is:
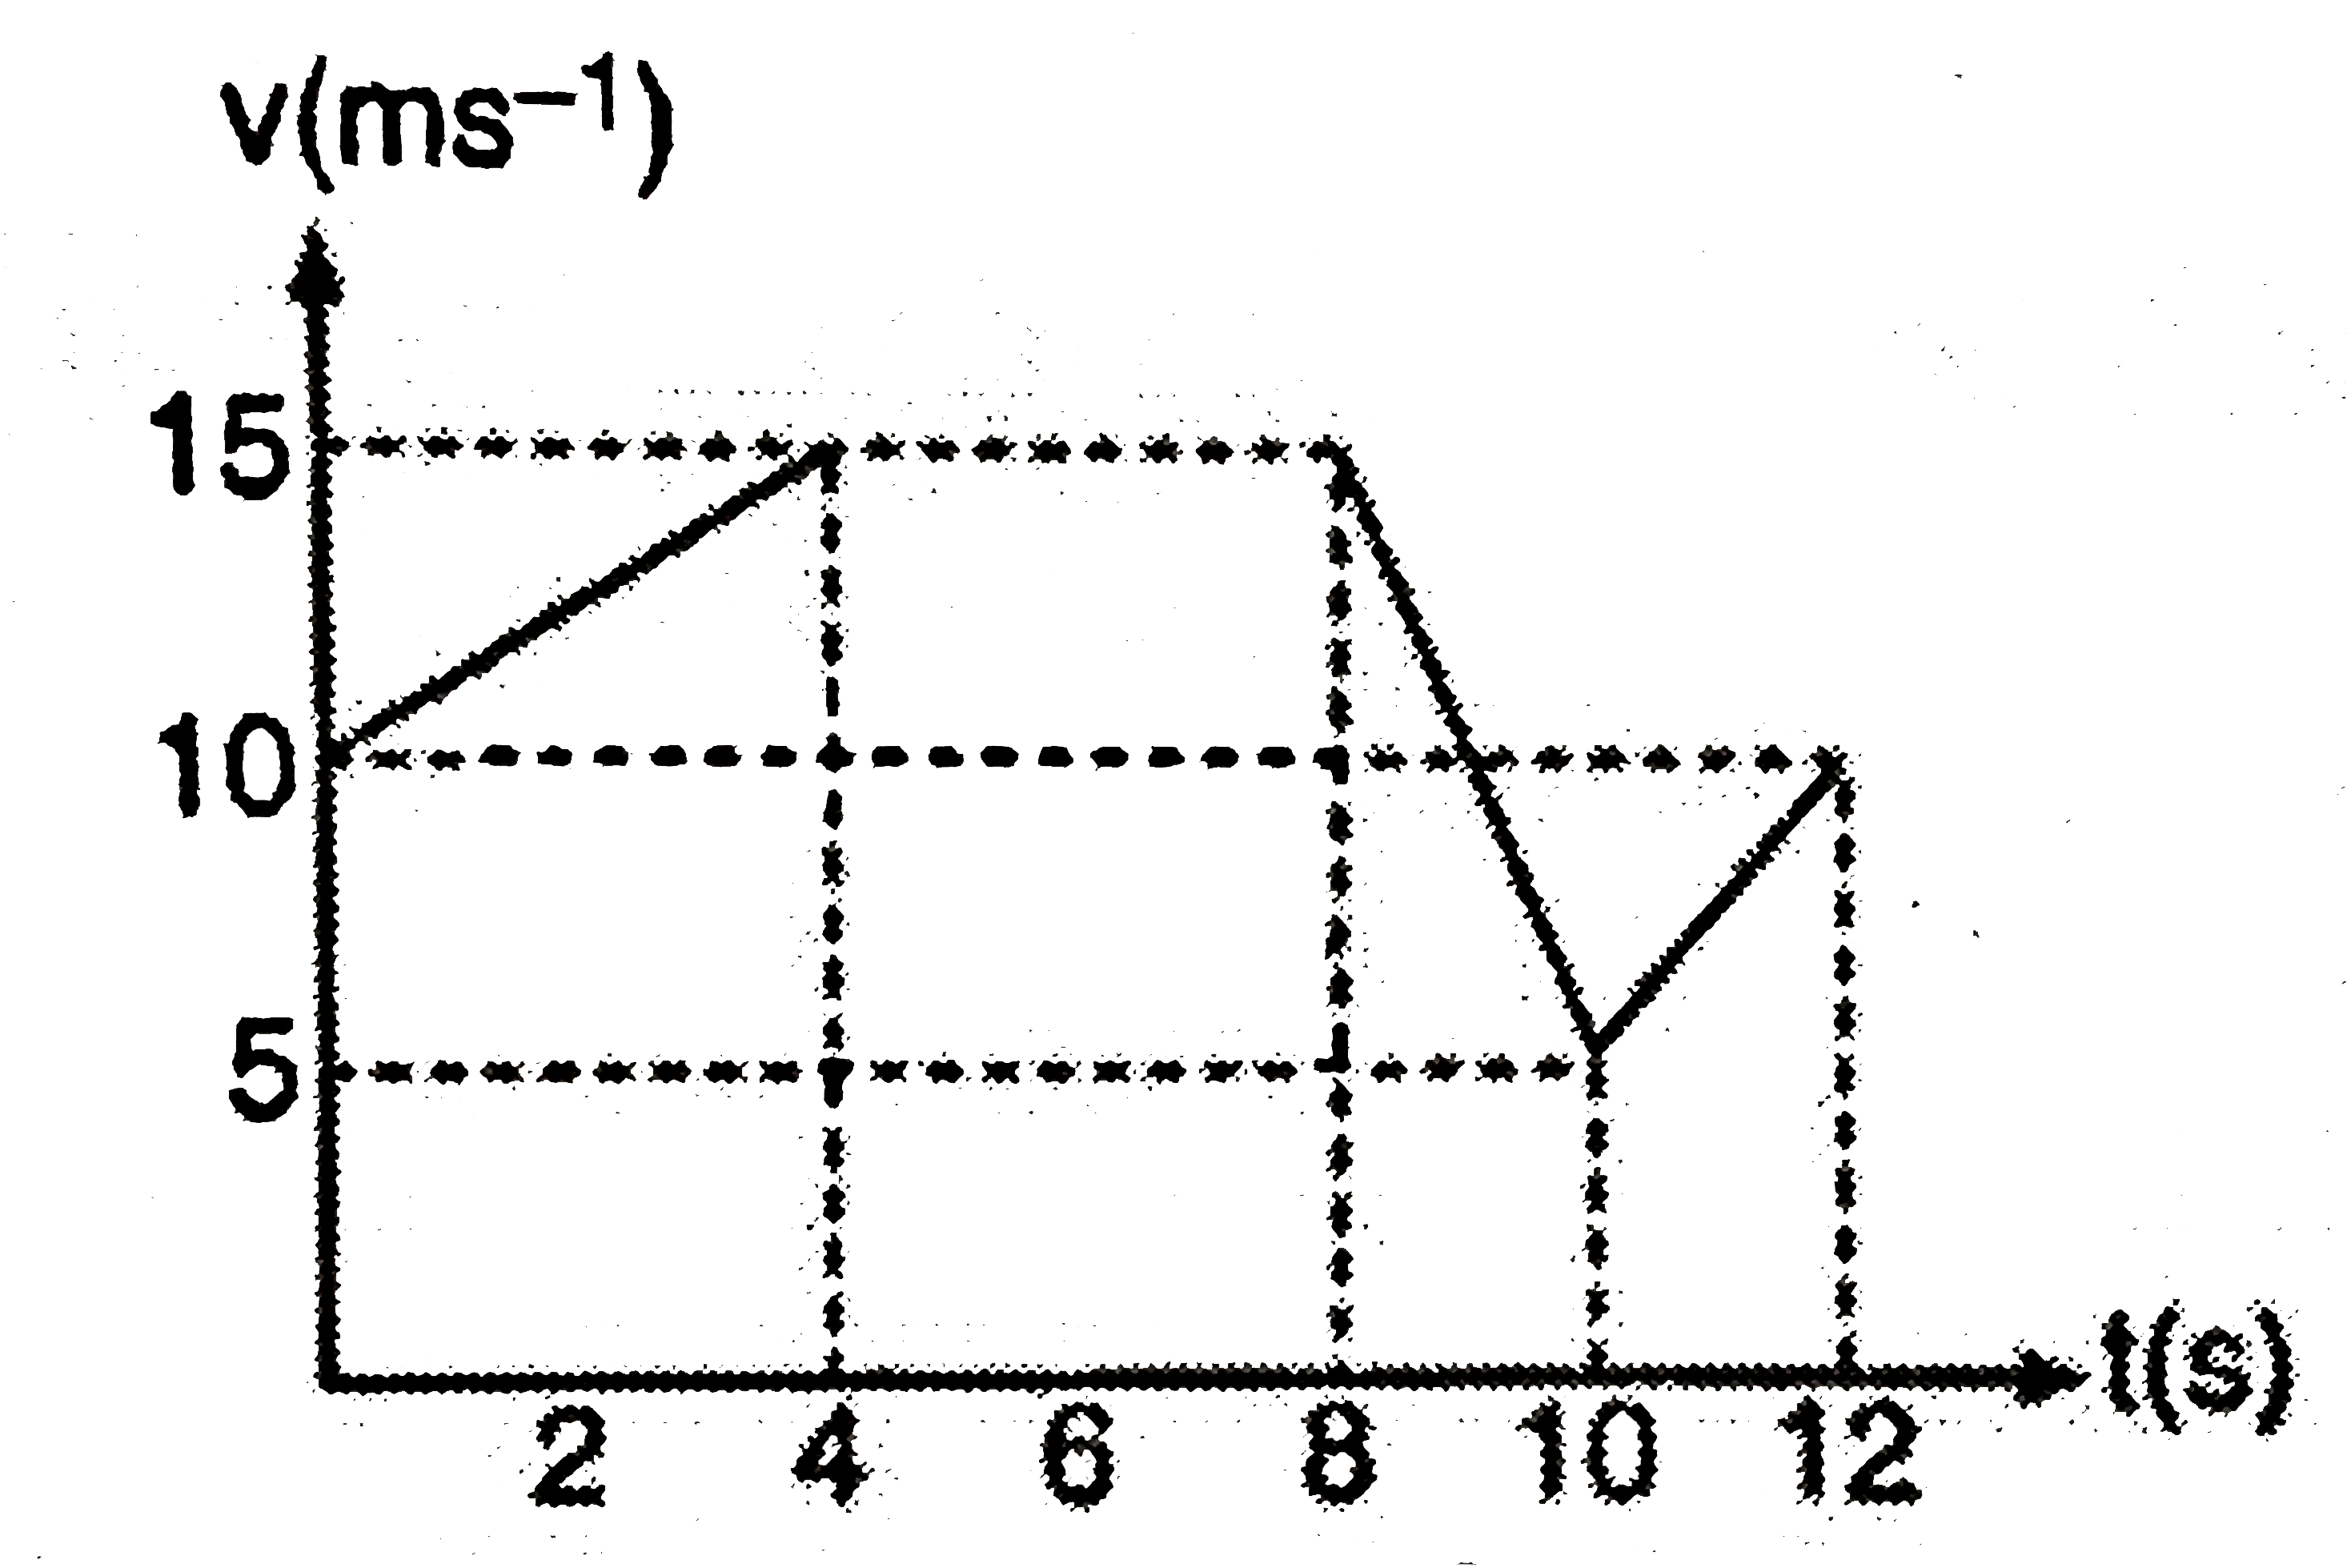
View Solution
