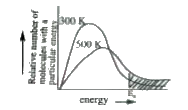
The distribution of molecular K.E. at two temperatures is shown in the following graph. Which of the following conclusions are correct?
 Solution in Telugu
The number of molecules with enerty Ea (or) greater is proportional to the shaded area for each temperature
The number of molecules with energy Ea (or ) less is proportional to the shaded area for each temperature
The number of molecules with energy Ea is the mean of all temperatures.
The graph follows the Maxwell-Boltzman energy distribution law.
The correct Answer is:A, D
Number of molecules with energy (Ea) are greater α shaded area.
Topper's Solved these Questions
- CHEMICAL KINETICSBOOK - AAKASH SERIESCHAPTER - CHEMICAL KINETICSEXERCISE - LEVEL-II(LECTURE SHEET EXERCISE-II LINKED COMPREHENSION TYPE QUESTIONS)
9 Videos
- CHEMICAL KINETICSBOOK - AAKASH SERIESCHAPTER - CHEMICAL KINETICSEXERCISE - LEVEL-II(LECTURE SHEET EXERCISE-III MATCH THE FOLLOWING QUESTIONS)
3 Videos
- CHEMICAL KINETICSBOOK - AAKASH SERIESCHAPTER - CHEMICAL KINETICSEXERCISE - LEVEL-1 (EXERCISE -II ORDER, MOLECULARITY, HALF LIFE:)
34 Videos
- CHEMICAL KINETCSBOOK - AAKASH SERIESCHAPTER - CHEMICAL KINETCSEXERCISE - EXERCISE - 3.2
45 Videos
- CHEMICAL THERMODYNAMICSBOOK - AAKASH SERIESCHAPTER - CHEMICAL THERMODYNAMICSEXERCISE - Additional Practice Exercise
54 Videos
Similar Questions
A certain endothermic reaction: A→ Product, ΔH=+ve proceeds ina sequence of three elementary steps with the rate constant K1,K2 and K3 and each one having energy of activation E1,E2 and E3 respectively at 25∘C. The observed rate constannt for the reaction is equal to K3√K1K2.
A1,A2 and A3 are Arrhenius parameters respectively.
The observed energy of activation for the reaction is
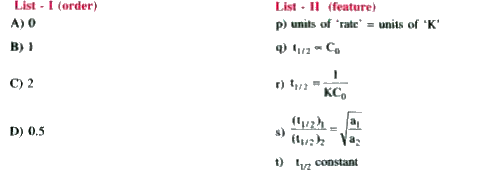
View SolutionMatch the following columns

View SolutionSucrose decompose in acid solution into glucose and fructose according to the first order rate law, with t12=3.00 hours. What fraction of sample of sucrose remains after 8 hours ?
View SolutionDiscuss on the kinetic spontaneity of a chemical reaction. Is a slow reaction spontaneous? Why?
View SolutionWhich among the following is not an exact differential?
View SolutionThe distribution of molecular kinetic energy at two temperature is as shown in the following graph:

Which is the following concluison is/are correct?
View SolutionWhich of the following radial probability distribution graph is correct for 5s orbital ?
View SolutionWhich of the following graphs regarding Maxwell distribution of speed are correct for ideal gases ?
View Solutionदो कथन के पश्चात दो निष्कर्ष एवं दिए गए है। इन चार विकल्पों में से कौन-सा विकल्प सही है? कथन: निष्कर्ष:
View Solutionनिम्नलिखित प्रश्नो में सही विकल्प का चयन कीजिए -
किसी गैस में आणविक वेगो के वितरण पर तापमान में वृद्धि के प्रभाव के सम्बन्ध में निम्नलिखित में से कौन - सा कथन सत्य नहीं है ?
View SolutionExplain Maxwell-Boltzmann distribution curves of molecular speeds and give the important conclusions. Discuss the effect of temperature on the distribution of molecular speeds.
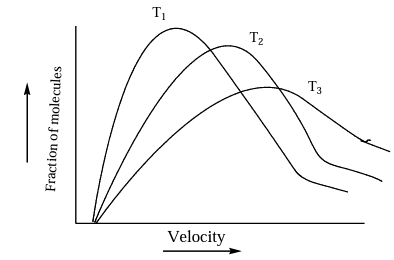
View SolutionIn the following graph of Maxwell - Boltzmann distribution of molecular velocities . Which of the following is the correct order of temperature ?

View Solutionनिम्न चित्रों में T1 तथा T2(T2>T1) ताप पर कृष्ण वस्तु हेतु ऊर्जा वितरण दर्शाये गये हैं, कौन सा ग्राफ सही है
View SolutionMaxwell and Boltzmann have shown that actual distribution of molecular speeds depends on temperature and molecular mass. At the same temperature which will move faster, N_2 or Cl_2 ?
View Solutionकिसी समांग पदार्थ के नमूने को एक समान दर से ऊष्मा प्रदान की गई। नीचे दिए चित्र के अनुरूप उसके ताप का समय के साथ ग्राफ खिंचा गया। नीचे दिए गए निष्कर्षो में कौनसा सही है ?

View Solution
