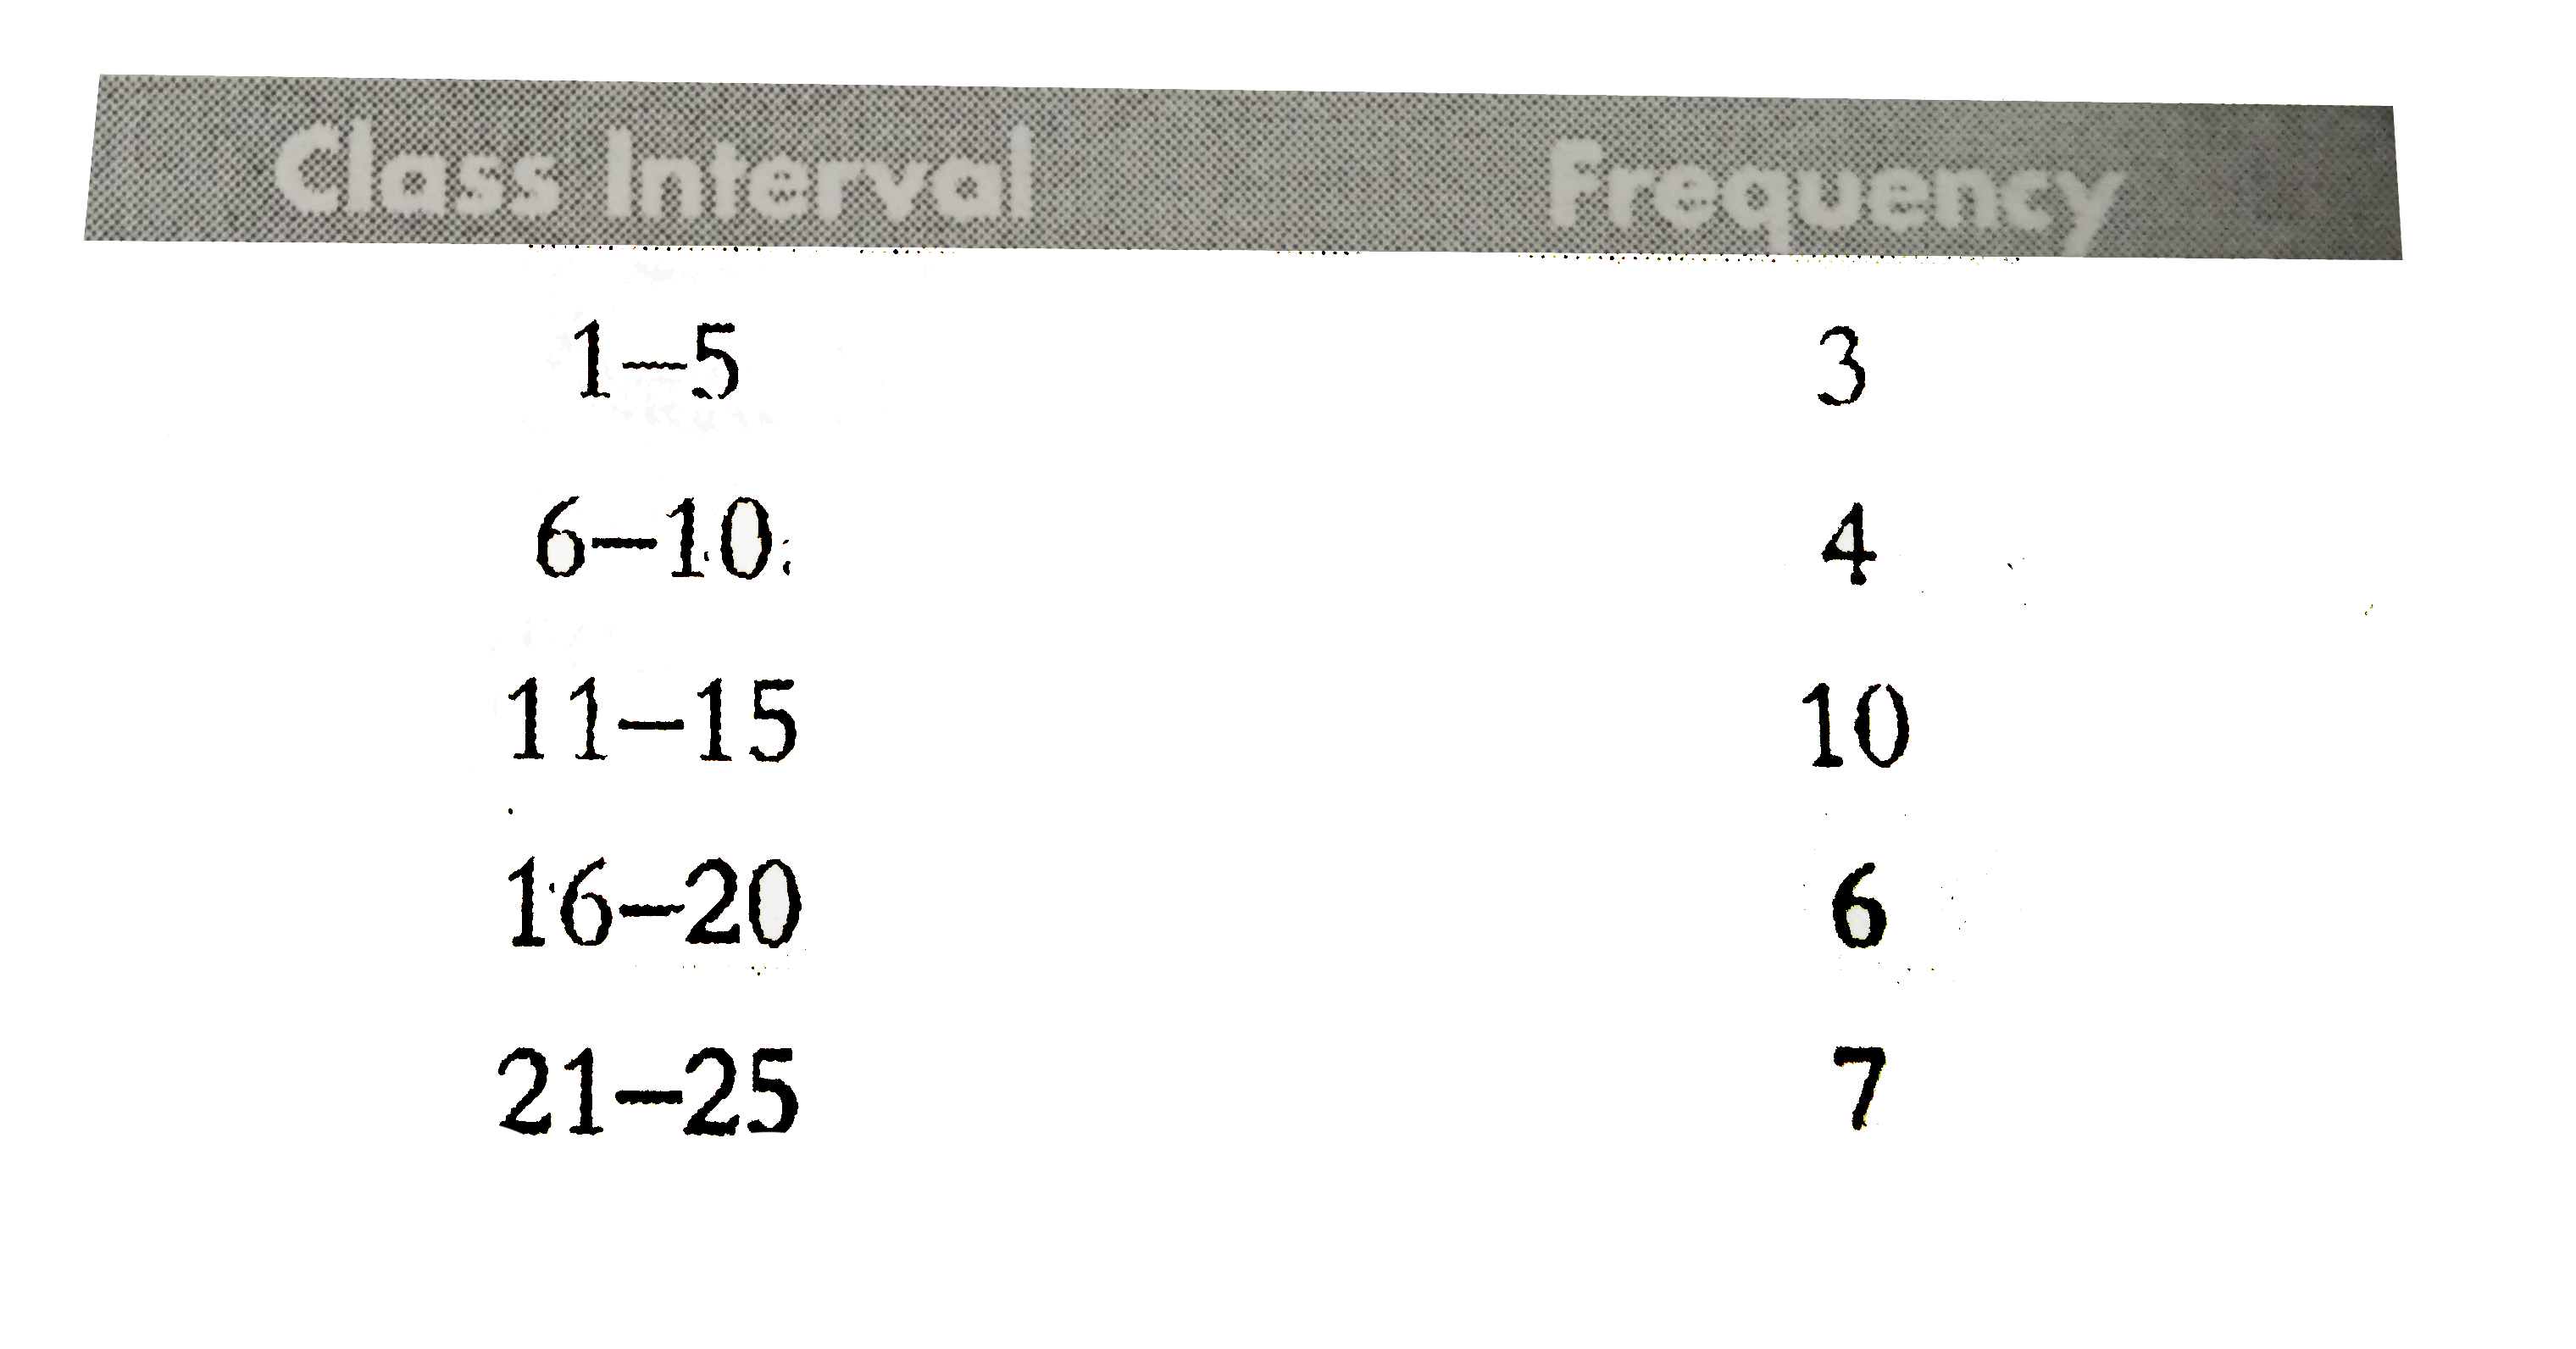
Cosider the following table

The mode of the above data is
23.5
24
24.4
25
The maximum frequency is 25 and be the modal class is 22-26
∴xk=22,fk=25,fk−1=16,fk+1=19andh=4
∴mode=xk+h.{(fk−fk−1)(2fk−fk−1−fk+1)}
={22+4×(25−16)(50−16−19)}=(22+4×915)=(22+125)=(22+2.4)=24.4
Topper's Solved these Questions
- MEAN,MEDAN,MODE OF GROUPED,DATA CUMULATIVE FREQUENCY GRAPH AND OGIVE BOOK - RS AGGARWALCHAPTER - MEAN,MEDAN,MODE OF GROUPED,DATA CUMULATIVE FREQUENCY GRAPH AND OGIVE EXERCISE - Test Yourself
18 Videos
- MEAN,MEDAN,MODE OF GROUPED,DATA CUMULATIVE FREQUENCY GRAPH AND OGIVE BOOK - RS AGGARWALCHAPTER - MEAN,MEDAN,MODE OF GROUPED,DATA CUMULATIVE FREQUENCY GRAPH AND OGIVE EXERCISE - Multiple Choice Questions (Mcq)
23 Videos
- LINEAR EQUATIONS IN TWO VARIABLES BOOK - RS AGGARWALCHAPTER - LINEAR EQUATIONS IN TWO VARIABLES EXERCISE - QUESTION
2 Videos
- PERIMETER AND AREA OF PLANE FIGURES BOOK - RS AGGARWALCHAPTER - PERIMETER AND AREA OF PLANE FIGURES EXERCISE - TEST YOURSELF (SHORT -ANSWER QUESTIONS)
1 Videos
Similar Questions
The mode of a data is _______.
View SolutionThe initial rate of reaction A+B→C, was measured for several concentration of A and B. The decomposition made are recorded in the following table.

Using the data in the above table, determine a) the rate law for the reason b) the magnitude of the rate constant.
View Solution
Knowledge Check
If the mode of the following data is 9, then find the median of the data.
 A8B9C10D11
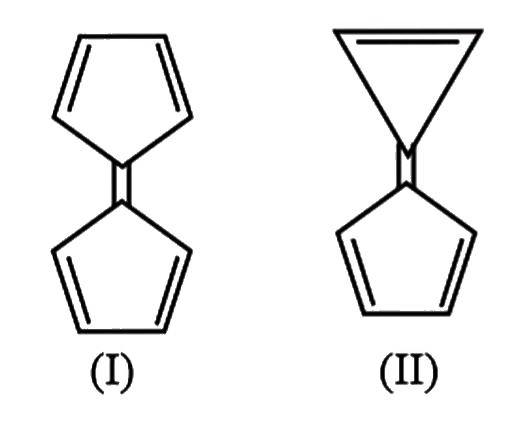
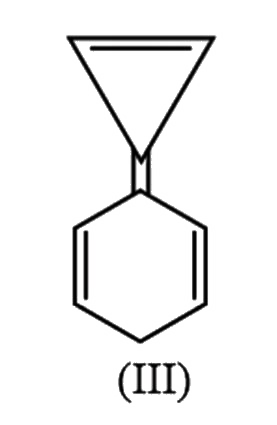
Cosider the following structures.


Choose the correct statement regarding the above structures.ADipole moment varies as II gt III gt IBII is more stable than ICI is the most reactive among threeDAll of the above
Find the mode of the following data :

View SolutionIf the mode of the following data is 4, then find the median of the data.

View SolutionIf the mode of the following data is 8, then find the median of the data.

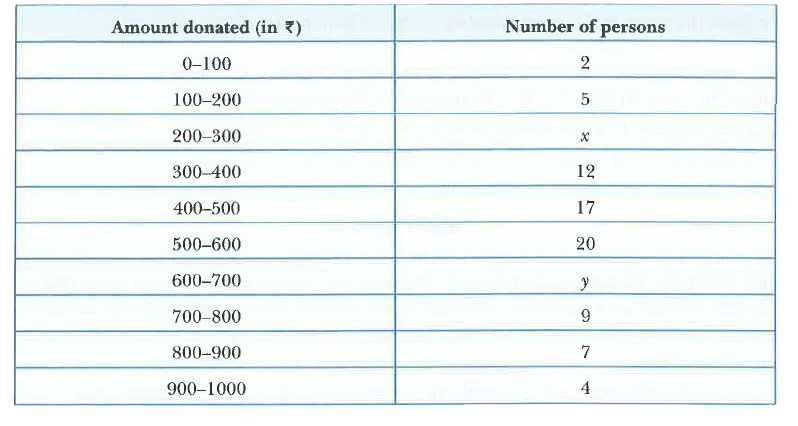
View SolutionThe following table shows the data of the amount donated by 100 people in a blind school.

If the median of the above data is 525, find the value of x and y.
What values are depicted here ?
View SolutionFind the mode of the following data

View SolutionCompute the mode of the following data :
View Solution
