Look at the bar graph given below.
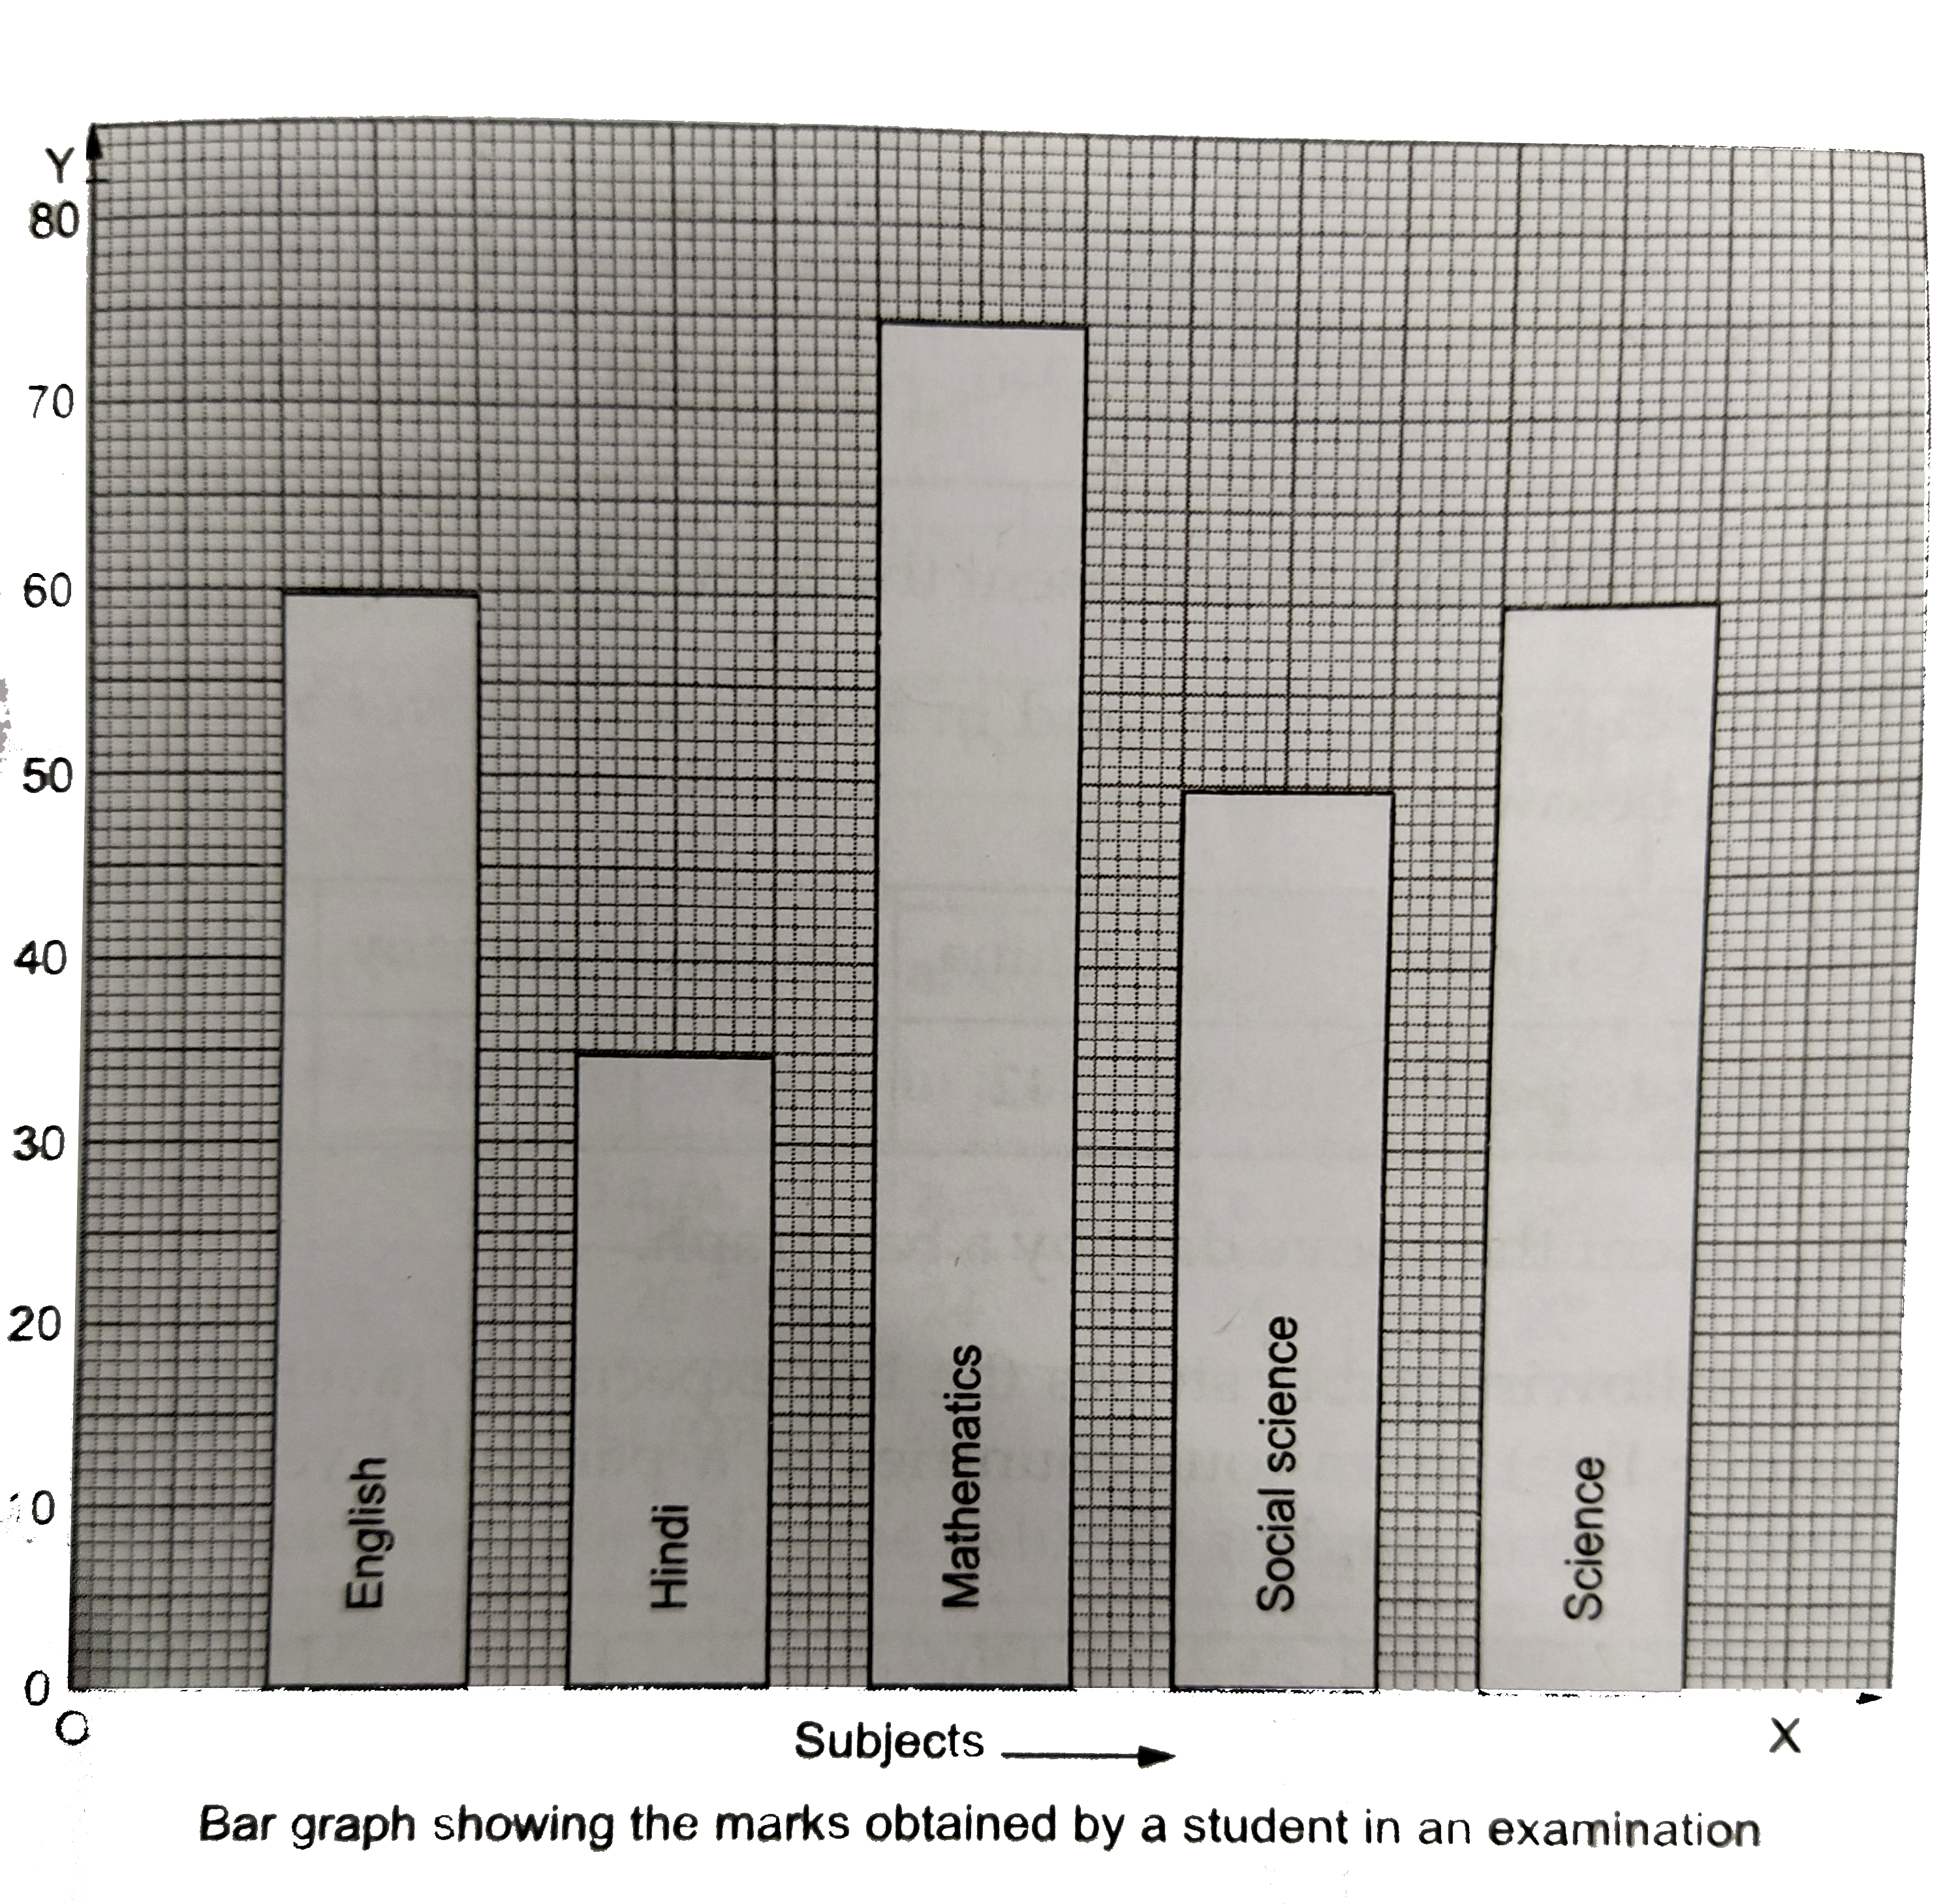
Read it carefully and answer the following questions.
(i) What information does the bar graph give?
(ii) In which subject is the student very good?
(iii) In which subject is he poor?
(iv) What is the average of his marks?
(i) The bar graph shows the marks obtained by a student in various subjects in an examination.
(ii) The student is very good in mathematics.
(iii) He is poor in Hindi.
(iv) Average marks=60+35+75+50+605=2805=56
Topper's Solved these Questions
- BAR GRAPH, HISTOGRAM AND FREQUENCY POLYGONBOOK - RS AGGARWALCHAPTER - BAR GRAPH, HISTOGRAM AND FREQUENCY POLYGONEXERCISE - EXERCISE 17B
16 Videos
- BAR GRAPH, HISTOGRAM AND FREQUENCY POLYGONBOOK - RS AGGARWALCHAPTER - BAR GRAPH, HISTOGRAM AND FREQUENCY POLYGONEXERCISE - EXAMPLE
11 Videos
- AREAS OF TRIANGLES AND QUADRILATERALSBOOK - RS AGGARWALCHAPTER - AREAS OF TRIANGLES AND QUADRILATERALSEXERCISE - Multiple Choice Questions (Mcq)
16 Videos
- CIRCLES BOOK - RS AGGARWALCHAPTER - CIRCLES EXERCISE - MULTIPLE CHOICE QUESTION(MCQ)
37 Videos
Similar Questions
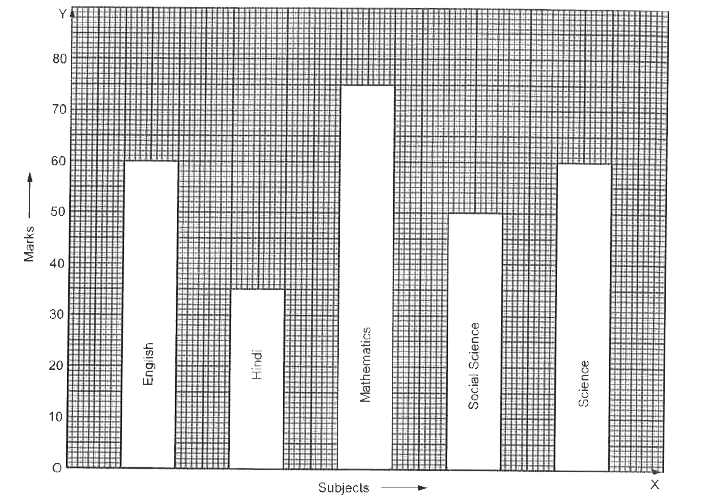
Look at the bar graph given below
Read it carefully and answer the following questions
Q(i) What information does the bar graph give
(ii) In which subject is the student very good
(iii) In which subject is he poor
(iv) What is the average of his marks
View SolutionRead the graph and answer the following questions
What information is conveyed by the bar graph
View SolutionLook at the bar graph given below.
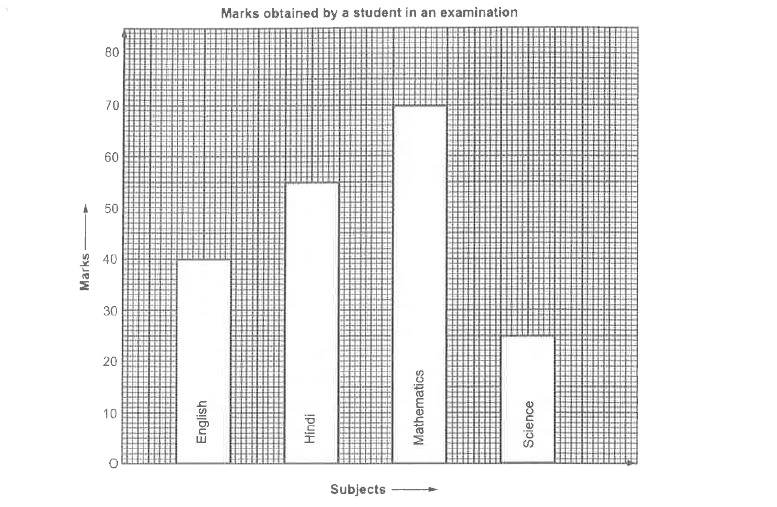
Read if cerefully and answer the questions given below:
What information does the bar graph give ?
In which subject is the student poorest ?
In which subject is the student best ?
In which subjects did he get more than 40 marks ?
View SolutionRead the bar graph and answer the following questons.
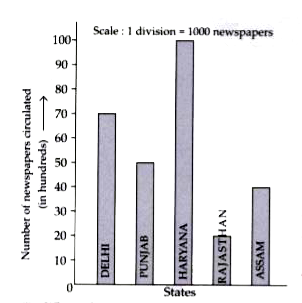
What information is given by graph ?
View SolutionRead the following bar graph given in figure and answer the following questions.
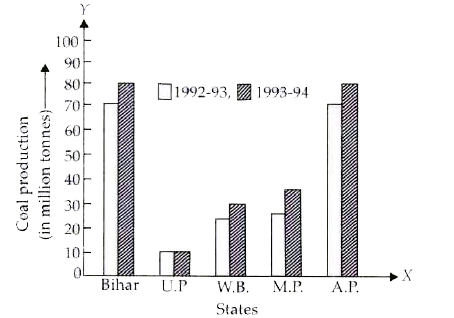
(i) What information is given by this bar graph?
View SolutionRead the bar graph given below and answer the following questions:
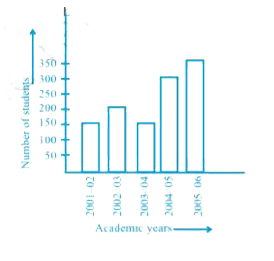
What information is given by the þar graph?
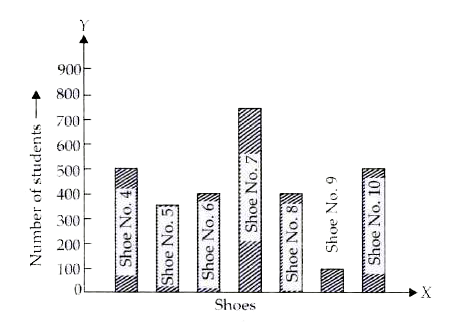
View SolutionRead the bar graph shown in figure and answer the following questions.
What is the information given by the bar graph?
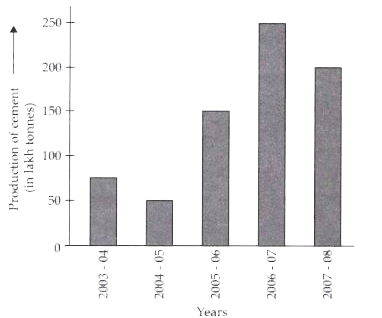
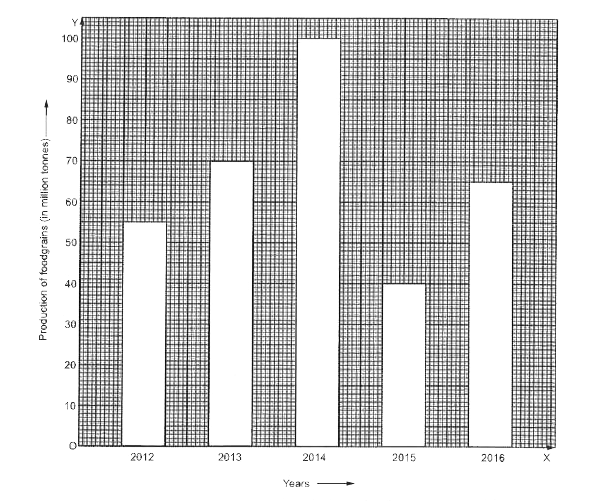
View SolutionRead the bar graph given below
Read the bar graph carefully and answer the following questions
Q(i) What information is given by the bar graph
(ii) In which year was the production maximum
(iii) After which year was there a sudden fall in the production
(iv) Find the ratio between the maximum production and the minimum production during the given period
View SolutionRead the bar graph given below and answer the following questions:

In which year is the number of students maximum?
View SolutionRead the bar graph carefully and answer the following questions.
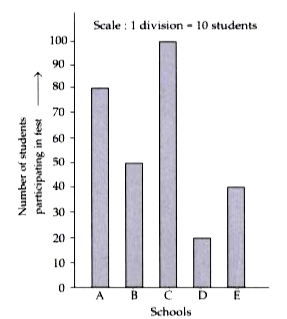 From which school maximum number of students participated ?
View Solution
