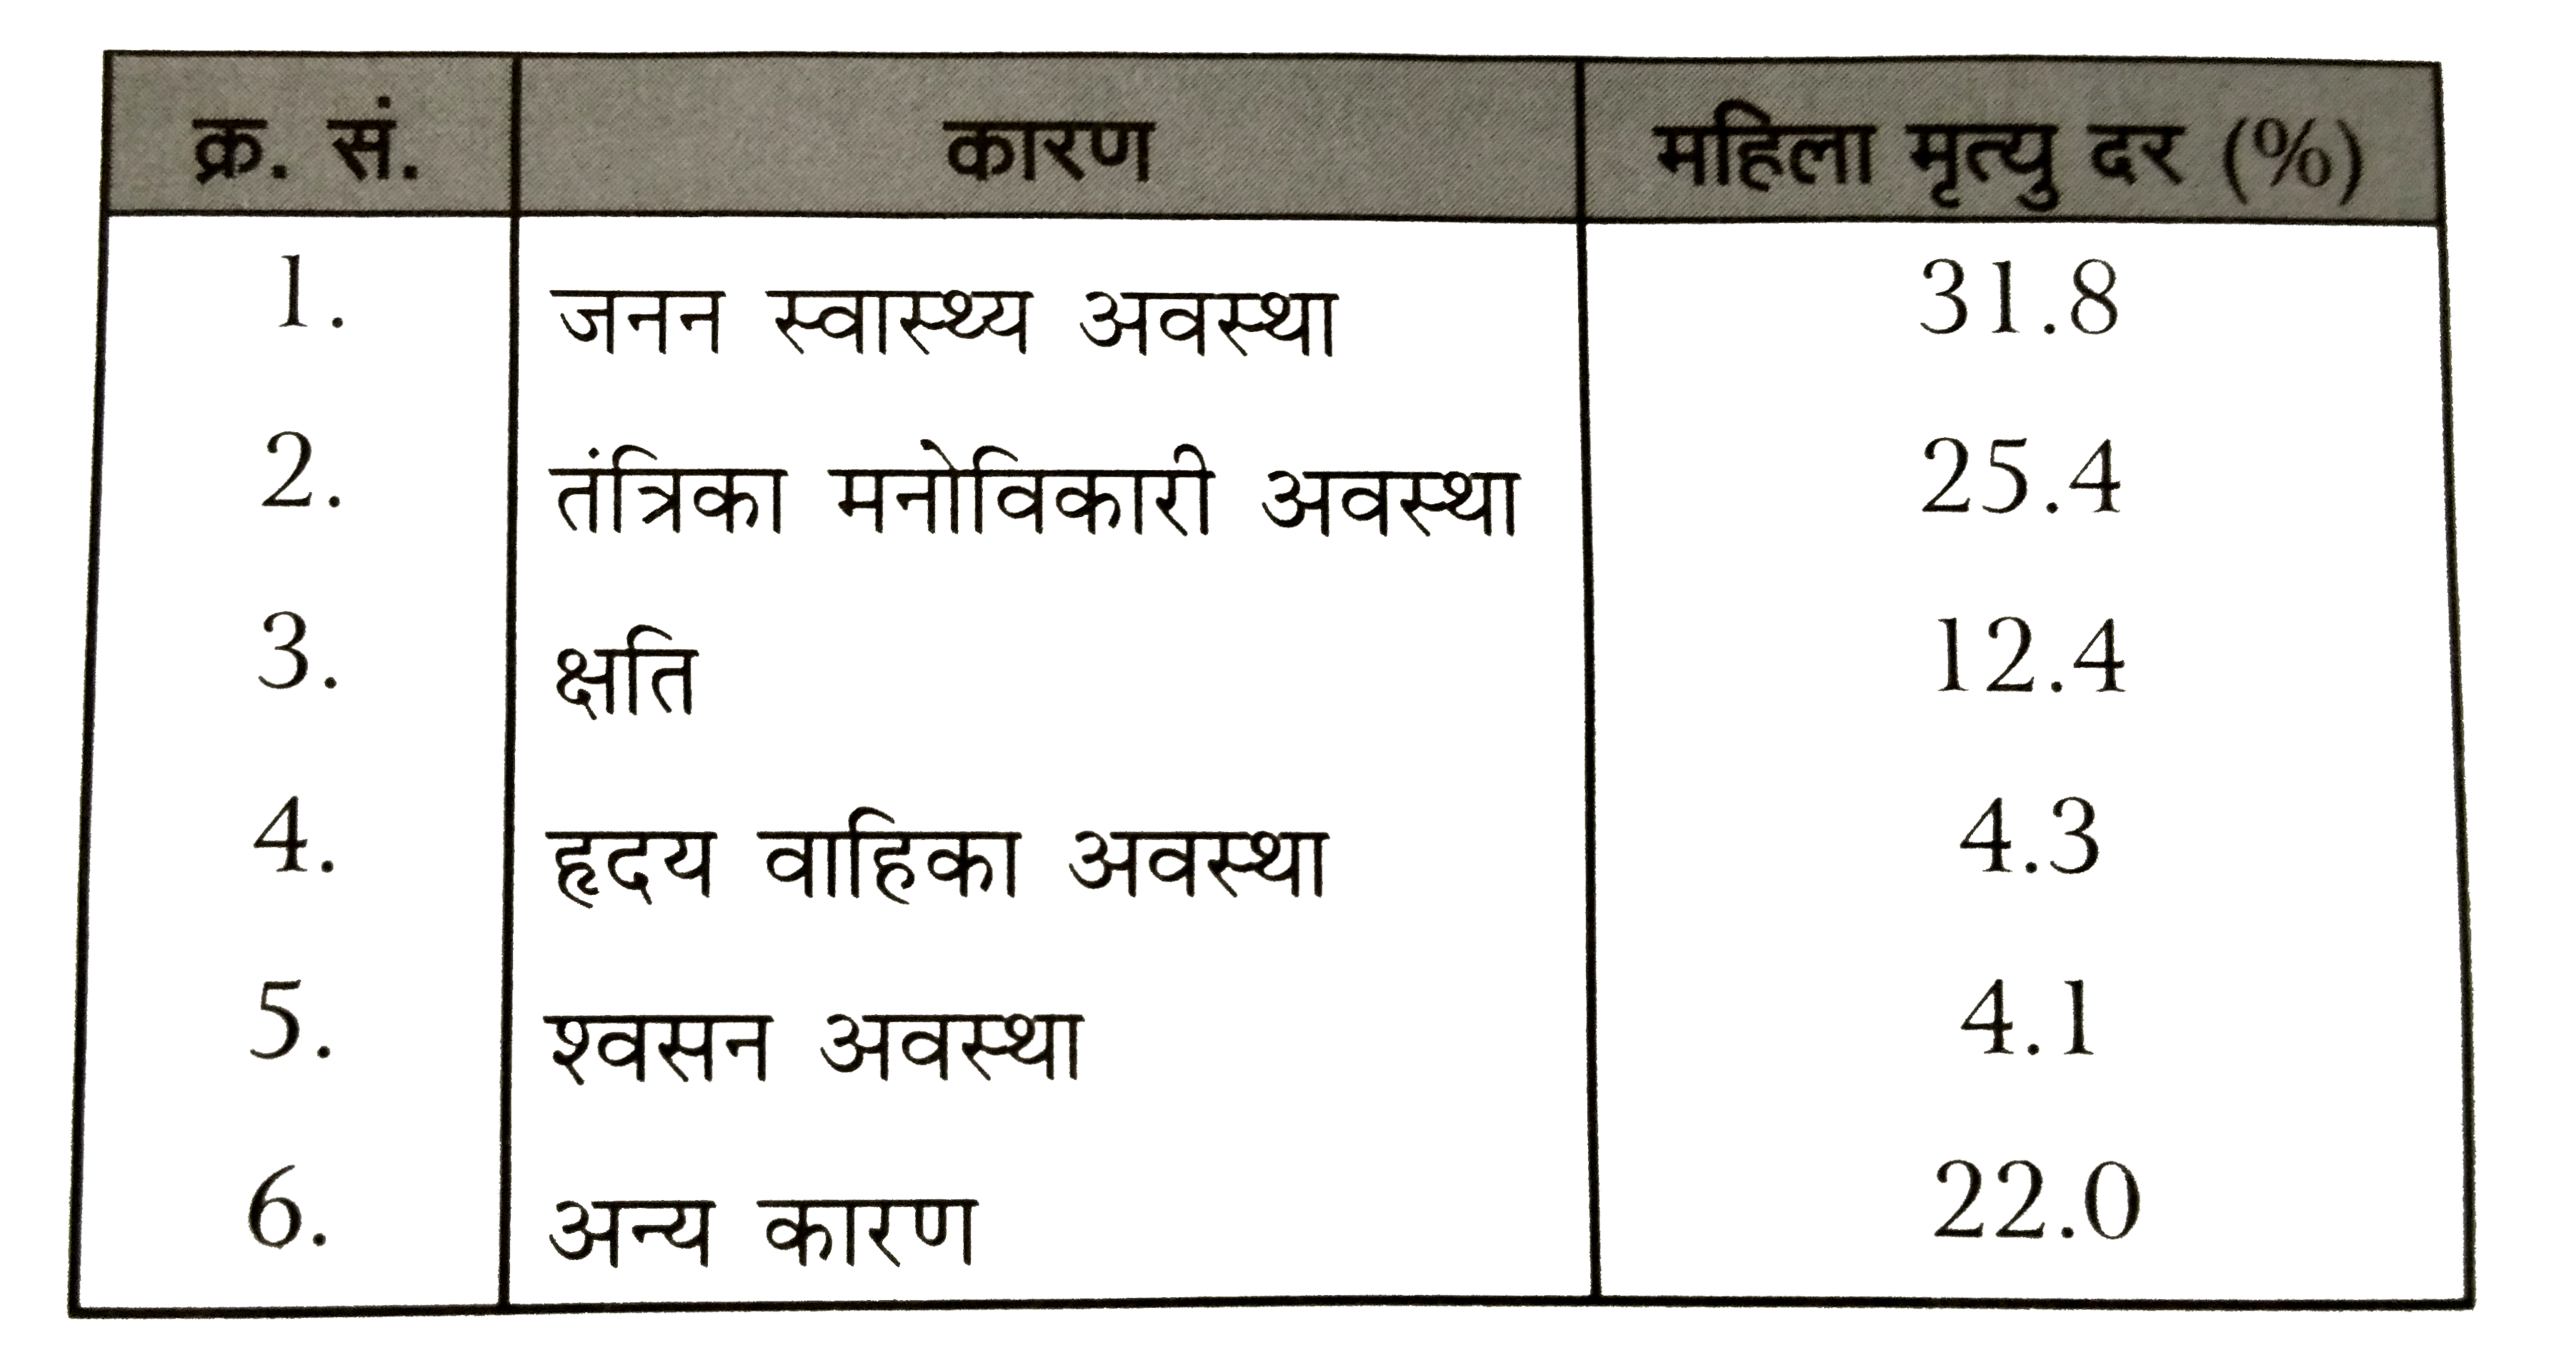
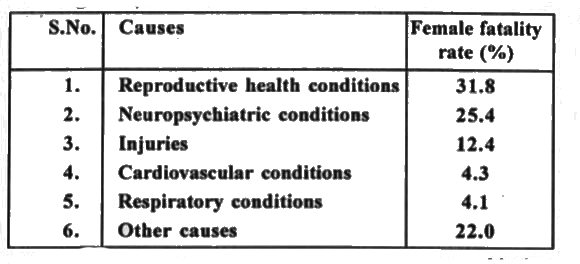
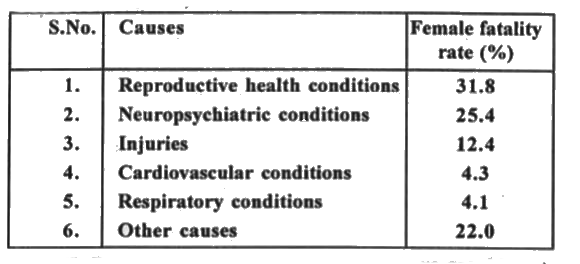
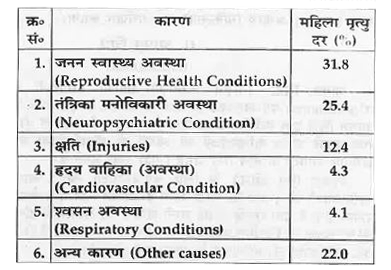
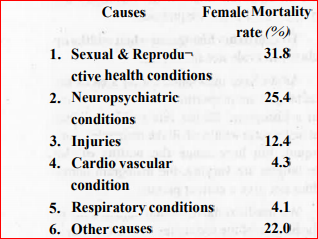
A survey conducted by an organisation for the cause of illness and death among the women between the ages 15−44 (in years) worldwide, found the following figure (in%):
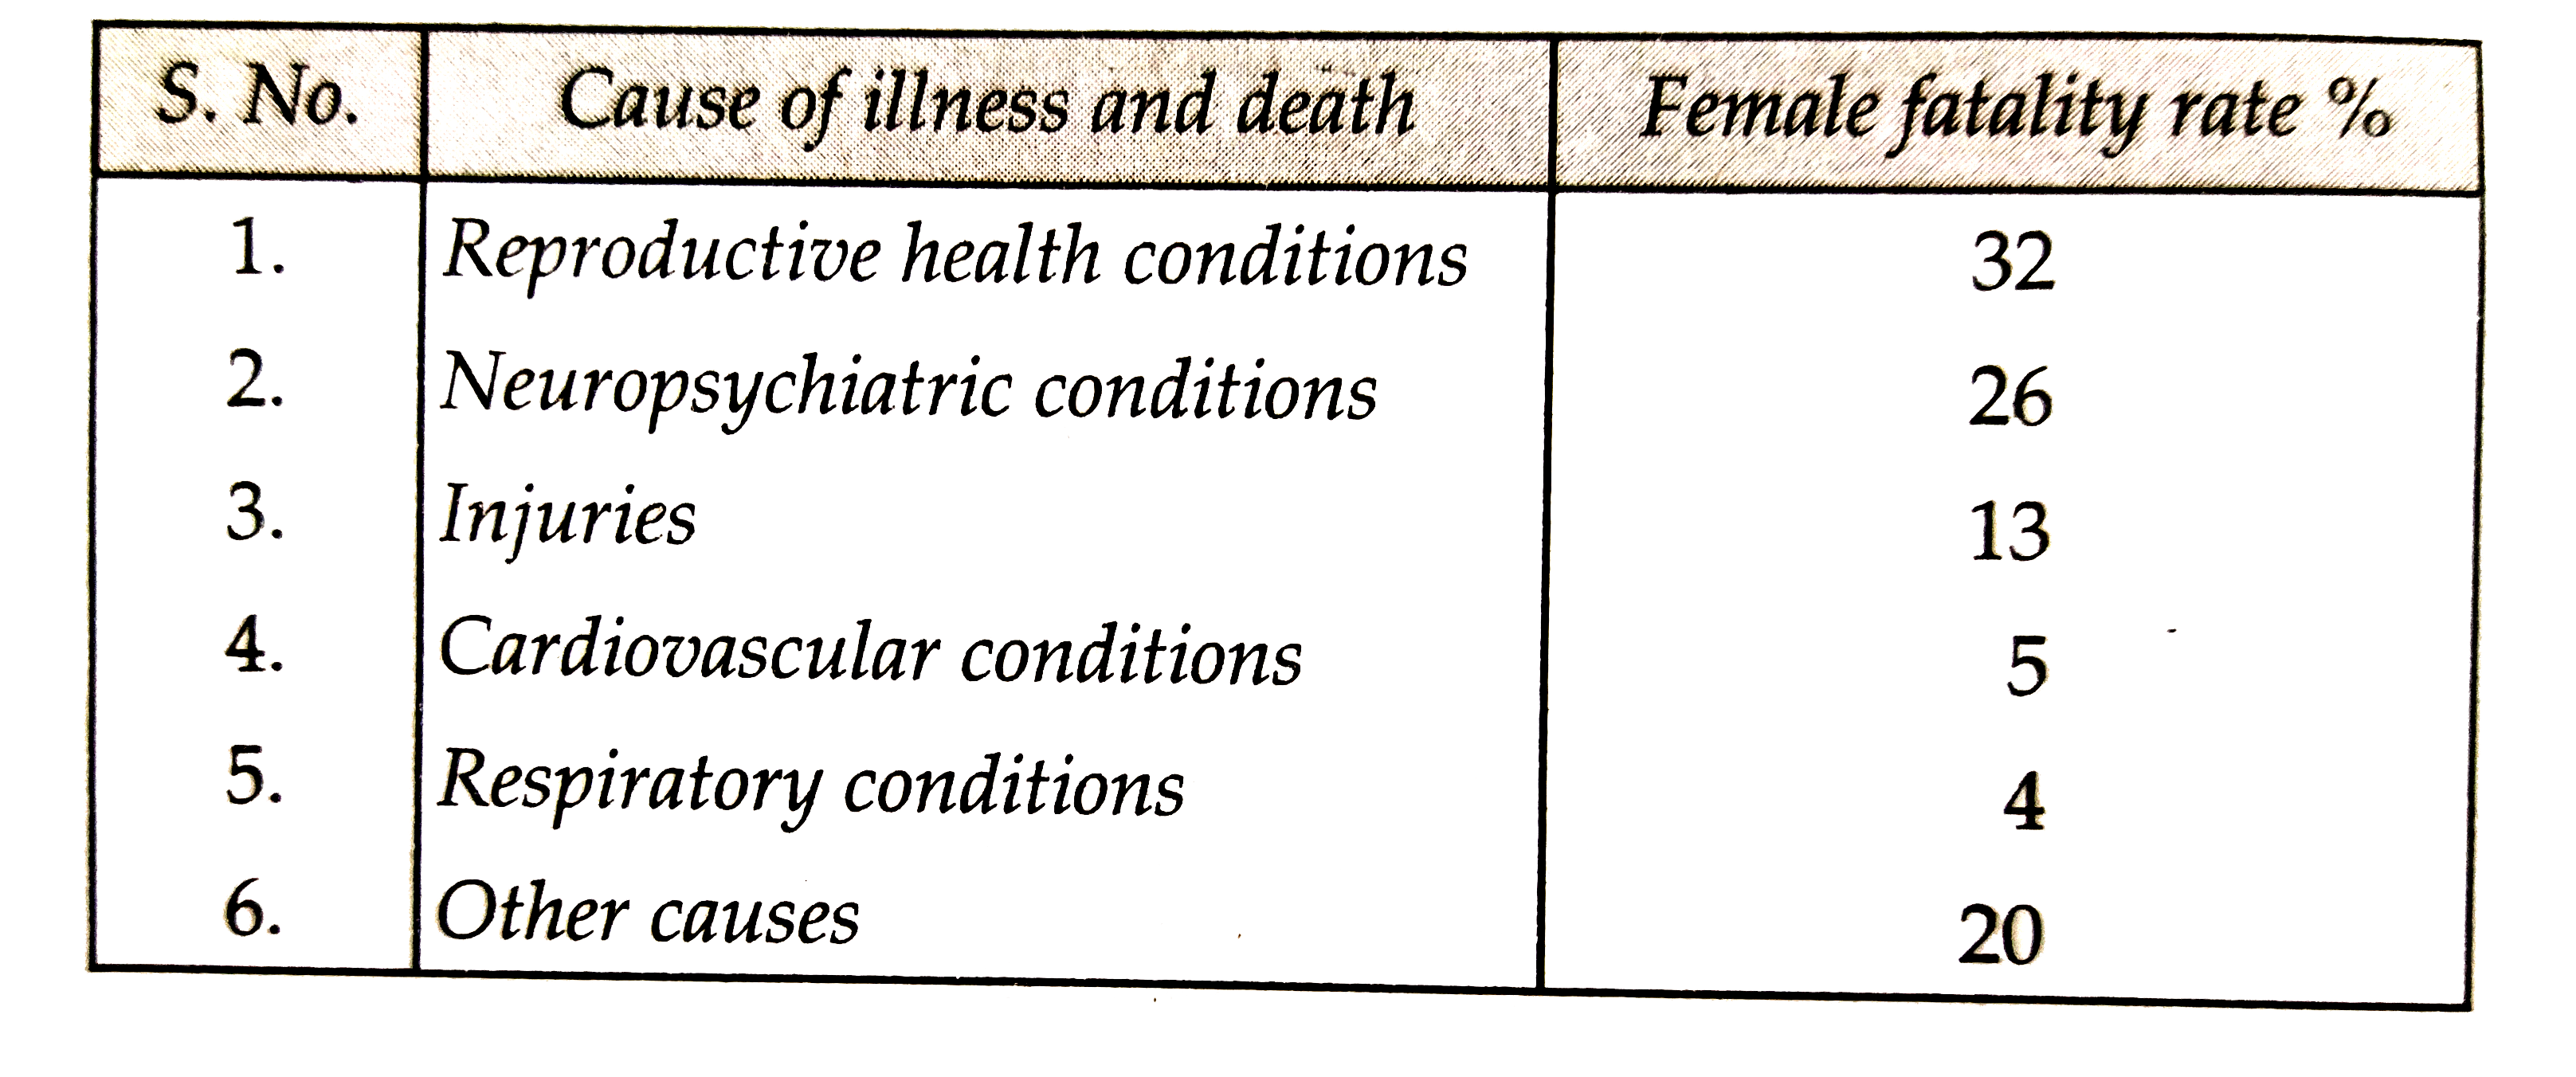
(i) Represent the information given above graphically.
(ii) Which condition is the major cause of women's ill health and death worldwide?
Take the causes of illness and death among the women along the x-axis and the female fatality rate % along the y-axis. Draw the bars of the same width having their heights proportional to female fatality rate %, keeping the same space between two consecutive bars, as shown below.
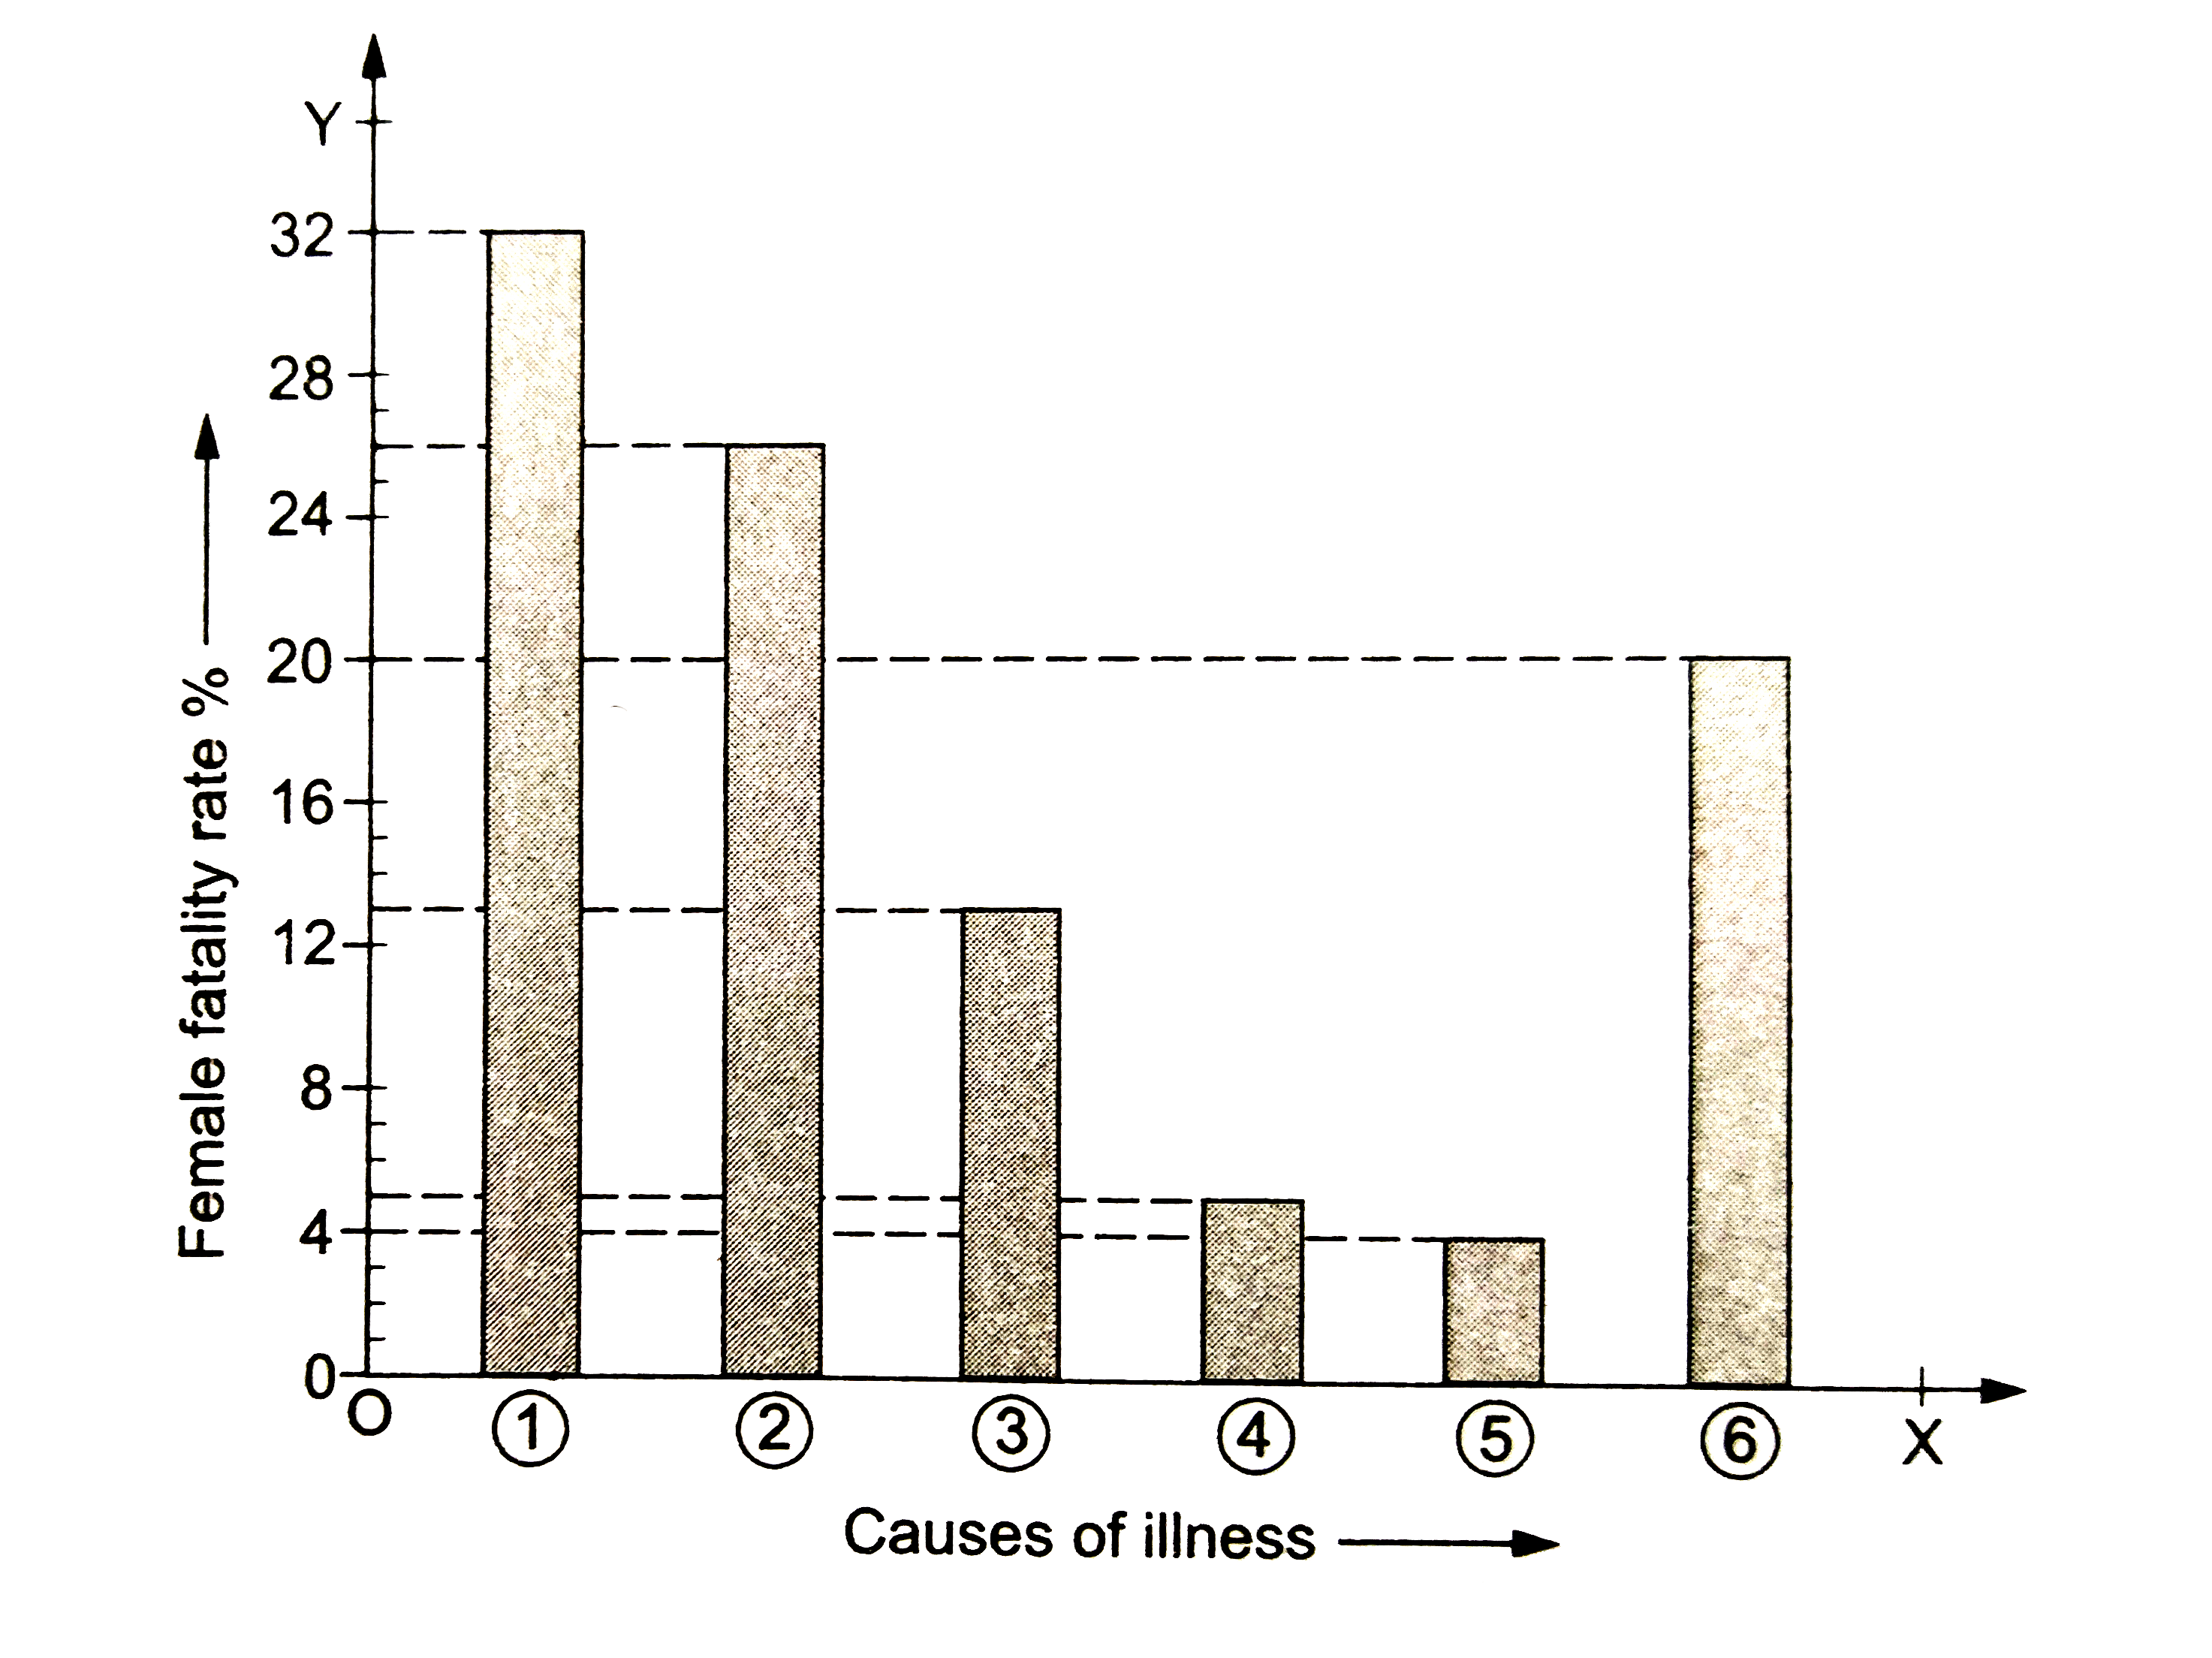
(i) The required information has been given above graphically.
(ii) Clearly, the reproductive health conditions are the major cause of women's ill health and death worldwide.
Topper's Solved these Questions
- BAR GRAPH, HISTOGRAM AND FREQUENCY POLYGONBOOK - RS AGGARWALCHAPTER - BAR GRAPH, HISTOGRAM AND FREQUENCY POLYGONEXERCISE - EXAMPLE
11 Videos
- BAR GRAPH, HISTOGRAM AND FREQUENCY POLYGONBOOK - RS AGGARWALCHAPTER - BAR GRAPH, HISTOGRAM AND FREQUENCY POLYGONEXERCISE - EXERCISE 17A
12 Videos
- AREAS OF TRIANGLES AND QUADRILATERALSBOOK - RS AGGARWALCHAPTER - AREAS OF TRIANGLES AND QUADRILATERALSEXERCISE - Multiple Choice Questions (Mcq)
16 Videos
- CIRCLES BOOK - RS AGGARWALCHAPTER - CIRCLES EXERCISE - MULTIPLE CHOICE QUESTION(MCQ)
37 Videos
Similar Questions
Represent the following frequency distribution by means of a histogram:

View SolutionThe following table shows the number of students participating in various games in a school.

Draw a bar graph to represent the above data.
View SolutionIn a ΔABC, it given that base = 12 cm and height = 5 cm. Its area is
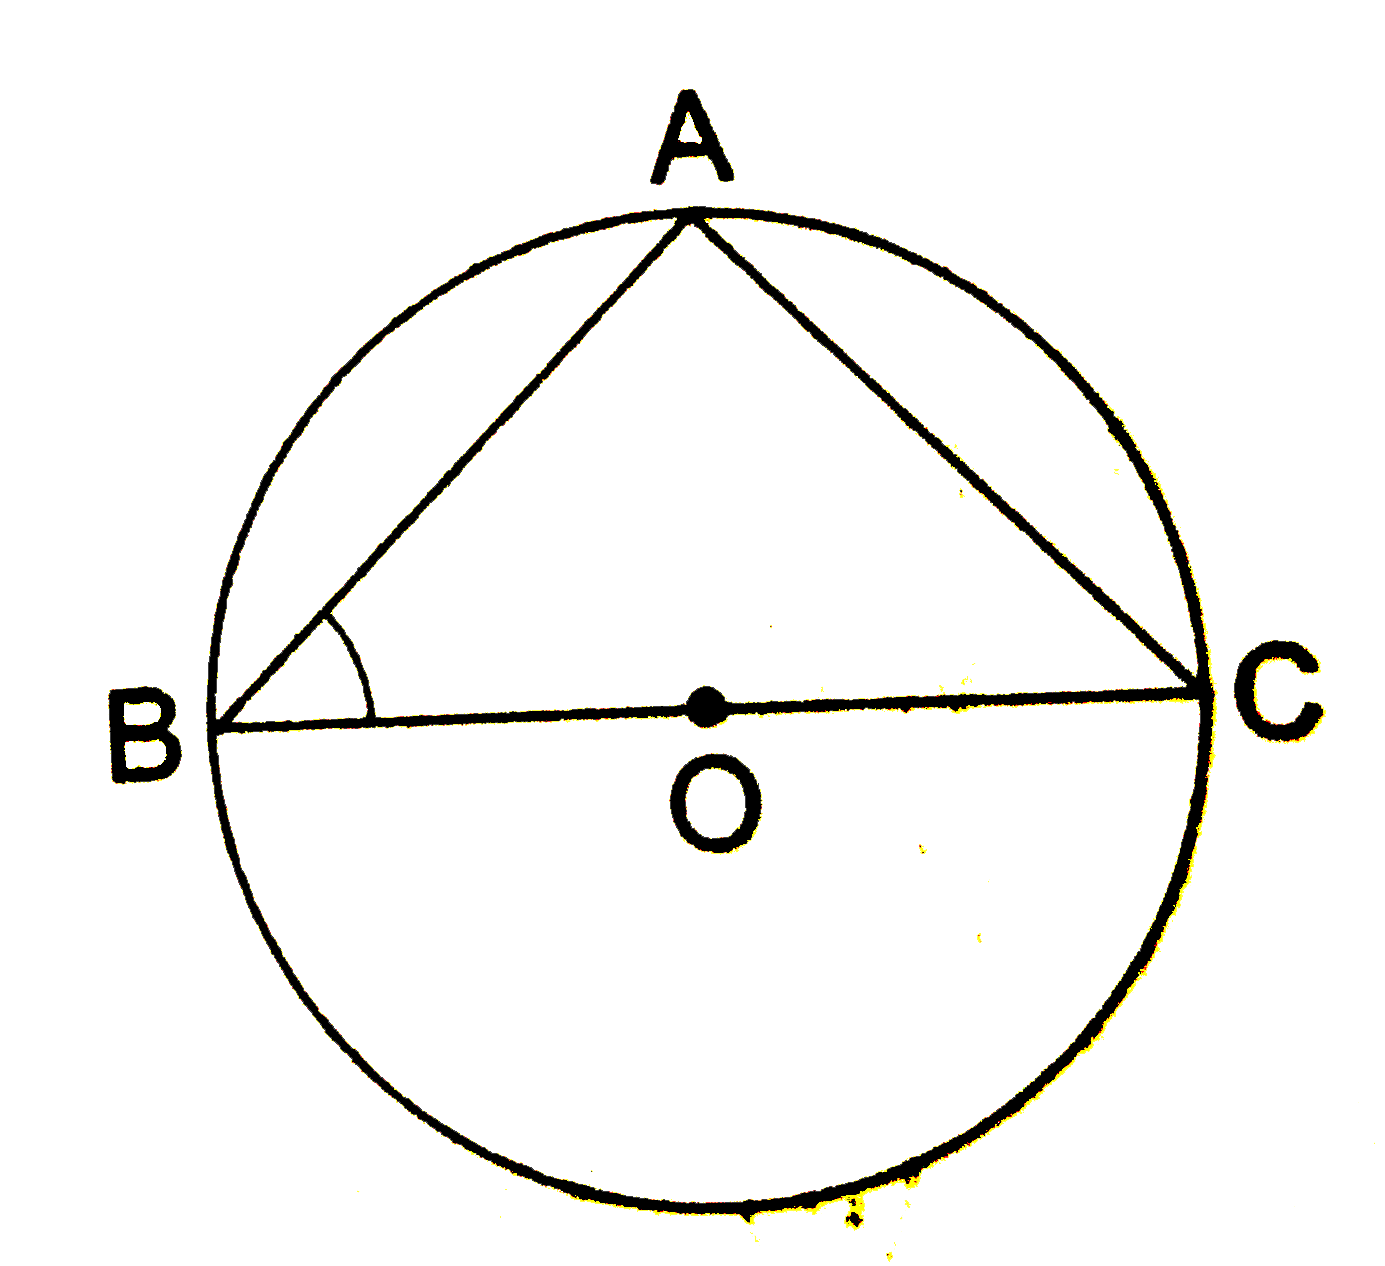
View SolutionIn the given figure, BOC is a diameter of a circle and AB=AC . Then , ∠ABC=?
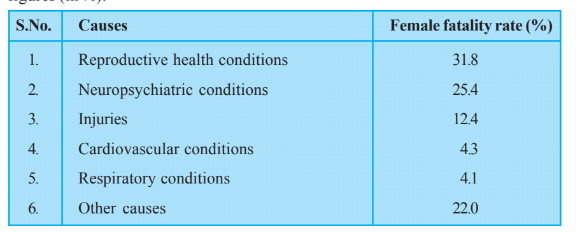
View SolutionA survey conducted by an organization for the cause of illness and death among the women between the ages 15 - 44 (in years) worldwide, found the following figures (in %):
View SolutionMatch the following Column A to Column B

View SolutionThe inequation represented by the graph given below is :
View Solutionएक संगठन ने पूरे विश्व में 15-44 ( वर्षों में ) की आय वाली महिलाओं में बीमारी और मृत्यु के कारणों का पता लगाने के लिए किए गए सर्वेक्षण से निम्नलिखित आँकडे ( % में) प्राप्त किए :
(i) ऊपर दी गई सूचनाओं को आलेखीय रूप से निरूपित कीजिए।
(ii) कौन-सी अवस्था पूरे विश्व की महिलाओं के खराब स्वास्थ और मृत्यु का बड़ा कारण है?
(iii) अपनी अध्यापिका की सहायता से ऐसे दो कारणों का पता लगाने का प्रयास कीजिए जिनकी ऊपर (ii) में मुख्य भूमिका रही हो ।
View Solutionविश्व स्तर पर किए गए एक सर्वेक्ष्ण से 15-44 वर्षो की आयुवाली उपज रूस में सर्वाधिक एवं बीमारी और मृत्यु के कारणों का जो पता चला वो निम्नांकित आकड़े (% में ) में दिए गए है :
(i) उपर्युक्त सूचनाओं को आलेखीय रूप में निरूपित करे |
(ii) महिलाओं के मृत्यु का प्रमुख कारन कौन-सी अवस्था है ?
View SolutionA survey conducted by an organisation for the cause of illness nad death among the women between the ages 15-44 (in years) worldwide, found the following figures (in %) :
(ii) Which condition is the major cause of women's ill health and death worldwide ?
View SolutionA survey conducted by an organisation for the cause of illness nad death among the women between the ages 15-44 (in years) worldwide, found the following figures (in %) :
(iii) Try to find out, with the help of your teacher, any two factors which play a major role in the cause in (ii) above being the major cause.
View Solutionएक संगठन ने पूरे विश्व में 15-44 (वर्षों में) की आय वाली महिलाओं में बीमारी एवं मृत्यु के कारणों का पता लगाने के लिए किए गए सर्वेक्षण में निम्नलिखित आँकड़े (%) में प्राप्त किये।
(i) ऊपर दी गयी सूचनाओं को आलेखीय रूप में निरूपित करें।
(ii) कौन-सी अवस्था पूरे विश्व की महिलाओं के खराब स्वास्थ्य और मृत्यु का बड़ा कारण है?
(iii) अपने शिक्षक की सहायता से ऐसे तीन कारणों का पता लगाने का प्रयास करें जिनके ऊपर (ii) में मुख्य भूमिका रही है।
View SolutionA survey conducted by an organisation for the cause of illness and death among the women between the ages 15 - 44 (in years) worldwide, found the following figures (in %):
View SolutionThe following data on the number of girls (to the nearest ten) per thousand boys in different sections of Indian society is given below:
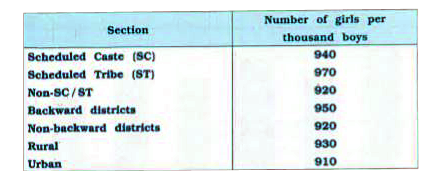
(i) Represent the information above by a bar graph. (ii) In the classroom discuss what conclusions can be arrived at from the graph.
View SolutionA survey conducted by an organisation for the cause of illness and death among the women between the ages 15 - 44 (in years) worldwide, found the following figures (in%)
(##MBD_MAT_XI_C14_S04_001_Q01.png" width="80%"> Represent the information given above graphically :
View SolutionA survey conducted by an organisation for the cause of illness and death among the women between the ages 15 - 44 (in years) worldwide, found the following figures (in%)
 : Which condition is the major cause of women’sill health and death worldwide ?
View Solution
