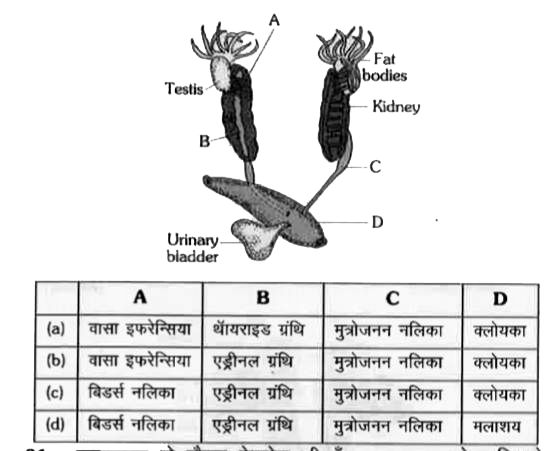
निम्न आरेख का अवलोकन कीजिए जो मेढ़क के नर जननतंत्र को दर्शाता है। A, B, C तथा D को पहचानिए

The correct Answer is:B
Step by step video, text & image solution for निम्न आरेख का अवलोकन कीजिए जो मेढ़क के नर जननतंत्र को दर्शाता है। A, B, C तथा D को पहचानिए by Biology experts to help you in doubts & scoring excellent marks in Class 12 exams.
Updated on:21/07/2023Topper's Solved these Questions
- जन्तुओं की आकारिकीBOOK - ERRORLESS HINDICHAPTER - जन्तुओं की आकारिकीEXERCISE - ORDINARY THINKING OBJECTIVE QUESTIONS (चूहे की आकारिकी)
28 Videos
- जन्तुओं की आकारिकीBOOK - ERRORLESS HINDICHAPTER - जन्तुओं की आकारिकीEXERCISE - CRITICAL THINKING (OBJECTIVE QUESTIONS)
16 Videos
- जन्तु ऊतक BOOK - ERRORLESS HINDICHAPTER - जन्तु ऊतक EXERCISE - जन्तु ऊतक (SELF EVALUATION TEST )
28 Videos
- जीवों में जननBOOK - ERRORLESS HINDICHAPTER - जीवों में जननEXERCISE - जीवों में जनन (Self Evaluation Test)
14 Videos
Similar Questions
चूहे का सबसे महत्वपूर्ण स्तनधारी लक्षण है
View Solutionमेंढ़क में पायी जाती हैं
View Solutionनिम्न में से कौनसा युग्म गलत मिलाया गया है
View Solutionपूर्ण-सशक्त कोशिका (Totipotent cell) का अर्थ है
View Solutionउस सरल रेखा का समीकरण ज्ञात कीजिए ,जो रेखाये x−y−6=0 तथा 7x−5y=36 के प्रतिच्छेद बिंदु को मूलबिंदु से मिलती है ।
View Solutionउस सरल रेखा का समीकरण ज्ञात कीजिए जो बिन्दु (a,b,c) से होकर जाती है तथा Y-अक्ष के समान्तरहै।
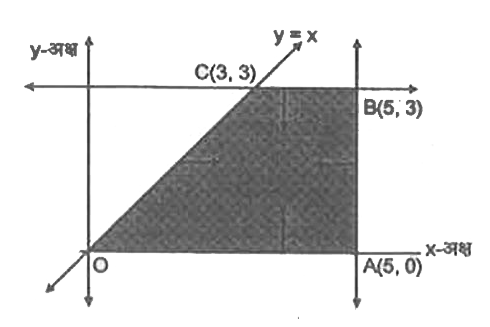
View Solutionदिये गये चित्र में छायांकित भाग निम्न सुसंगत क्षेत्र को दर्शाता है -

तो प्रतिबन्ध है -
View Solutionउस बिन्दु के निर्देशांक ज्ञात कीजिए, जो बिन्दुओं (4,-3) तथा (8,5) को मिलाने वाली रेखा को 3:1 में बाह्यतः विभाजित करता है।
View Solution
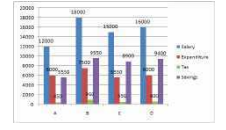
The graph represents the salary, expenditure, tax and savings (in rupees) per month of the persons A, B, C and D. Study the graph and answer the question. The expenditure as a percentage of salary is the least for:
उपरोक्त आरेख व्यक्ति A, B, C और D के प्रतिमाह वेतन, व्यय, कर तथा बचत ( रुपये में) को दर्शाता है। इस आरेख का अध्ययन करें तथा प्रश्न का उत्तर दें। वेतन(Salary) के प्रतिशत के रूप में सबसे कम व्यय(Expenditure) किसका है?
View Solution
The above graph represents the salary, expenditure, tax and savings (in rupees) per month of the persons A, B, C and D. Study the graph and answer the question. The expenditure as a percentage of salary is the least for:
उपरोक्त आरेख व्यक्ति A, B, C और D के प्रतिमाह वेतन, व्यय, कर तथा बचत ( रुपये में) को दर्शाता है। इस आरेख का अध्ययन करें तथा प्रश्न का उत्तर दें। वेतन(Salary) के प्रतिशत के रूप में सबसे कम कर(Tax) किसका है?
View Solution
The graph represents the salary, expenditure, tax and savings (in rupees) per month of the persons A, B, C and D. Study the graph and answer the question. Savings as a percentage of salary is highest in case of:
उपरोक्त आरेख व्यक्ति A, B, C और D के प्रतिमाह वेतन, व्यय, कर तथा बचत ( रुपये में) को दर्शाता है। इस आरेख का अध्ययन करें तथा प्रश्न का उत्तर दें। वेतन(Salary) के प्रतिशत के रूप में सबसे अधिक बचत(Saving) किसका है?
View Solutionअवलोकन को आकलन की भाग तभी कहा जा सकता है जब अवलोकन:
View SolutionSelect the Venn diagram that best illustrates the relationship between the following classes.
उस वेन आरेख का चयन करें जो निम्नलिखित वर्गों के बीच संबंध को सर्वश्रेष्ठ संबंध को दर्शाता है | Raw Material , Labourers , Machines कच्चा माल, श्रमिक, मशीनें
View SolutionIn the following figure, Circle represents Surgeons, Triangle represents Doctors, Rectangle represents Professionals and Pentagon represents Indians. Which number represents Indian Doctors who are also Surgeons?/
/नीचे दी गयी आकृति में, वृत्त “सर्जन' को दर्शाता है, त्रिभुज 'चिकित्सकों' को दर्शाता है, आयत “पेशेवरों' को दर्शाता है तथा पंचभुज 'भारतीयों' को दर्शाता है | कौन सी संख्या उन भारतीय चिकित्सकों को दर्शाती है जो सर्जन भी हैं ?
View SolutionIn the given Venn diagram, A denotes mangoes, B denotes bananas, C denotes apples, and the numbers in each section represent the number of persons who like fruits. How many persons like only bananas? / दिए गए वेंन आरेख में, A आम को, B केले को, C सेब को दर्शाता है | प्रत्येक अंक उस अनुभाग के फलों को पसंद करने वाले लोगों ही दर्शाता है | कितने लोगों को केवल केले पसंद है?
View Solution0. Select the Venn diagram that best illustrates the relationship between the following classes. Infants, Father, Males उस वेन आरेख का चयन कीजिए जो निम्नलिखित वर्गों के बीच सर्वश्रेष्ठ संबंध को दर्शाता है। नवजात, पिता, पुरुष
View Solution
