Directions : The Piechart shows Distribution of Special Children Population the year 1994-96. Study the pie-chart and answer the following questions
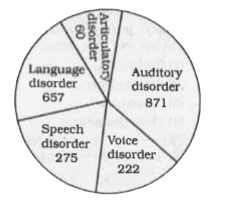
What is the average number of cases in different types of special children during the year 1994-96?
417
413
433
465
The correct Answer is:A
Required average = 20855=417
Similar Questions
Directions : The Piechart shows Distribution of Special Children Population the year 1994-96. Study the pie-chart and answer the following questions
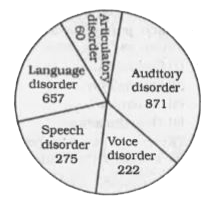
Find the approximate percentage distribution of children with auditory disorder.View SolutionDirections : The Piechart shows Distribution of Special Children Population the year 1994-96. Study the pie-chart and answer the following questions
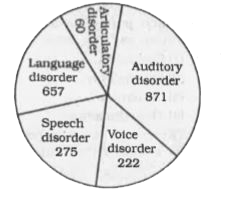
Find the ratio between articulatory disorder and speech disorder cases.View Solution
Knowledge Check
- Question 1 - Select One
The pie-chart shows Distribution of Special Children Population during the year 1994-96. Study the pie-chart and answer the following questions.
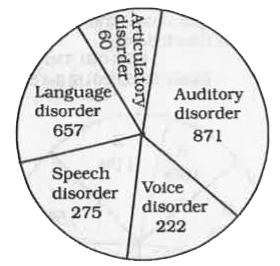
What is the average number of cases in different types of special children during the year 1994-96?A417B413C433D465 - Question 2 - Select One
Directions : The Paichart shows Distribution of Spacial Childern Population the year 1994-96. Study the pie-chart and answer the following questions

Find the ratio between atrticulatory diorder and speech disorder cases.A43.7%B42.7%C41.7%D40.7% - Question 3 - Select One
The pie-chart shows Distribution of Special Children Population during the year 1994-96. Study the pie-chart and answer the following questions.
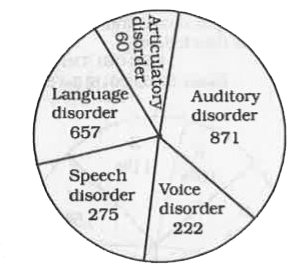
Find the ratio between articulatory disorder and speech disorder cases.A21:55B55:21C55:12D12:55
Directions : The Piechart shows Distribution of Special Children Population the year 1994-96. Study the pie-chart and answer the following questions
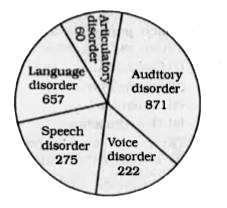
What is the respective ratio between language disorder and the average of the remaining disorder cases?View SolutionDirection: Study the chart and answer the following questions

What is the average expenditure spent on different five sector over the year?View SolutionDirections : The Paichart shows Distribution of Spacial Childern Population the year 1994-96. Study the pie-chart and answer the following questions

What is the respective ratio between language disorder and the average pf the remaining disorder cases?View SolutionThe pie chart shows the breakup of expenditure of a college for the year 2017. Study the diagram and answer the following questions.
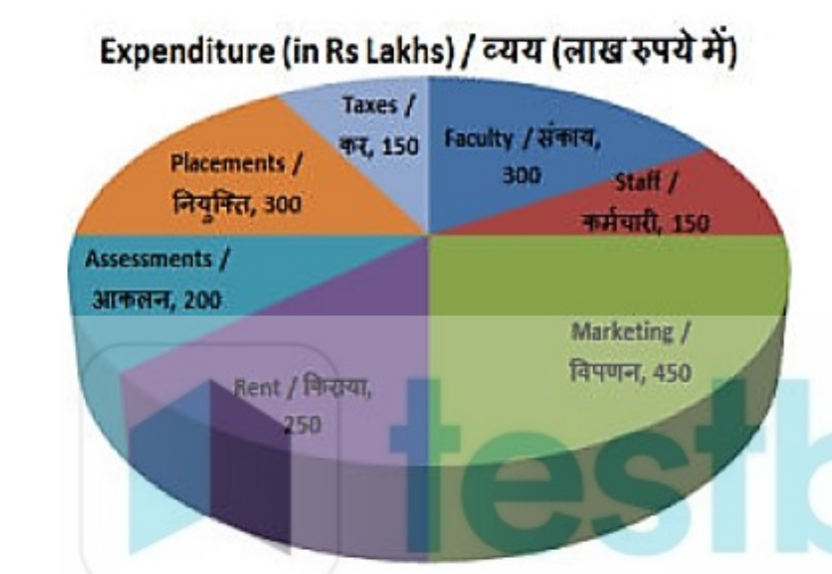
What is the total expenditure (in Rs lakhs)?View SolutionStudy the graph carefully and answer the following questions.
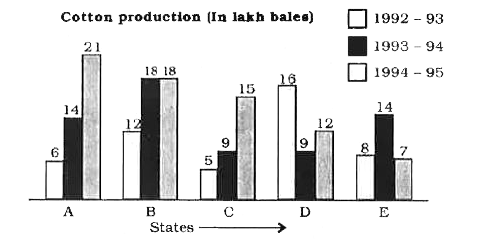
What is the average production of the four states in the year 1994-95 taken together ?View Solution
