A life insurance agent found the following data for distribution of ages of 100 policy holders. Calculate the median age, if policies are given only to persons having age 18 years onwards but less than 60 years.
Age (in years)Number of policy holdersAge (in years)Number of policy holdersBelow 20 2Below 45 89Below 25 6Below 50 92Below 30 24Below 55 98Below 35 45Below 60 100Below 40 78
The correct Answer is:35.76 YEARS
To calculate the median age of the policyholders based on the given data, we will follow these steps:
Step 1: Organize the Data into a Frequency Table
We will create a frequency table based on the age intervals provided in the question.
| Age Interval (Years) | Number of Policy Holders |
|----------------------|--------------------------|
| Below 20 | 2 |
| Below 25 | 6 |
| Below 30 | 24 |
| Below 35 | 45 |
| Below 40 | 78 |
| Below 45 | 89 |
| Below 50 | 92 |
| Below 55 | 98 |
| Below 60 | 100 |
Step 2: Calculate the Frequency for Each Age Interval
We will calculate the frequency for each age interval by subtracting the cumulative frequencies.
| Age Interval (Years) | Frequency |
|----------------------|-----------|
| 18-20 | 2 |
| 20-25 | 4 |
| 25-30 | 18 |
| 30-35 | 21 |
| 35-40 | 33 |
| 40-45 | 11 |
| 45-50 | 3 |
| 50-55 | 6 |
| 55-60 | 2 |
Step 3: Create the Cumulative Frequency Table
Next, we will create a cumulative frequency table.
| Age Interval (Years) | Frequency | Cumulative Frequency |
|----------------------|-----------|----------------------|
| 18-20 | 2 | 2 |
| 20-25 | 4 | 6 |
| 25-30 | 18 | 24 |
| 30-35 | 21 | 45 |
| 35-40 | 33 | 78 |
| 40-45 | 11 | 89 |
| 45-50 | 3 | 92 |
| 50-55 | 6 | 98 |
| 55-60 | 2 | 100 |
Step 4: Identify the Median Class
To find the median, we first need to find n (the total number of policyholders), which is 100. Then, we calculate n/2:
n/2=100/2=50
Now, we look for the cumulative frequency that is just greater than or equal to 50. From the cumulative frequency table, we see that the median class is 35-40 years (since the cumulative frequency is 78).
Step 5: Apply the Median Formula
The formula for the median is:
Median=L+(n/2−CFF)×H
Where:
- L = lower limit of the median class = 35
- n = total frequency = 100
- CF = cumulative frequency of the class before the median class = 45
- F = frequency of the median class = 33
- H = width of the median class = 5
Substituting the values into the formula:
Median=35+(50−4533)×5
Calculating the values:
=35+(533)×5
=35+2533
Calculating 2533≈0.76:
Median≈35+0.76≈35.76
Final Answer
The median age of the policyholders is approximately 35.76 years.
---
We will create a frequency table based on the age intervals provided in the question.
|----------------------|--------------------------|
| Below 20 | 2 |
| Below 25 | 6 |
| Below 30 | 24 |
| Below 35 | 45 |
| Below 40 | 78 |
| Below 45 | 89 |
| Below 50 | 92 |
| Below 55 | 98 |
| Below 60 | 100 |
We will calculate the frequency for each age interval by subtracting the cumulative frequencies.
|----------------------|-----------|
| 18-20 | 2 |
| 20-25 | 4 |
| 25-30 | 18 |
| 30-35 | 21 |
| 35-40 | 33 |
| 40-45 | 11 |
| 45-50 | 3 |
| 50-55 | 6 |
| 55-60 | 2 |
Next, we will create a cumulative frequency table.
|----------------------|-----------|----------------------|
| 18-20 | 2 | 2 |
| 20-25 | 4 | 6 |
| 25-30 | 18 | 24 |
| 30-35 | 21 | 45 |
| 35-40 | 33 | 78 |
| 40-45 | 11 | 89 |
| 45-50 | 3 | 92 |
| 50-55 | 6 | 98 |
| 55-60 | 2 | 100 |
To find the median, we first need to find n (the total number of policyholders), which is 100. Then, we calculate n/2:
The formula for the median is:
- L = lower limit of the median class = 35
- n = total frequency = 100
- CF = cumulative frequency of the class before the median class = 45
- F = frequency of the median class = 33
- H = width of the median class = 5
The median age of the policyholders is approximately 35.76 years.
Topper's Solved these Questions
- MODEL QUESTION PAPER - 1 BOOK - VK GLOBAL PUBLICATIONCHAPTER - MODEL QUESTION PAPER - 1 EXERCISE - SECTION - B
6 Videos
- MID TERM TEST PAPER BOOK - VK GLOBAL PUBLICATIONCHAPTER - MID TERM TEST PAPER EXERCISE - SECTION -D
7 Videos
- MODEL QUESTION PAPER - 9 [UNSOLVED]BOOK - VK GLOBAL PUBLICATIONCHAPTER - MODEL QUESTION PAPER - 9 [UNSOLVED]EXERCISE - SECTION - D
7 Videos
Similar Questions
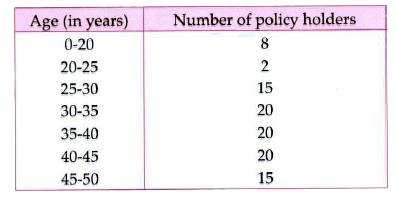
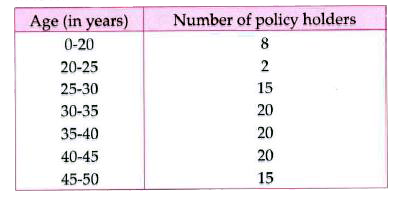
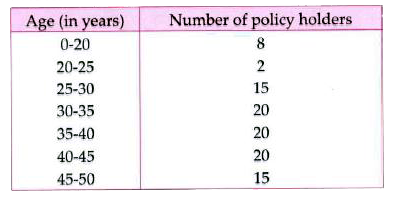
A life insurance agent found the following data for distribution of ages of 100 policy holders. A policy holder is chosen at random.

Find the difference between the probabili ties if policy holders are chosen randomly of age (30-35) years and of age (45-50) years.
View SolutionThe following is the cumulative frequency distribution (of less than type) of 1000 persons each of age of 20 years and above. Determine the mean age.

View Solution
Knowledge Check
A life insurance agent found the following data for distribution of ages of 100 policy holders. A policy holder is chosen at random.

Probability of policy holders chosen randomly of age less than 25 years isA1/5B1/10C1/100D2/25A life insurance agent found the following data for distribution of ages of 100 policy holders. A policy holder is chosen at random.

Find the sum of probabilities if a policy holder are chosen randomly of age (0-20) years and policy holders of age (25-30) yearsA3/20B2/25C23/100D3/25The frequency distribution data is given below. If the average age is 17 years, the value of m is:
Age in (years)8202629Number of people32m1A1B2C3D4
Calculate the mean deviatioin about median age for the age distribution of 100 persons given below:

View SolutionTom's age is five years less than thrice of Ben's age. If Ben is x years old, then Tom's age, in years, is
View SolutionTen years ago, Mohan's age was 35 years less than twice his present age. Find Mohan's present age (in years)
View SolutionTen years ago, Mohan's age was 35 years less than twice his present age. Find Mohan's present age (in years)
View SolutionThe ratio of ages of two persons is 5:9 and the age of one of them is greater than the other by 40 years. The sum of then-ages in year is:
View Solution
