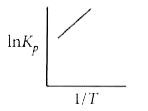
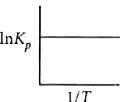
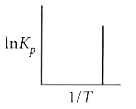
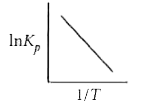
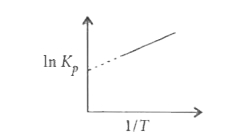
Which of the following plots represents an exothermic reaction?
A
B
C
D
Text Solution
The correct Answer is:A
We have the following relationship
lnKP=−ΔHRT + constant term
Now if ΔH is -ve , then the relation comes out to be :
lnKP=ΔHRT+ constant term
∴lnKP vs 1T graph is similar to y = mx + c where m and c both are positive . so the graph will be as below :
|
Updated on:21/07/2023
Related Playlists
- BOOK - MTG-WBJEECHAPTER - CHEMICAL ENERGETICSEXERCISE - WB JEE PREVIOUS YEARS QUESTIONS (ONE OR MORE THAN ONE OPTION CORRECT TYPE )2videos
CHEMICAL ENERGETICS
- BOOK - MTG-WBJEECHAPTER - CHEMICAL ENERGETICSEXERCISE - WB JEE WORKOUT (ONE OR MORE THAN ONE OPTION CORRECT TYPE)10videos
CHEMICAL ENERGETICS
- BOOK - MTG-WBJEECHAPTER - CHEMICAL DYNAMICS EXERCISE - WB JEE Previous Years Questions (CATEGORY 3 : One or More than One Option Correct Type)(2 Marks)2videos
CHEMICAL DYNAMICS
- BOOK - MTG-WBJEECHAPTER - CHEMICAL EQUILIBRIA EXERCISE - WB JEE PREVIOUS YEARS QUESTIONS (CATEGORY 2 : Single Option Correct Type )1videos
CHEMICAL EQUILIBRIA
Similar Questions
Which of the following graph represents an exothermix reaction?
View SolutionWhich plot represent an exothermic reaction ?
View SolutionWhich plot represent an exothermic reaction ?
View SolutionWhich of the following represents an exothermic reaction :-
View SolutionWhich of the following represents an exothermic reaction :-
View SolutionWhich of the following graphs represents exothermic reaction?
 View Solution
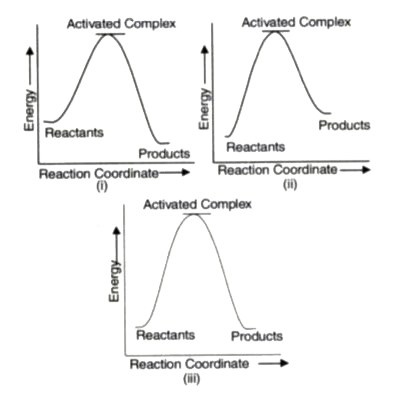
Which of the following graphs represents exothermic reaction ?
 View Solution
Which of the following graphs represents exothermic reaction ?
 View Solution
Which of the following graphs represents exothermic reaction ?
 View Solution
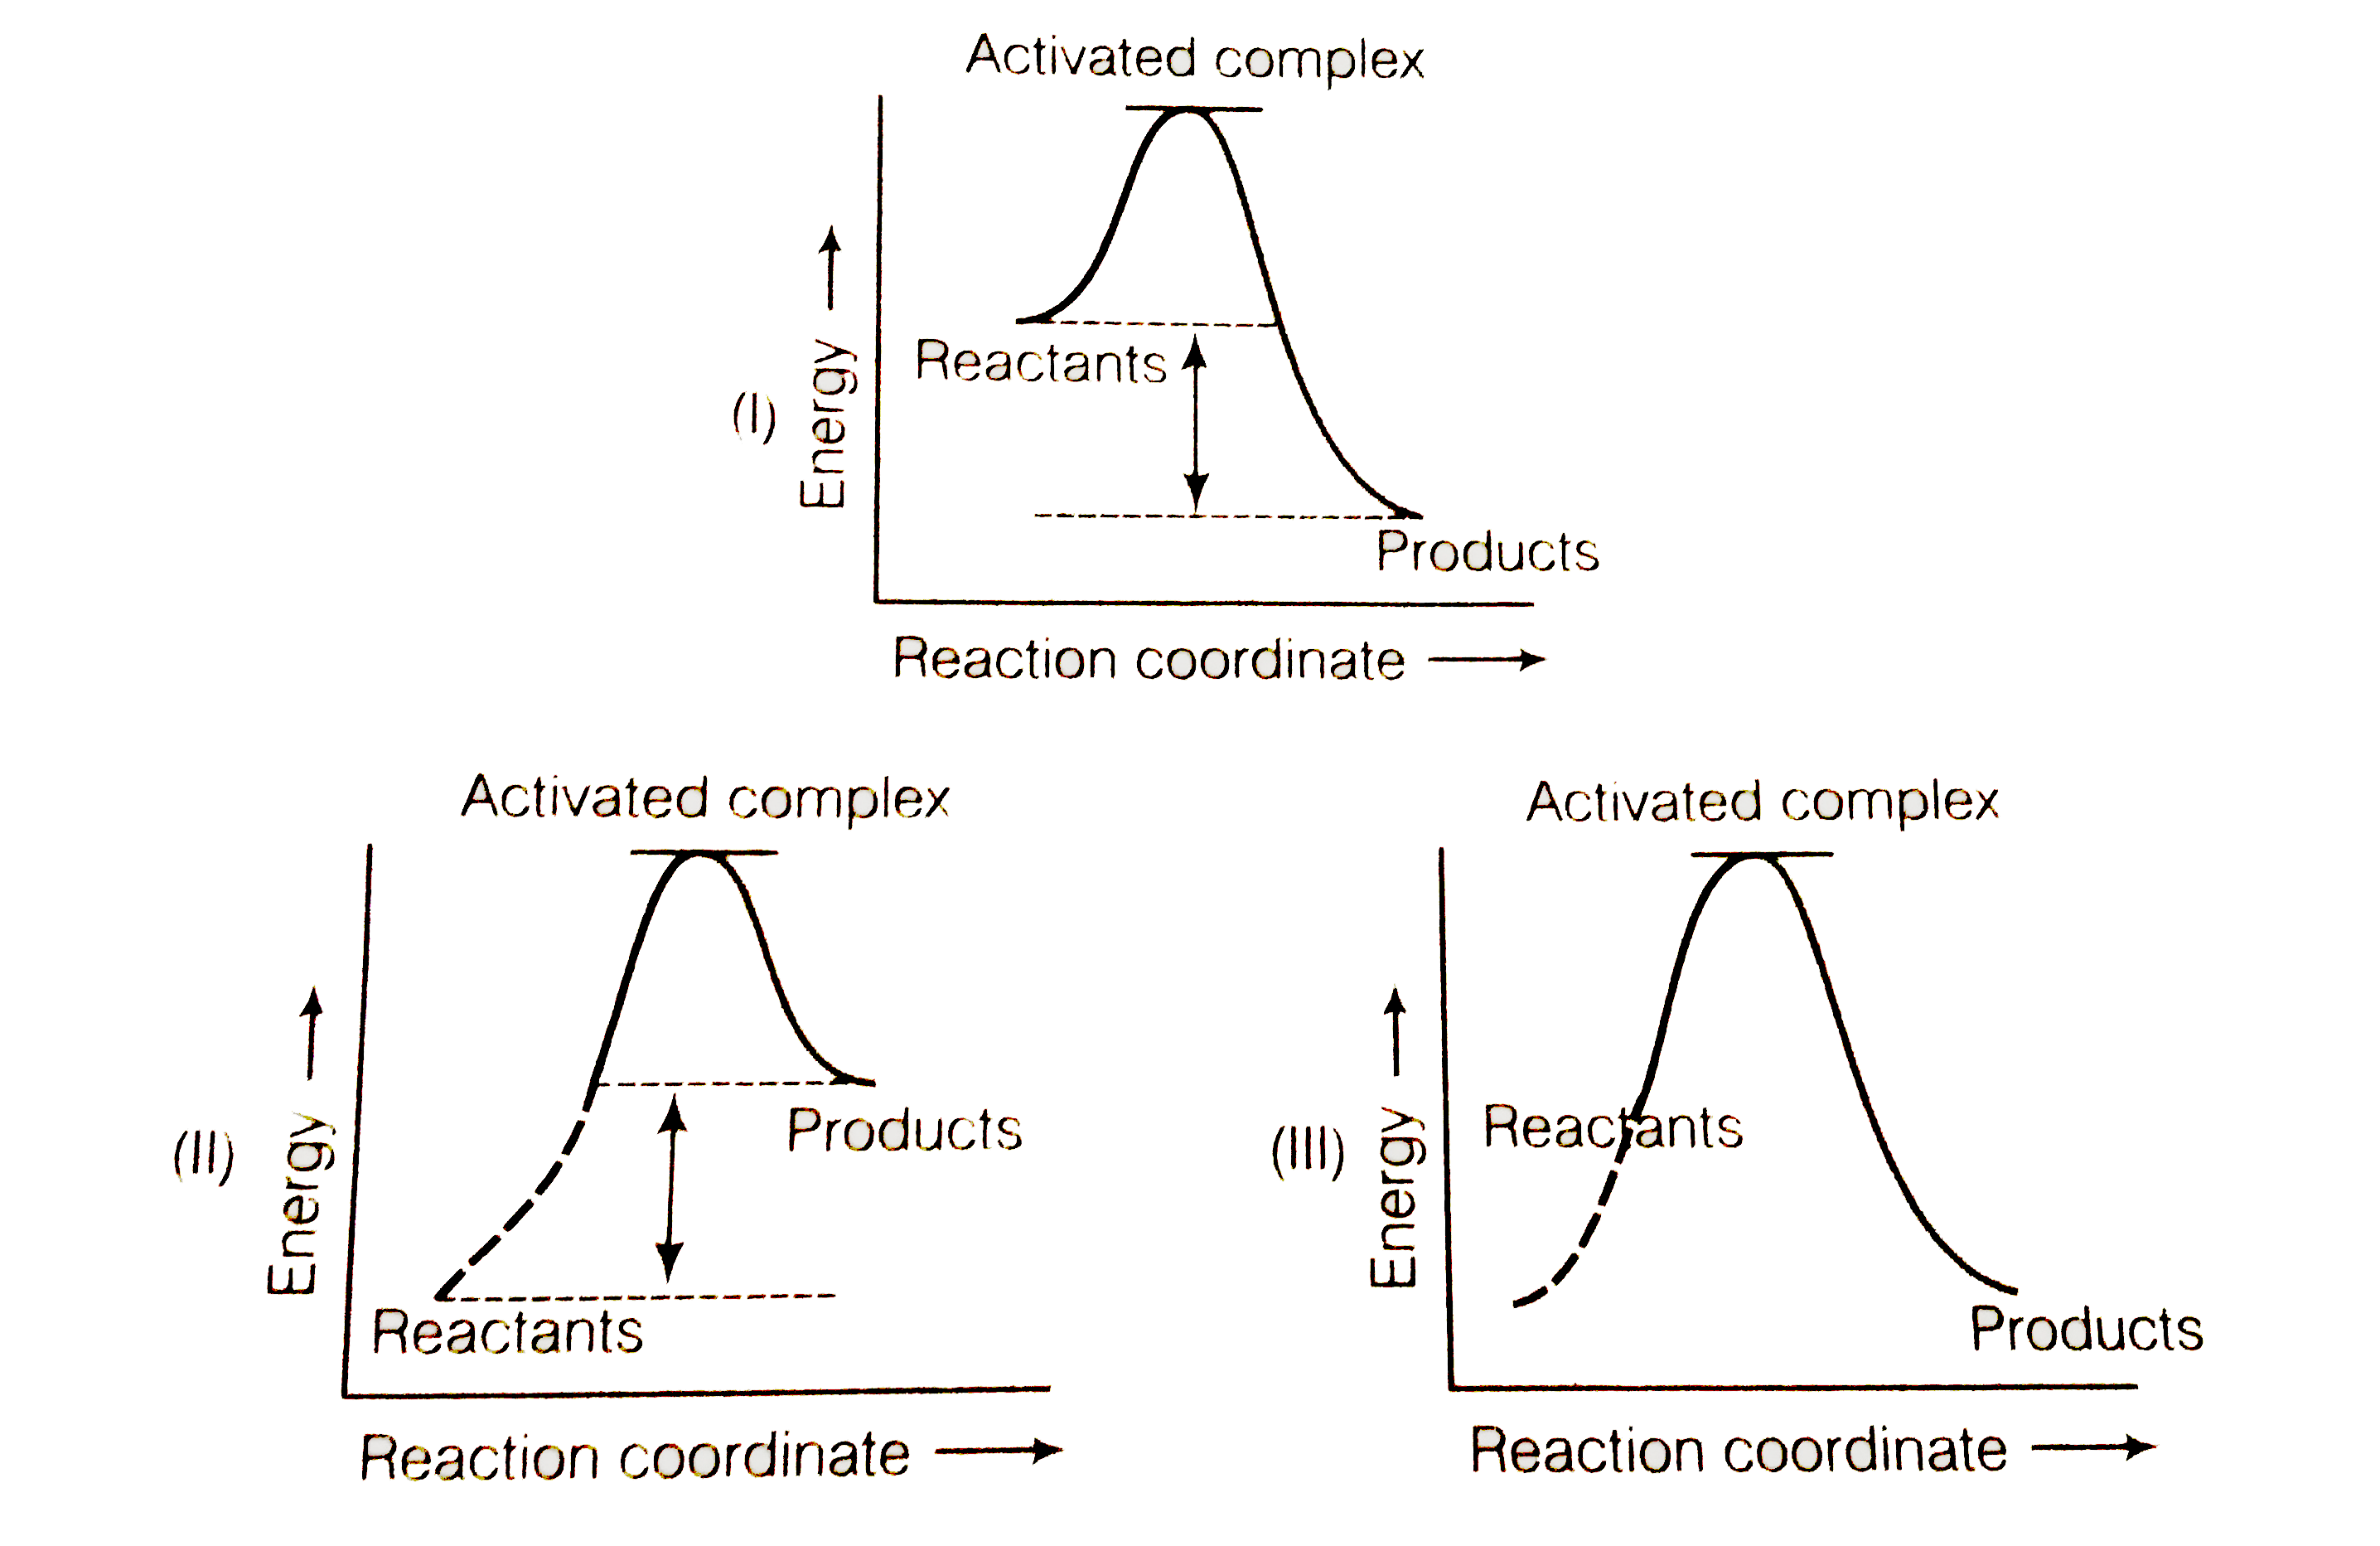
Which of the following graph represents exothermic reaction ?
 View Solution

