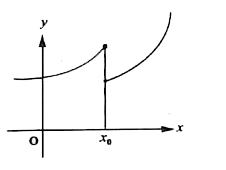
State how continuity is destroyed at x=x0 for each of the following graphs.
 Solution in Tamil
The correct Answer is:x0
Step by step video, text & image solution for State how continuity is destroyed at x=x_0 for each of the following graphs. by Maths experts to help you in doubts & scoring excellent marks in Class 11 exams.
Updated on:21/07/2023Topper's Solved these Questions
- DIFFERENTIAL CALCULUS - LIMITS AND CONTINUITYBOOK - FULL MARKSCHAPTER - DIFFERENTIAL CALCULUS - LIMITS AND CONTINUITYEXERCISE - EXERCISE 9.6
25 Videos
- DIFFERENTIAL CALCULUS - LIMITS AND CONTINUITYBOOK - FULL MARKSCHAPTER - DIFFERENTIAL CALCULUS - LIMITS AND CONTINUITYEXERCISE - EXERCISE 9.4
28 Videos
- DIFFERENTIAL CALCULUS - DIFFERENTIABILITY AND METHODS OF DIFFERENTIATIONBOOK - FULL MARKSCHAPTER - DIFFERENTIAL CALCULUS - DIFFERENTIABILITY AND METHODS OF DIFFERENTIATIONEXERCISE - EXERCISE 5 ADDITIONAL PROBLEMS (Find the derivative of following functions.)
10 Videos
- EXAMINATION QUESTION PAPER - JUNE 2019 BOOK - FULL MARKSCHAPTER - EXAMINATION QUESTION PAPER - JUNE 2019 EXERCISE - PART -IV
7 Videos
Similar Questions
limx→∞sinxx……
View SolutionEvaluate the limits
limx→∞(1+1x)7x
View SolutionDifferentiate following as; 3sinx+4cosx−ex
View Solution(a) Let f,g : R→R be defined as f(x) =2x−|x| and g(x) =2x+|x|. Find fog.
(b) Prove that limθ→0sinθθ=1
View SolutionHow many lines of symmetry does the above figure have ?
View SolutionWhich of the following are correct chain isomers of butane ? (i)
View SolutionDetermine the point of symmetry of a regular hexagon.
View SolutionDtermine the images of the following figure about the given line :
View SolutionMatch the following Column A to Column B

View SolutionMatch the following Column A to Column B

View SolutionMatch the following Column A to Column B

View SolutionThe inequation represented by the graph given below is :
View SolutionThe inequation that best describes the graph given below is _________
View SolutionThe inequation that best describes the following graph is _________
View SolutionWhich inequations represent the shaded region in the given figure
View SolutionIn Fig, find the value of x.
ltimg src="https://d10lpgp6xz60nq.cloudfront.net/physics_images/PS_MATH_IX_C12_S01_032_Q01.png" width="80%"gt
View Solution
