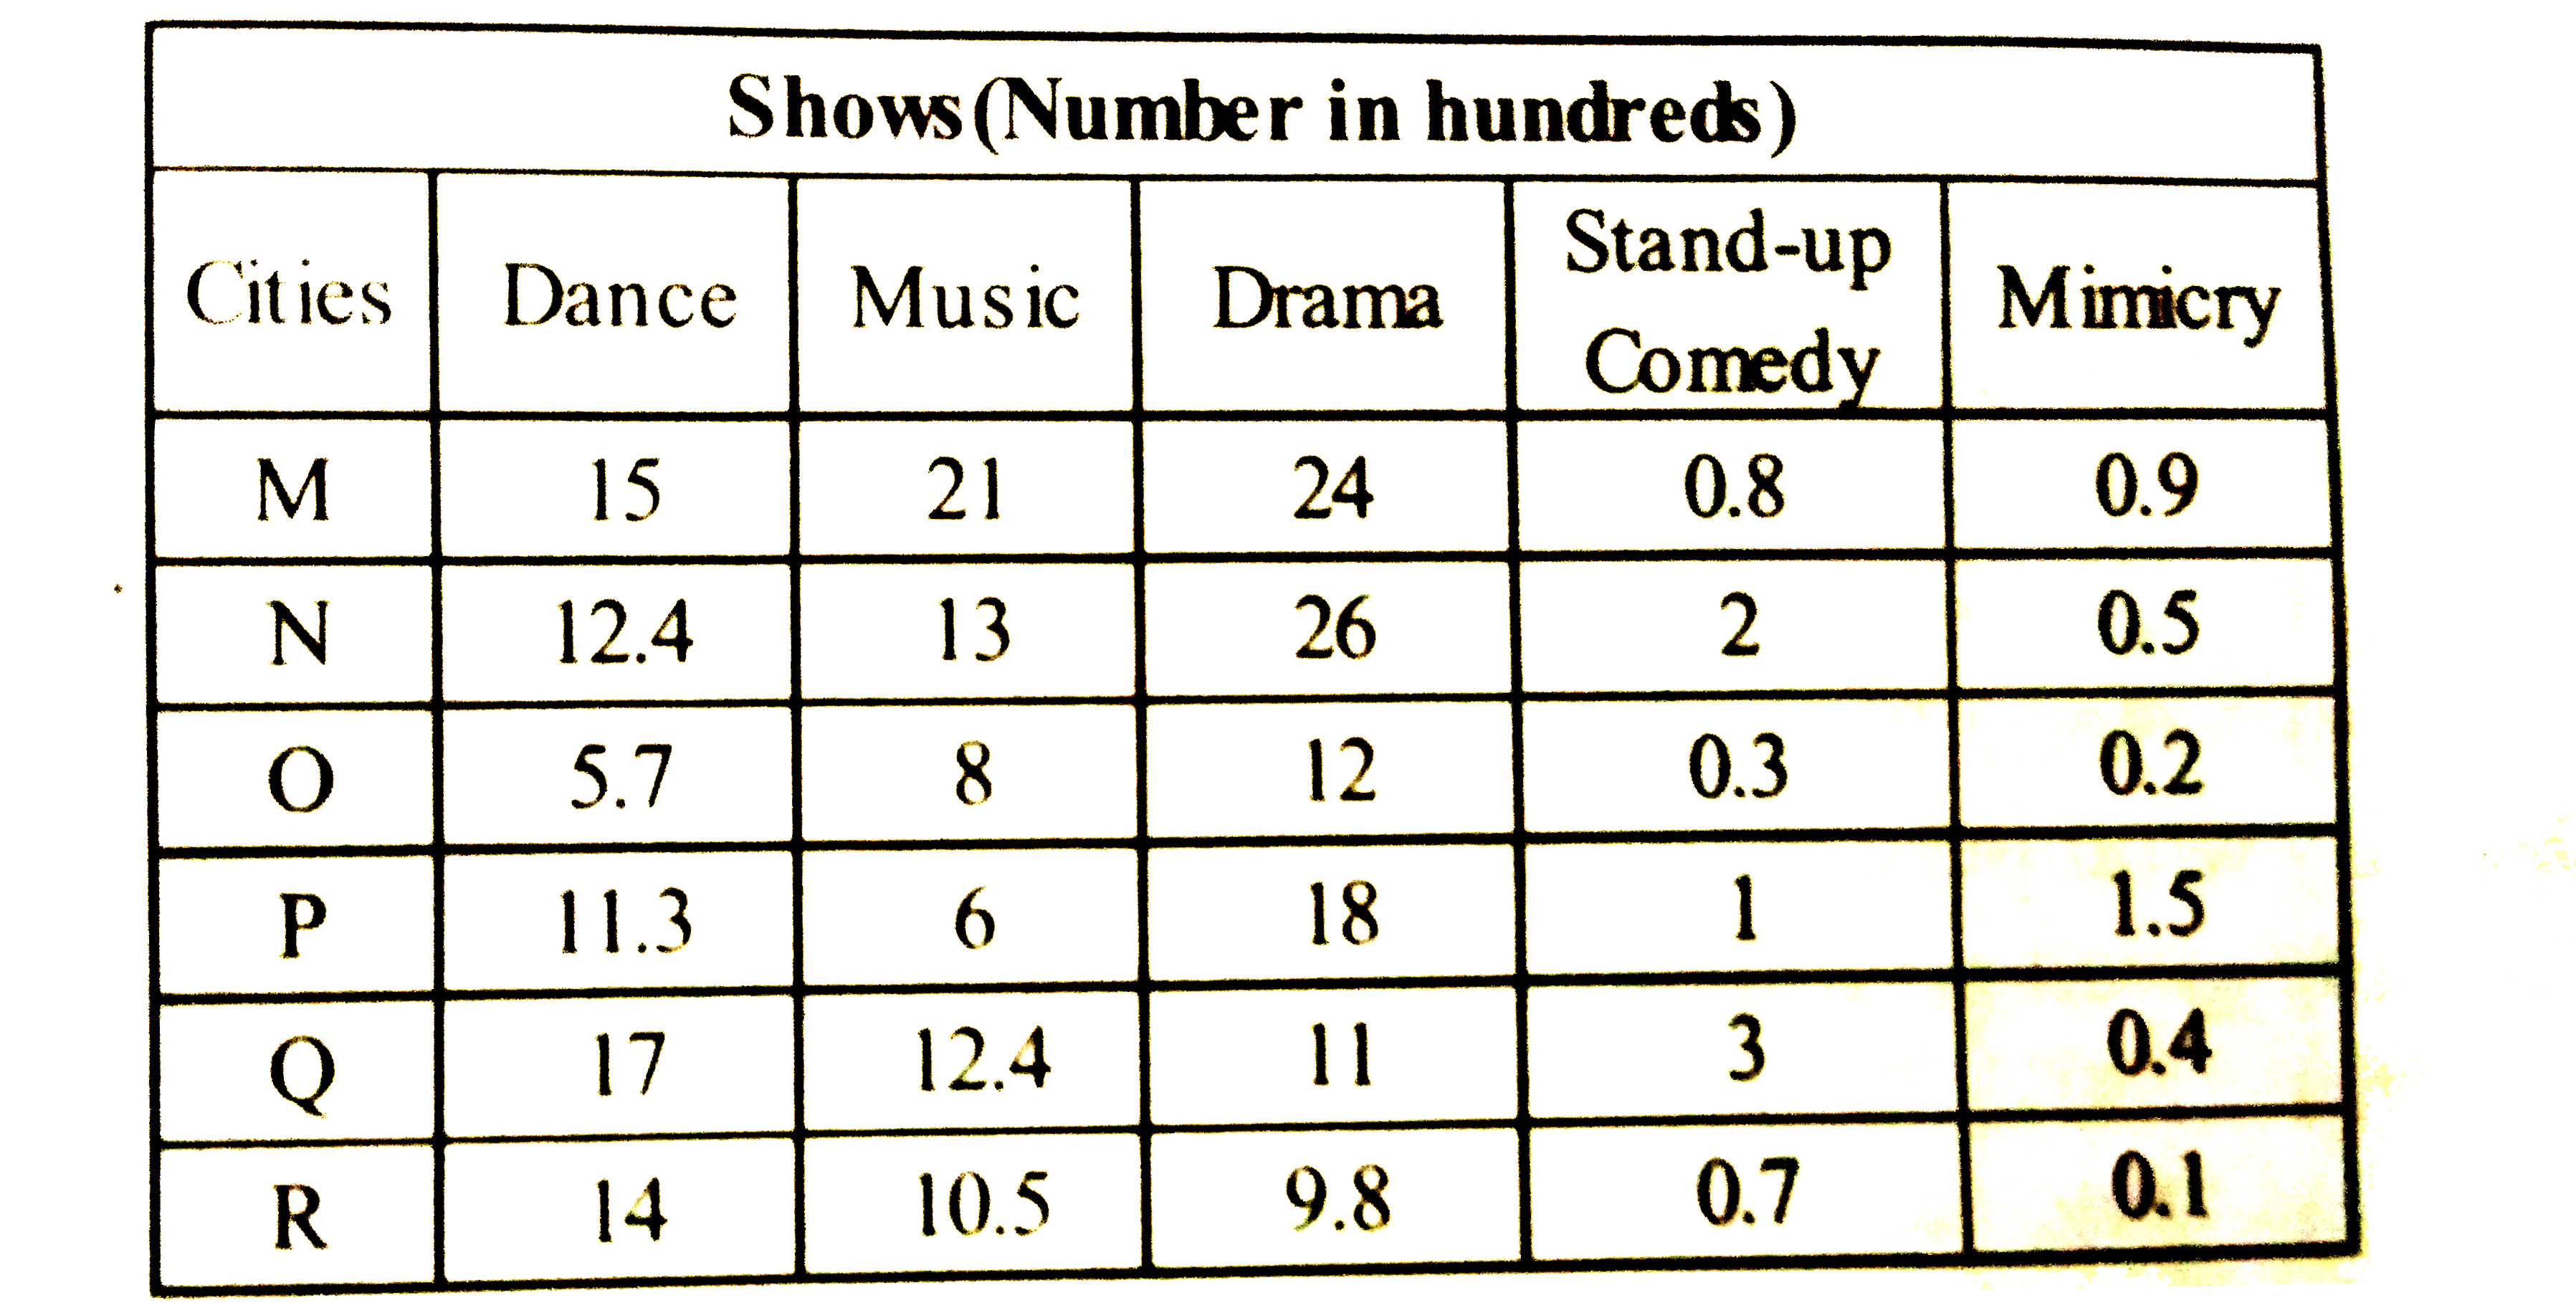
What is the average number of entertainment shows held in city P?
The correct Answer is:=756
To find the average number of entertainment shows held in city P, we will follow these steps:
Step 1: Identify the Total Number of Shows
From the video transcript, we have the following number of entertainment shows for different categories:
- Dance: 11.3
- Music: 6
- Drama: 18
- Stand-Up Comedy: 1
- Mimicry: 1.5
Step 2: Sum the Total Number of Shows
Now, we will add these numbers together to find the total number of shows:
\(
\text{Total Shows} = 11.3 + 6 + 18 + 1 + 1.5
\)
Calculating this gives:
\(
\text{Total Shows} = 11.3 + 6 + 18 + 1 + 1.5 = 37.8
\)
Step 3: Count the Number of Categories
Next, we need to count how many categories of shows there are. In this case, we have:
- Dance
- Music
- Drama
- Stand-Up Comedy
- Mimicry
This gives us a total of 5 categories.
Step 4: Calculate the Average
To find the average number of shows, we will divide the total number of shows by the number of categories:
\(
\text{Average} = \frac{\text{Total Shows}}{\text{Number of Categories}} = \frac{37.8}{5}
\)
Calculating this gives:
\(
\text{Average} = 7.56
\)
Step 5: Convert to Required Format
The question asks for the average number of entertainment shows held in city P. The average calculated is 7.56, but if we need to express this in a different format (like multiplied by 100), we can do:
\(
\text{Average in required format} = 7.56 \times 100 = 756
\)
Final Answer
Thus, the average number of entertainment shows held in city P is 756.
---
From the video transcript, we have the following number of entertainment shows for different categories:
- Dance: 11.3
- Music: 6
- Drama: 18
- Stand-Up Comedy: 1
- Mimicry: 1.5
Now, we will add these numbers together to find the total number of shows:
\text{Total Shows} = 11.3 + 6 + 18 + 1 + 1.5
\)
\text{Total Shows} = 11.3 + 6 + 18 + 1 + 1.5 = 37.8
\)
Next, we need to count how many categories of shows there are. In this case, we have:
- Dance
- Music
- Drama
- Stand-Up Comedy
- Mimicry
To find the average number of shows, we will divide the total number of shows by the number of categories:
\text{Average} = \frac{\text{Total Shows}}{\text{Number of Categories}} = \frac{37.8}{5}
\)
\text{Average} = 7.56
\)
The question asks for the average number of entertainment shows held in city P. The average calculated is 7.56, but if we need to express this in a different format (like multiplied by 100), we can do:
\text{Average in required format} = 7.56 \times 100 = 756
\)
Thus, the average number of entertainment shows held in city P is 756.
Topper's Solved these Questions
- DATA TABLE BOOK - ARIHANT SSCCHAPTER - DATA TABLE EXERCISE - EXERCISE BASE LEVEL QUESTIONS
54 Videos
- DATA TABLE BOOK - ARIHANT SSCCHAPTER - DATA TABLE EXERCISE - HIGHER SKILL LEVEL QUESTIONS
25 Videos
- DATA SUFFICIENCYBOOK - ARIHANT SSCCHAPTER - DATA SUFFICIENCYEXERCISE - FAST TRACK PRACTICE
30 Videos
- DISCOUNTBOOK - ARIHANT SSCCHAPTER - DISCOUNTEXERCISE - FAST TRACK PRACTICE
47 Videos
Similar Questions
Knowledge Check
What is the average number of tickets of movie C sold in all the six cities?
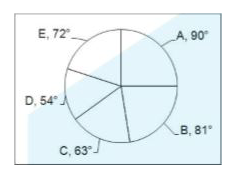
A15500B2550C24000D25500The pie chart given below shows the number of students in 5 sections .The number of students is 7200.
What is the average number of students of the 2 smallest sections?
 Aa)18060Bb)1170Cc)1600Dd)1730
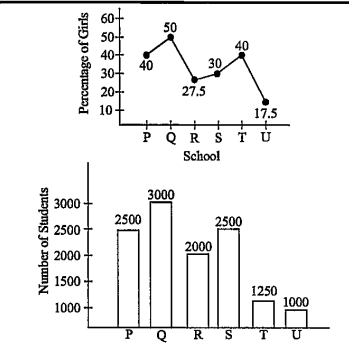
The average number of student in both School P and Q.A1425B1575C1450D2750
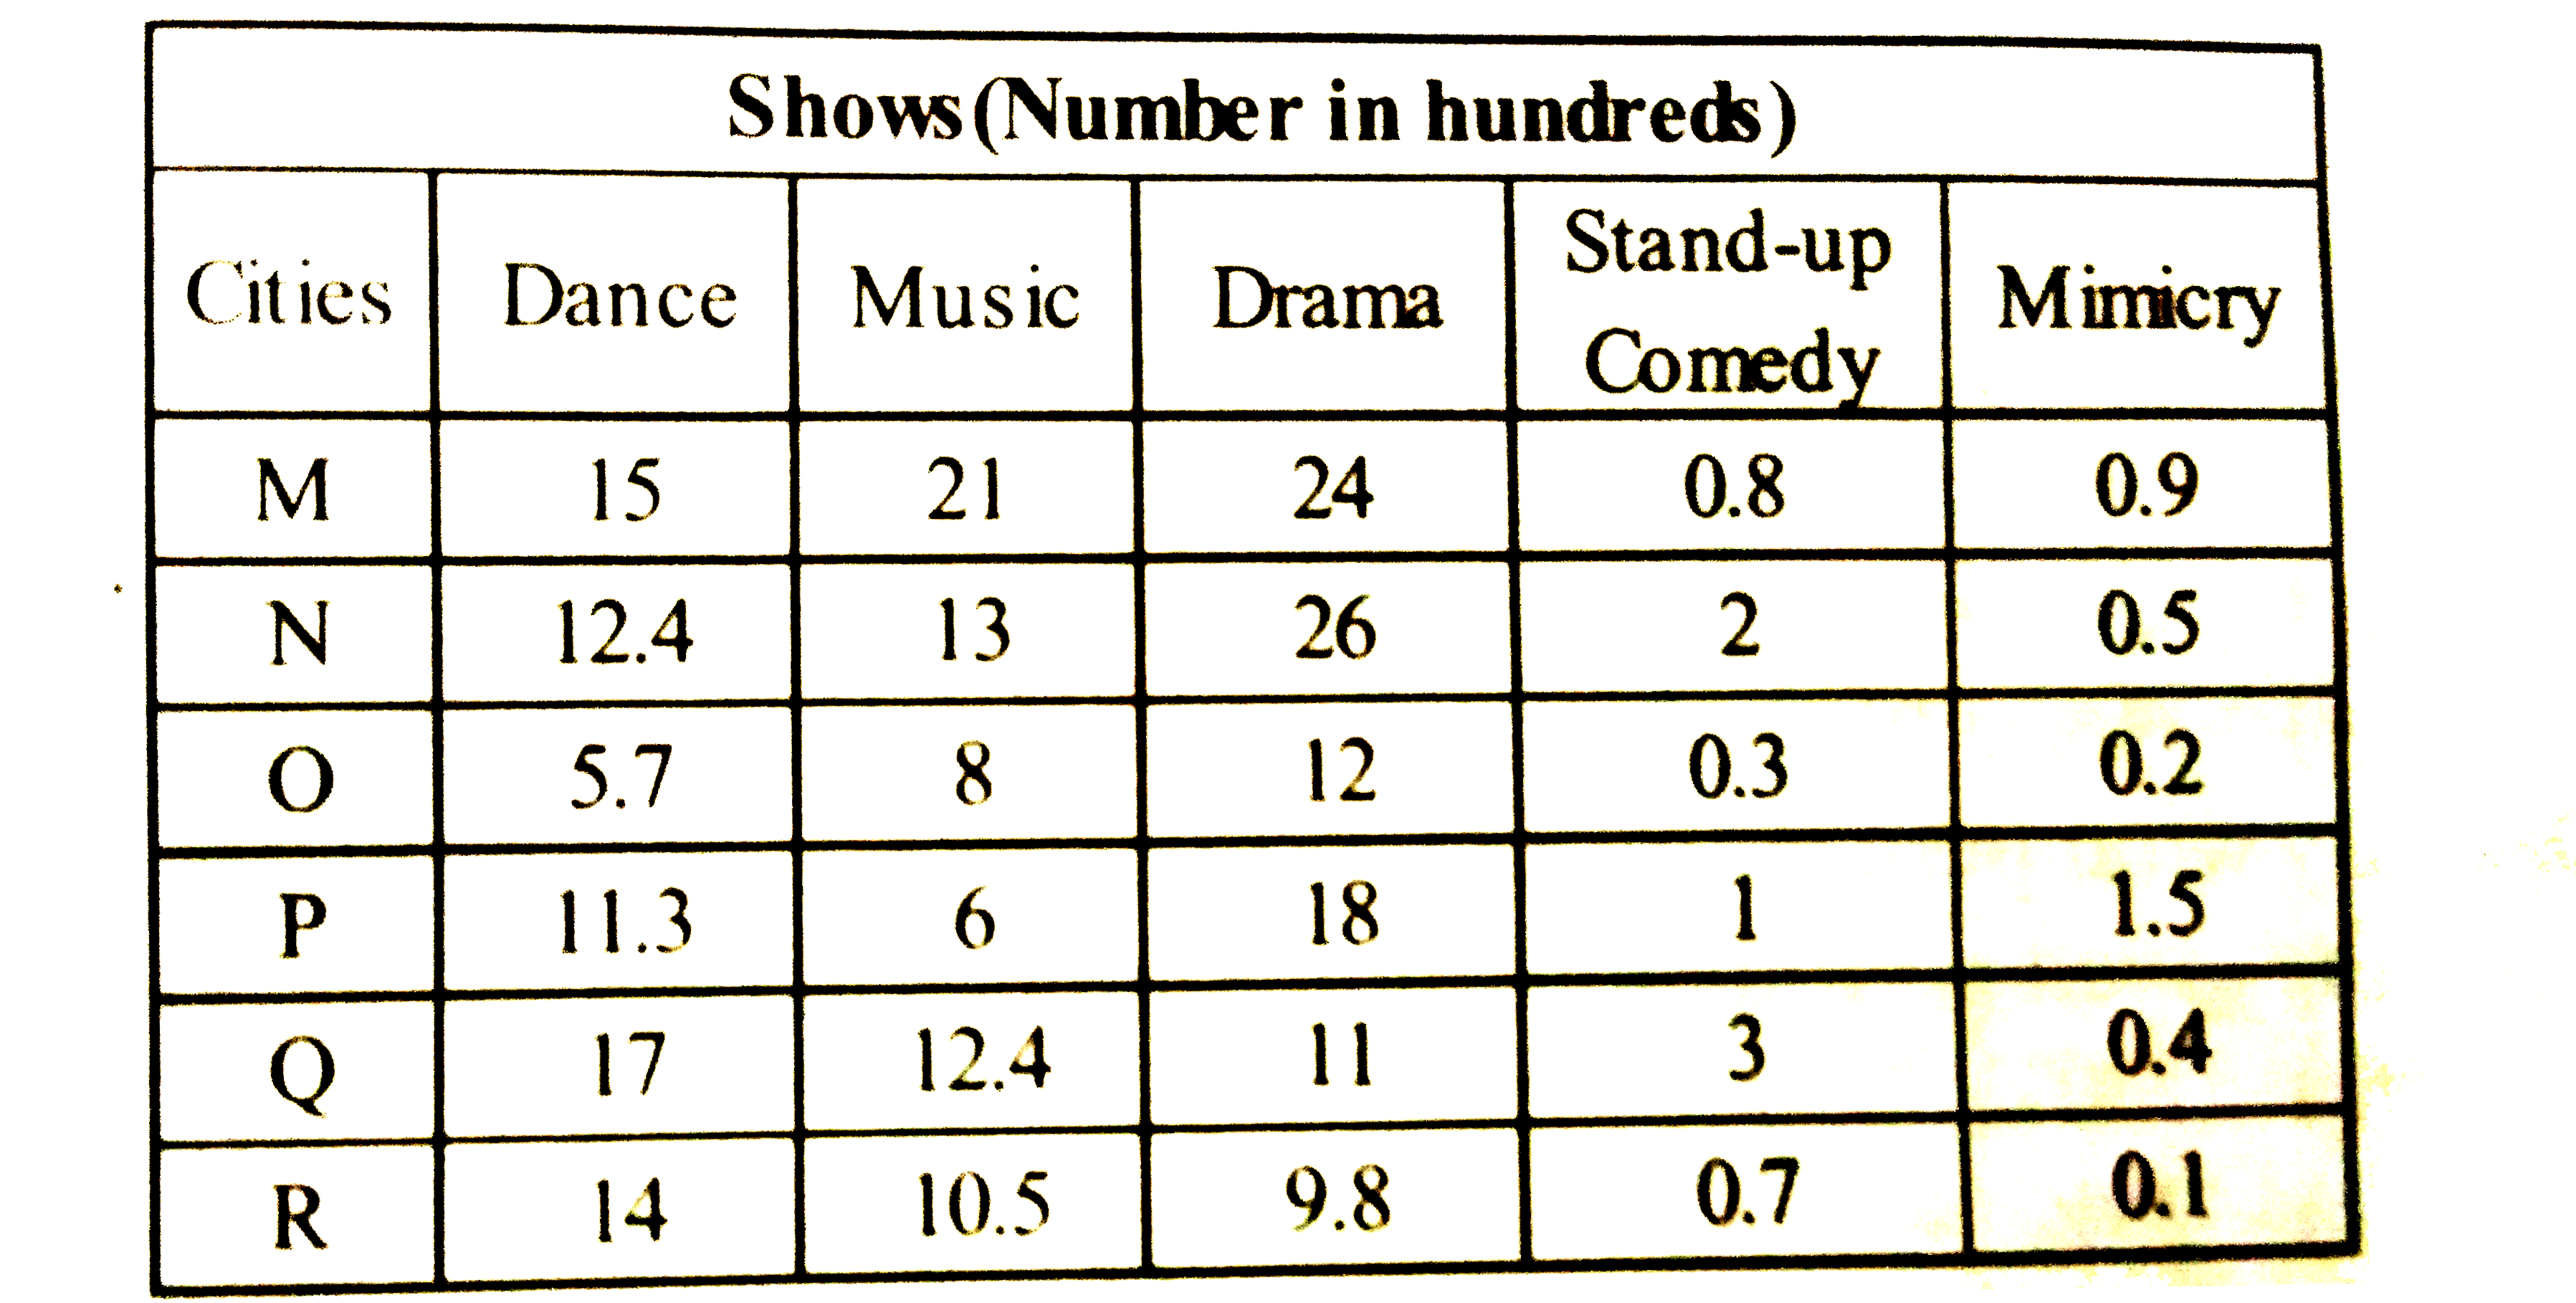
What is the total number of stand-up comedy shows held in all the cites together ?
View Solution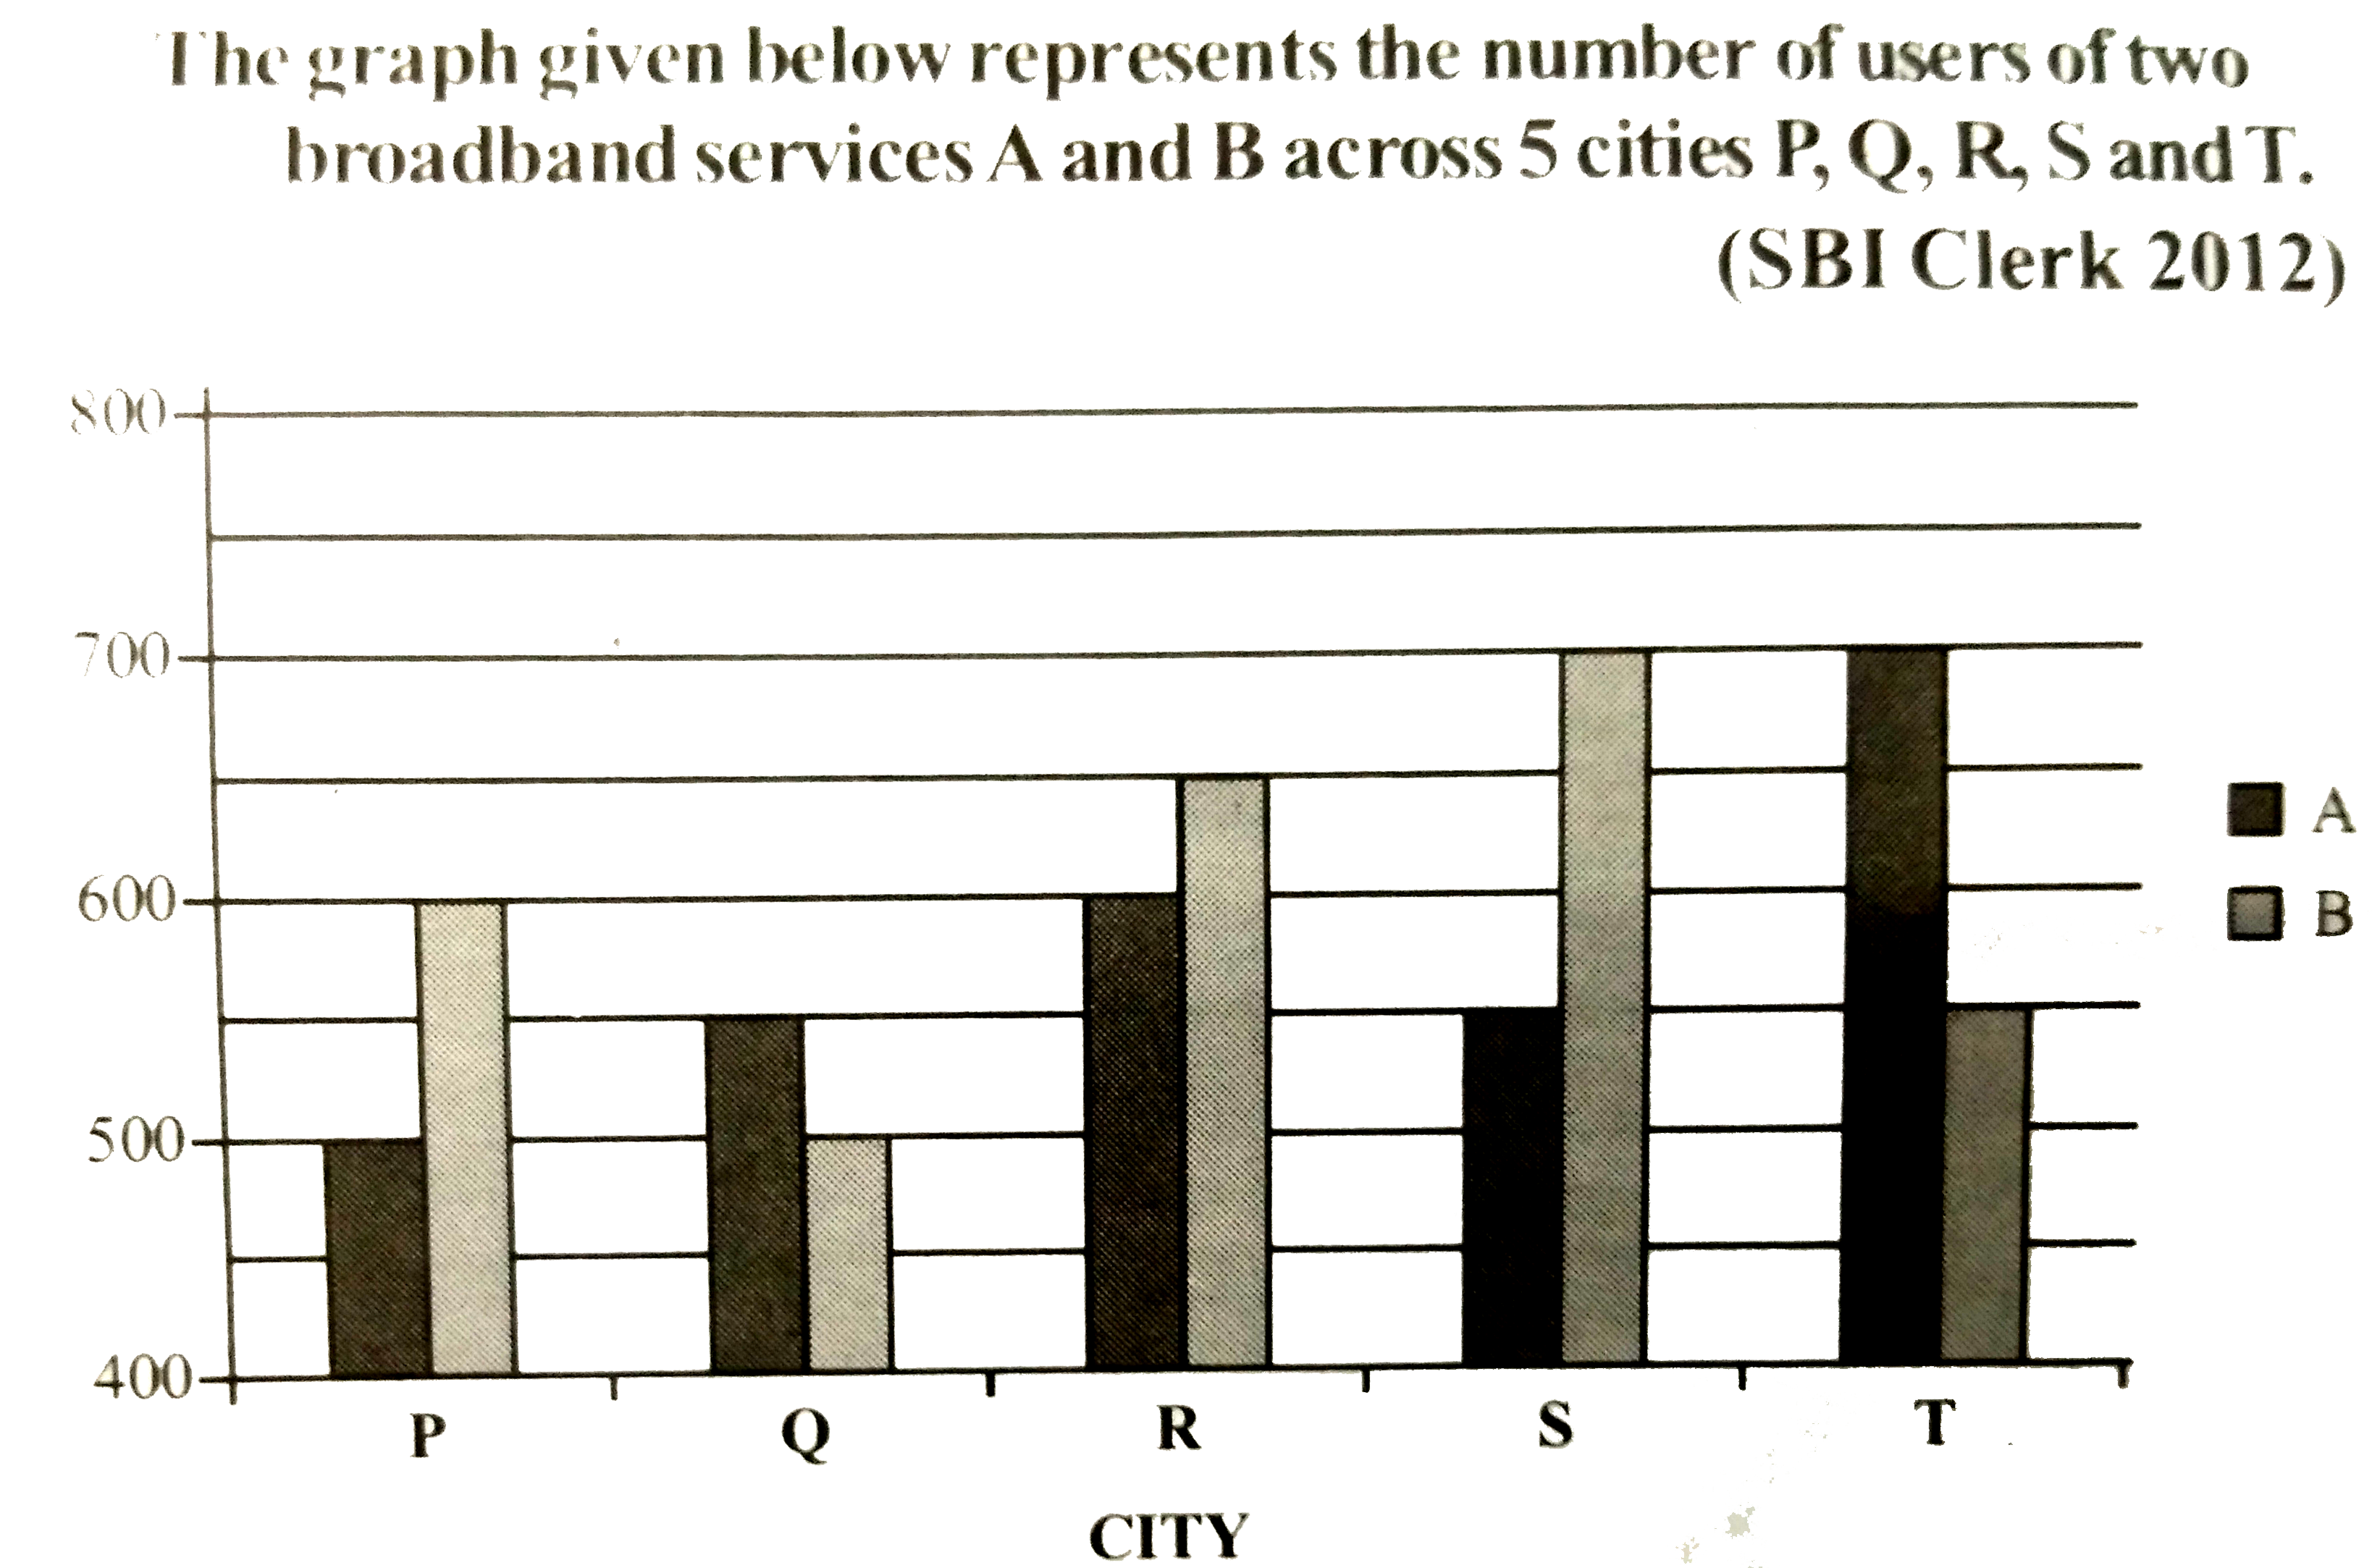
What is the average number of users of brand A across al five cities together ?
View SolutionThe bar chart given below shows the number of mobile phone thefts in 2 cities Delhi and Jaipur from month February 2015 to June 2015.
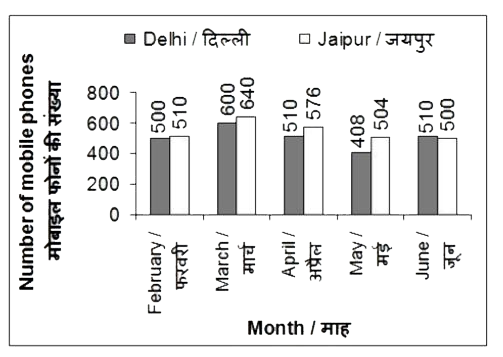
What was the average number of mobile phones thefts in Jaipur from February 2015 to June 2015?
View SolutionThis table shows the number of students studying in various streams in different colleges. What is the average of the number of students in the arts stream in all the colleges taken together?

View Solution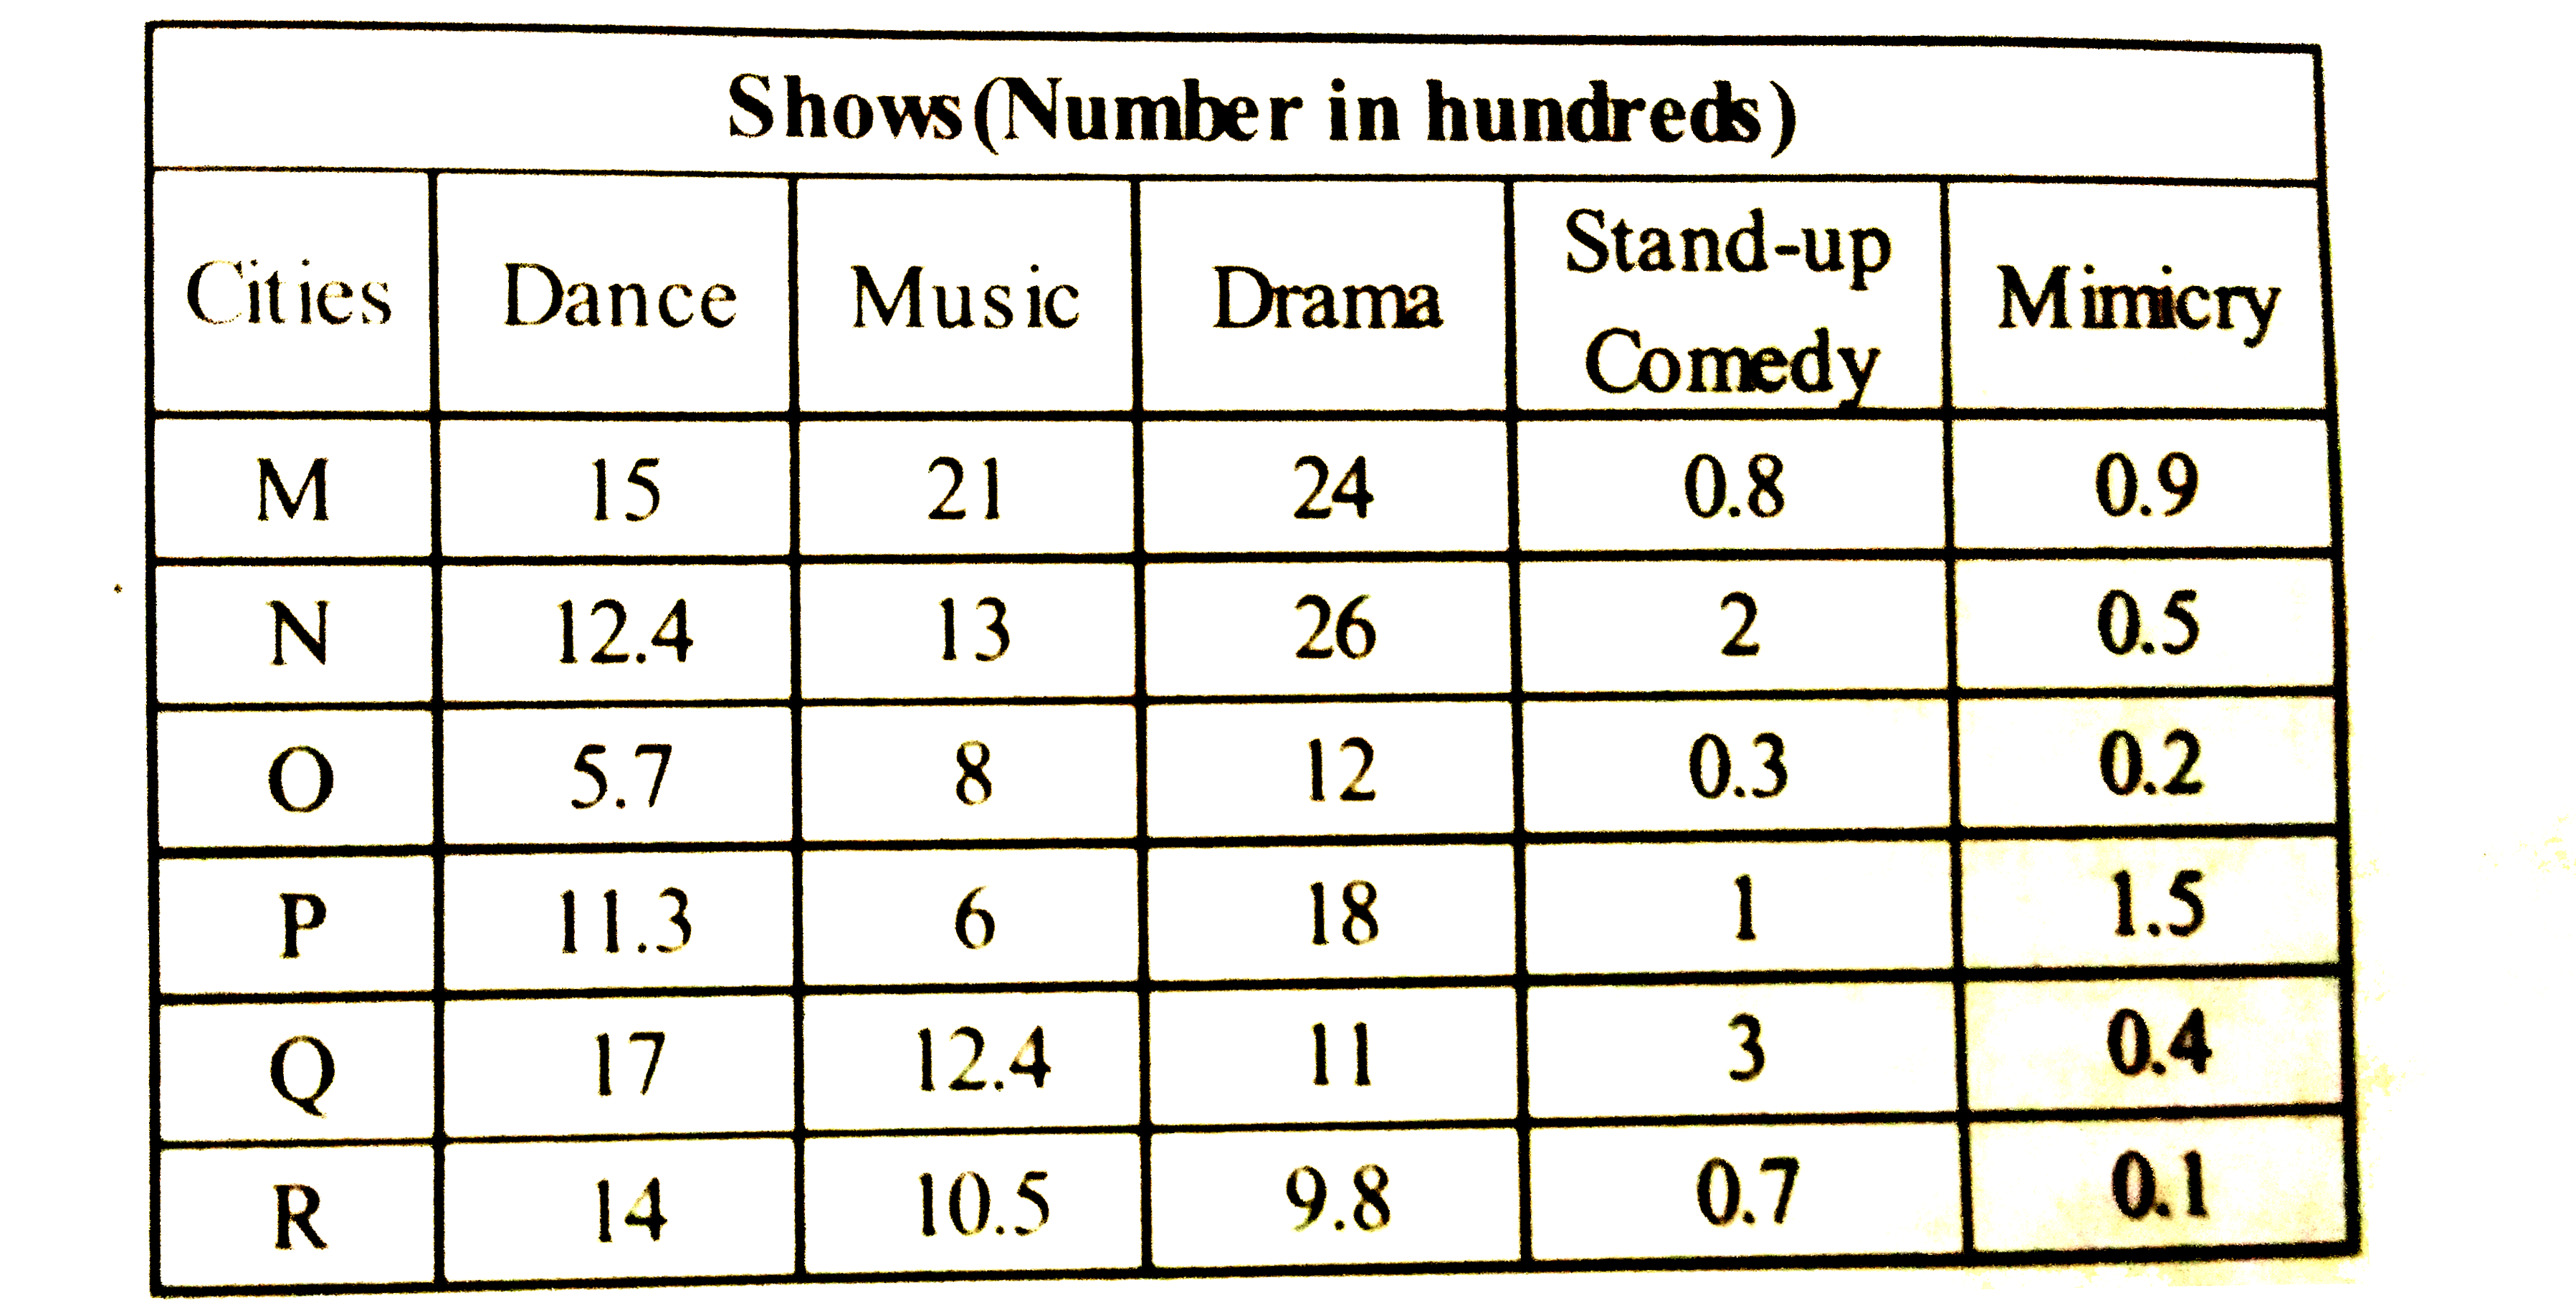
The mimicy held in city M are what percent of the drama shows held in city Q ?
View Solution

