The following pie chart shows the marks obtained by a student in an examination, who scored 720 marks in all. Study the diagram and answer the questions given below.
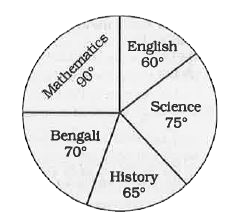
The following pie chart shows the marks obtained by a student in an examination, who scored 720 marks in all. Study the diagram and answer the questions given below.
The marks scored in English, differ from the marks scored in Science by
75
15
30
60
The correct Answer is:C
Step by step video, text & image solution for The following pie chart shows the marks obtained by a student in an examination, who scored 720 marks in all. Study the diagram and answer the questions given below. The following pie chart shows the marks obtained by a student in an examination, who scored 720 marks in all. Study the diagram and answer the questions given below. The marks scored in English, differ from the marks scored in Science by by Maths experts to help you in doubts & scoring excellent marks in Class 14 exams.
Updated on:21/07/2023Similar Questions
Knowledge Check
The following pie chart shows the marks obtained by a student in an examination, who scored 720 marks in all. Study the diagram and answer the questions given below.
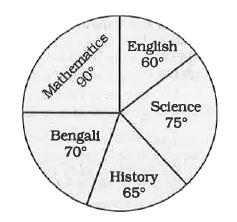
The marks scored in Science areA200B300C75D150The following pie chart shows the marks obtained by a student in an examination, who scored 720 marks in all. Study the diagram and answer the questions given below.
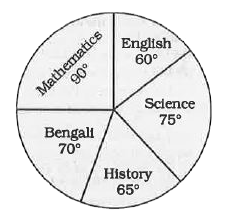
The following pie chart shows the marks obtained by a student in an examination, who scored 720 marks in all. Study the diagram and answer the questions given below.
The marks scored in Mathematics and English together differ from the total marks scored in Bengali, History and Science byA85B61C120D72The following pie chart shows the marks obtained by a student in an examination, who scored 720 marks in all. Study the diagram and answer the questions given below.
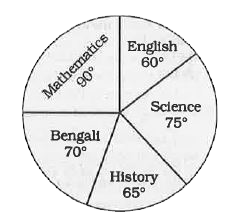
The following pie chart shows the marks obtained by a student in an examination, who scored 720 marks in all. Study the diagram and answer the questions given below.
The subject in which the student scored 180 marks isAMathematicsBBengaliCEnglishDScience
The marks obtained by a student in an examination are given below:

Represent the data using pie diagram.
View SolutionThe marks obtained by a student in an examination are given below :

Represent the data using a pie diagram.
View SolutionThe given bar graph shows the marks obtained by students in a Science test.
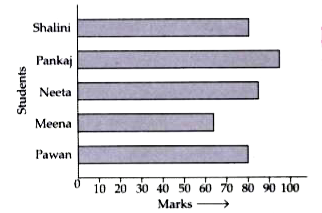
Who scored the highest marks in the test ? Whats in the score ?
View SolutionThe following pie chart shows the marks obtained by a student in an examination, who scored 720 marks in all. Study the diagram and answer the questions given below.
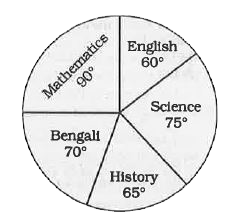
The subject in which the student scored 1623% of his total score is
View SolutionThe given pie chart shows the marks obtained in an examination by a student (in degree). Observe the pie chart and answer the question that follows.
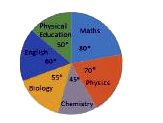
If the total marks are 720, then the marks obtained in Mathematics are:
View Solution


