Students from different countries (A,B,C,D,E,F) participated in a certain seminar.The pie- chart shows how many students came from each of the six participating countries.Study the diagram and answer the following questions.
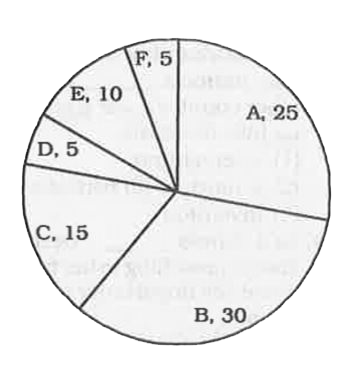
The biggest contingent of students was from which country?
A
C
B
D
The correct Answer is:C
Step by step video, text & image solution for Students from different countries (A,B,C,D,E,F) participated in a certain seminar.The pie- chart shows how many students came from each of the six participating countries.Study the diagram and answer the following questions. The biggest contingent of students was from which country? by Maths experts to help you in doubts & scoring excellent marks in Class 14 exams.
Updated on:21/07/2023Similar Questions
Students from different countries (A,B,C,D,E,F) participated in a certain seminar.The pie- chart shows how many students came from each of the six participating countries.Study the diagram and answer the following questions.
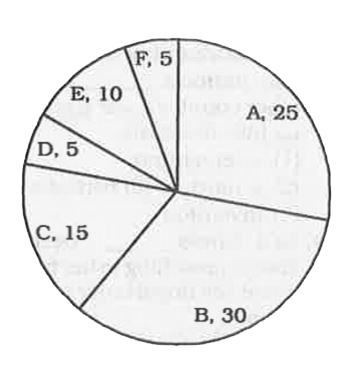
If the cost of total spending on transport for the seminar was Rs. 9 lakhs and the cost of hosting the students was Rs. 15000 per student then what was the ratio of hosting cost of all the students to that of spending on transport?
View SolutionStudents from different countries (A, B, C, D, E, F) participated in a certain seminar. The pie-chart shows how many students came from each of the six participating countries. Study the diagram and answer the following questions.
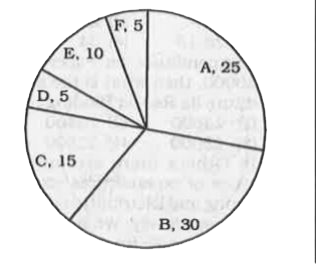
What is the angular measure (in degrees) of the sector representing country A?
View Solution
Knowledge Check
Students from different countries (A,B,C,D,E,F) participated in a certain seminar.The pie- chart shows how many students came from each of the six participating countries.Study the diagram and answer the following questions.
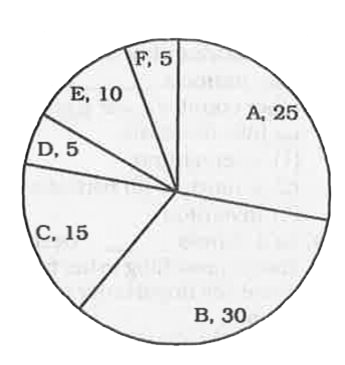
By what count (in %) students from country B at the seminar were more than the students from country E?A40B200C20D18Students from different countries (A, B, C, D, E, F) participated in a certain seminar. The pie-chart shows how many students came from each of the six participating countries. Study the diagram and answer the following questions.
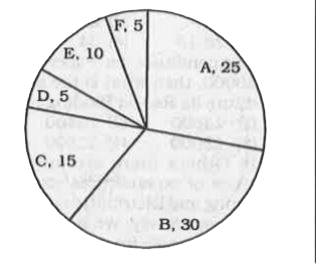
By what count (in %) students frm country B at the seminar were more than the students from country E?A40B200C20D18Students from different countries (A,B,C,D,E,F) participated in a certain seminar.The pie- chart shows how many students came from each of the six participating countries.Study the diagram and answer the following questions.
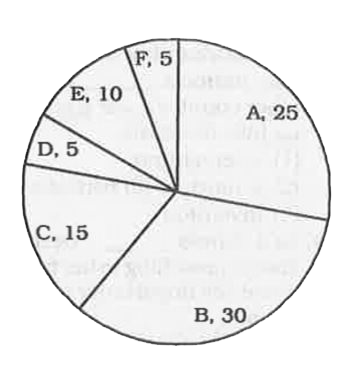
What is the angular measure (in degrees) of the sector representing country A?A100B25C50D120
The bar graph shows the debt of different countries. Study the diagram and answer the following questions.
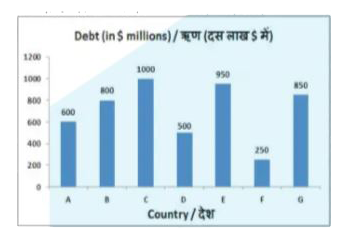
What is the ratio of debt of country A to that of country F?
View SolutionThe pie chart shows the number of students enrolled in the various engineering courses that a certain college offers. Study the diagram and answer the following questions.
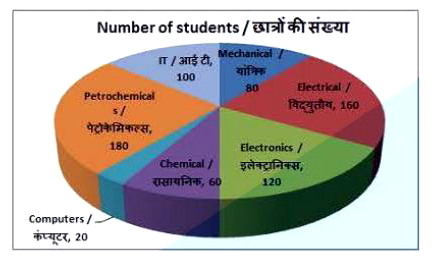
The most number of students are enrolled in which course?
View SolutionThe bar graph shows the population of different countries. Study the diagram and answer the following questions.
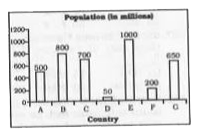
What is the ratio of population of country A to that of country G?
View SolutionThe bar graph shows the population of different countries. Study the diagram and answer the following questions.
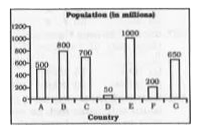
Which country has the second highest population?
View SolutionThe bar graph shows the debt of different countries. Study the diagram and answer the following questions.
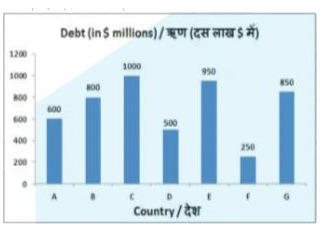
Which country has the second lowest debt?
View Solution
