A health drink company prepares the drinks of three different flavours P, Q, R. The production of three flavours over a period of six years has been expressed on bar graph provided below. Study the graph and answer the questions.
(Production of 3 different flavours of health drinks of a company in 6 years in Lakh bottles)
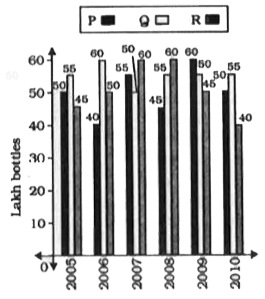
The average annual production of which flavour was maximum in the given period ?
P and Q both
Q only
P and R both
P only
The correct Answer is:C
Step by step video, text & image solution for A health drink company prepares the drinks of three different flavours P, Q, R. The production of three flavours over a period of six years has been expressed on bar graph provided below. Study the graph and answer the questions. (Production of 3 different flavours of health drinks of a company in 6 years in Lakh bottles) The average annual production of which flavour was maximum in the given period ? by Maths experts to help you in doubts & scoring excellent marks in Class 14 exams.
Updated on:21/07/2023Similar Questions
Read the following graph carfully and answer the questions given below. Production of bulbs by different companies in three years (In lakhs)
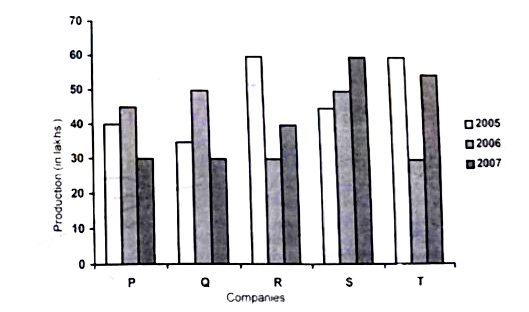
The average production of which company was maximum?
View SolutionA health drink company prepares the drinks of three different flavours P, Q, R. The production of three flavours over a period of six years has been expressed on bar graph provided below. Study the graph and answer the questions.
(Production of 3 different flavours of health drinks of a company in 6 years in Lakh bottles)
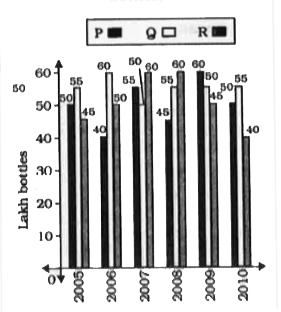
In which of the following years the percentage of rise or fall in production from the previous year is maximum for the flavour of Q ?
View Solution
Knowledge Check
A health drink company prepares the drinks of three different flavours P, Q, R. The production of three flavours over a period of six years has been expressed on bar graph provided below. Study the graph and answer the questions.
(Production of 3 different flavours of health drinks of a company in 6 years in Lakh bottles)
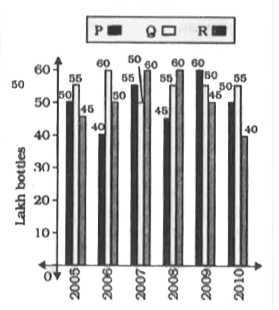
The percentage of the total production of flavour R in 2007 and 2008 with respect to the production of flavour P in 2005 and 2006 is :A102.25%B115.35%C133.33%D97.67%A health drink company prepares the drinks of three different flavours P, Q, R. The production of three flavours over a period of six years has been expressed on bar graph provided below. Study the graph and answer the questions.
(Production of 3 different flavours of health drinks of a company in 6 years in Lakh bottles)
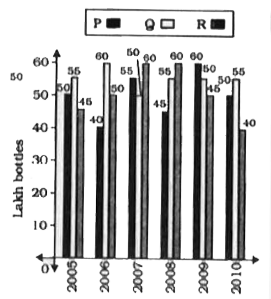
What is the difference between the average production of flavour Q in 2008, 2009 and 2010 from that of flavour Pin 2005, 2006 and 2007 in lakh bottles is :A50,000 bottlesB80,000 bottlesC2,40,000 bottlesD5,00,000 bottlesA health drink company prepares the drinks of three different flavours P, Q, R. The production of three flavours over a period of six years has been expressed on bar graph provided below. Study the graph and answer the questions.
(Production of 3 different flavours of health drinks of a company in 6 years in Lakh bottles)
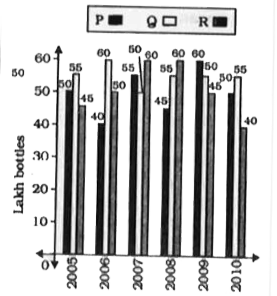
What was the approximate decline in the production of flavour R in 2010 as compared to the production of 2008 in percentage?A43.33%B33.33%C30.33%D53.33%
A health drink company prepares the drink of three different flavours P, Q, R. The production of three flavours over a period of six years has been expressed on bar graph provided below. Study the graph and answer the questions.
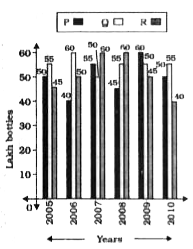
The average annual production of which flavour was maximum in the given period ?
View SolutionA health drink company prepares the drink of three different flavours P, Q, R. The production of three flavours over a period of six years has been expressed on bar graph provided below. Study the graph and answer the questions.
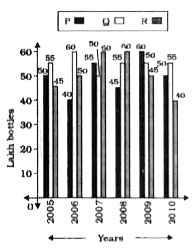
The percentage of the total production of flavour R in 2007 and 2008 with respect to the production of flavour P in 2005 and 2006 is :
View SolutionA health drink company prepares the drink of three different flavours P, Q, R. The production of three flavours over a period of six years has been expressed on bar graph provided below. Study the graph and answer the questions.
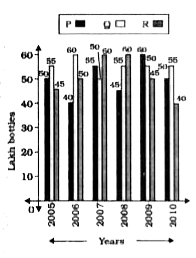
In which of the following years the percentage of rise or fall in production from the previous year is maximum for the flavour of Q?
View SolutionA health drink company prepares the drink of three different flavours P, Q, R. The production of three flavours over a period of six years has been expressed on bar graph provided below. Study the graph and answer the questions.
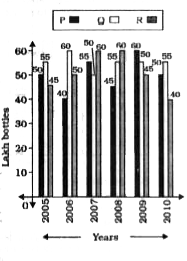
What was the approxiamte decline in the production of flavour R in 2010 as compared to the production of 2008 in percent age ?
View SolutionA health drink company prepares the drink of three different flavours P, Q, R. The production of three flavours over a period of six years has been expressed on bar graph provided below. Study the graph and answer the questions.
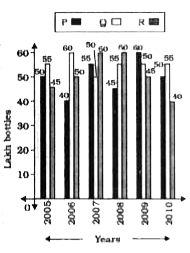
What is the different between the average production of flavour Q in 2008, 2009 and 2010 from that of flavour P in 2005, 2006 and 2007 (in lakhs bottles) ?
View Solution
