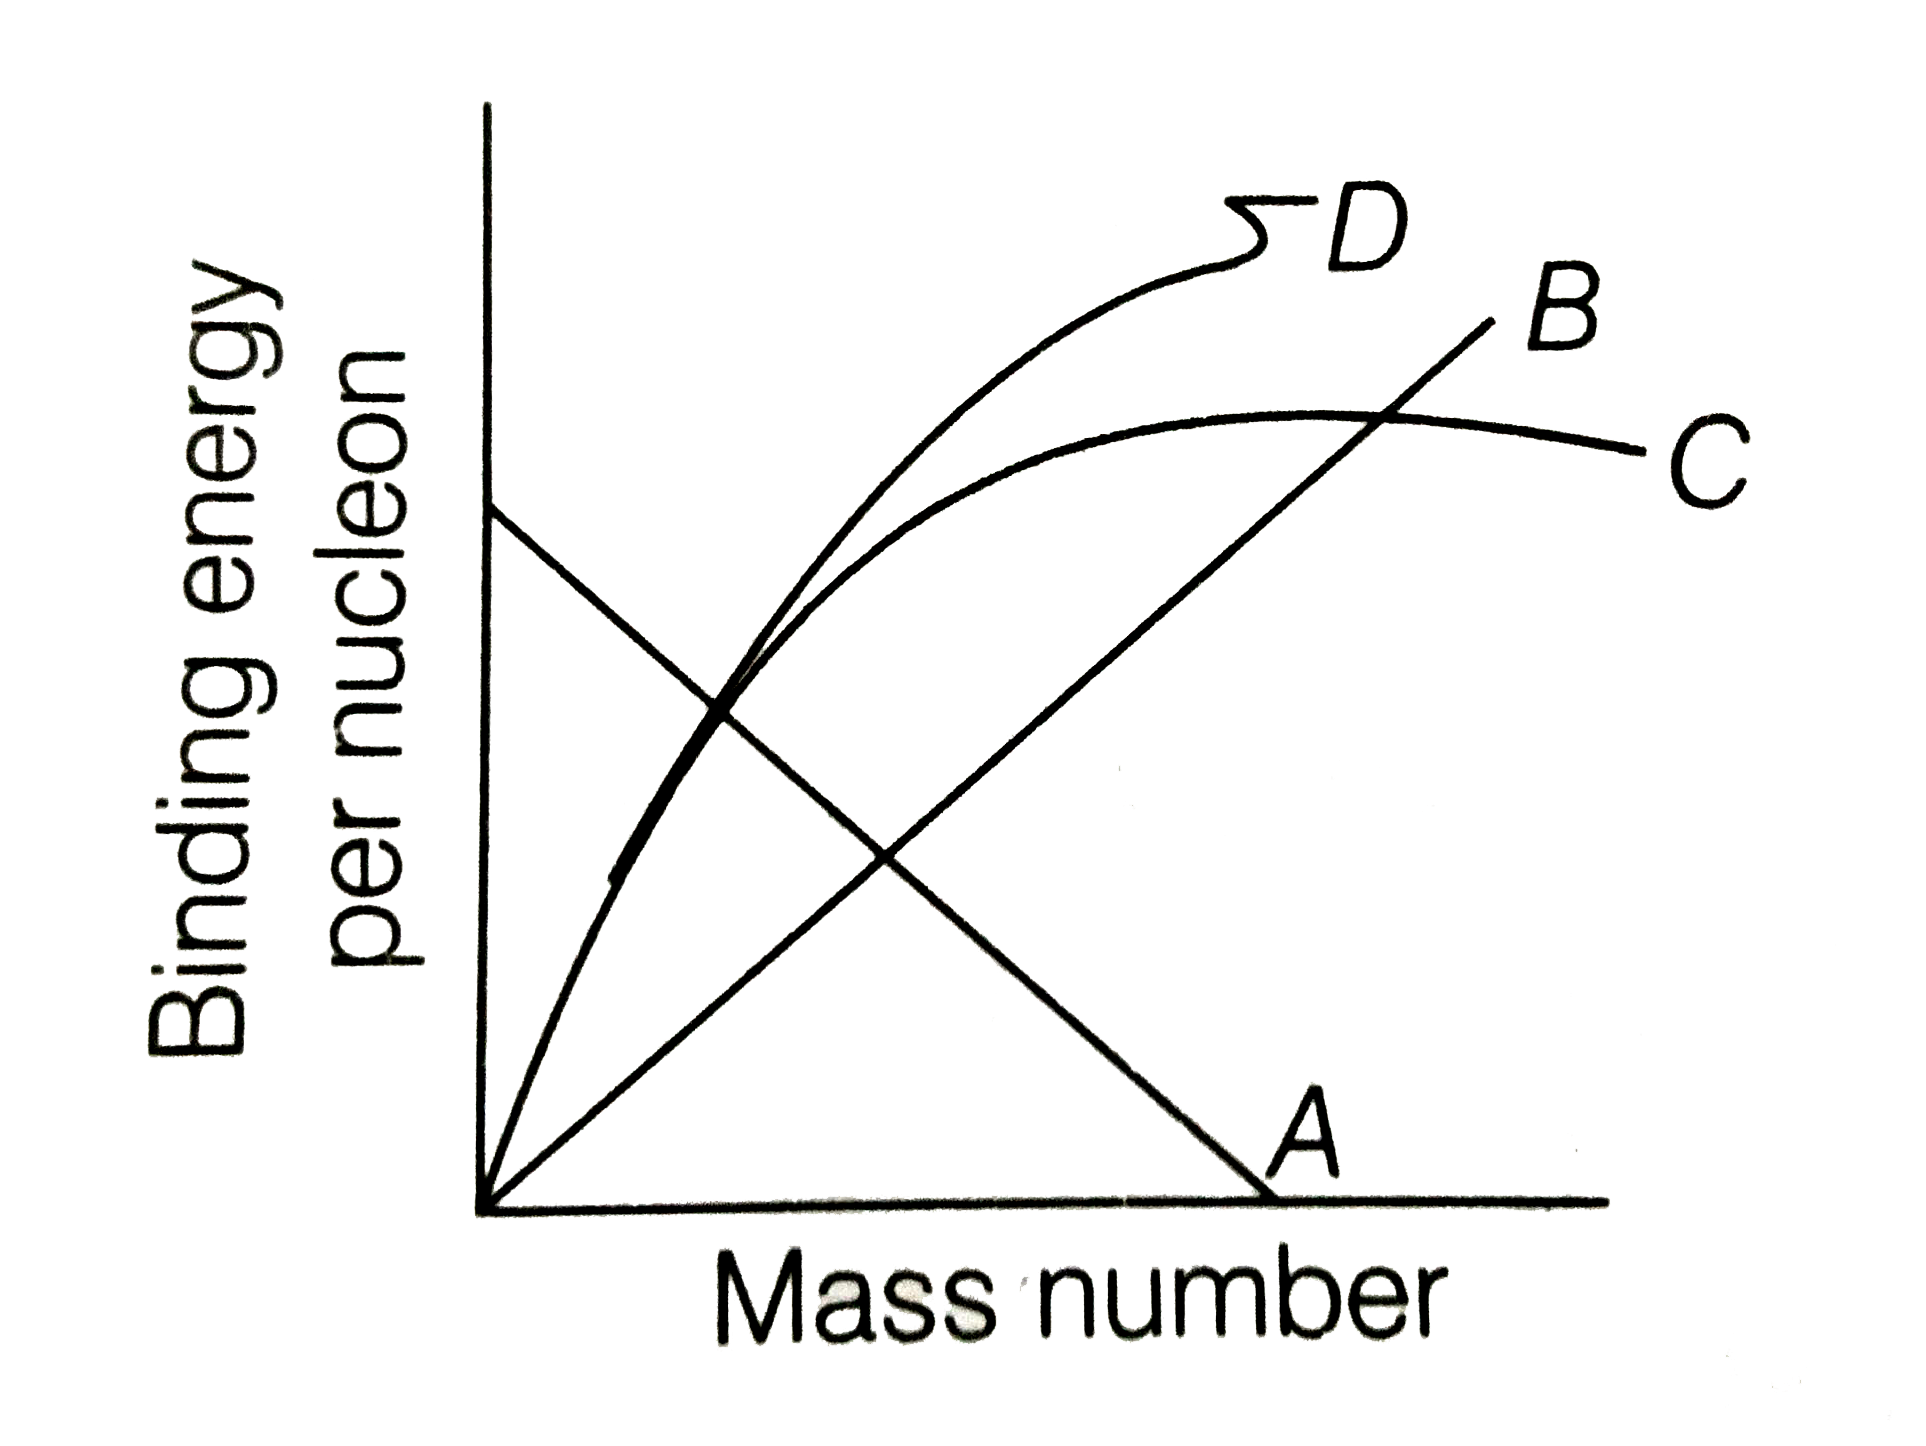
Binding energy per nucleon plot against the mass number for stable nuclei is show in the figure. Which curve is correct ?

A
B
C
D
The correct Answer is:C
Step by step video, text & image solution for Binding energy per nucleon plot against the mass number for stable nuclei is show in the figure. Which curve is correct ? by Physics experts to help you in doubts & scoring excellent marks in Class 12 exams.
Updated on:21/07/2023Topper's Solved these Questions
- NUCLEIBook:DISHA PUBLICATIONChapter:NUCLEIExercise:EXERCISE - 2 (CONCEPT APPLICATOR)
Explore 30 Videos
- NUCLEIBook:DISHA PUBLICATIONChapter:NUCLEIExercise:EXERCISE - 2 (CONCEPT APPLICATOR)
Explore 30 Videos
- MOVING CHARGES AND MAGNETISM Book:DISHA PUBLICATIONChapter:MOVING CHARGES AND MAGNETISM Exercise:EXERCISE - 2 : Concept Applicator
Explore 25 Videos
- OSCILLATIONS Book:DISHA PUBLICATIONChapter:OSCILLATIONS Exercise:Exercise-2 : Concept Applicator
Explore 28 Videos
Similar Questions
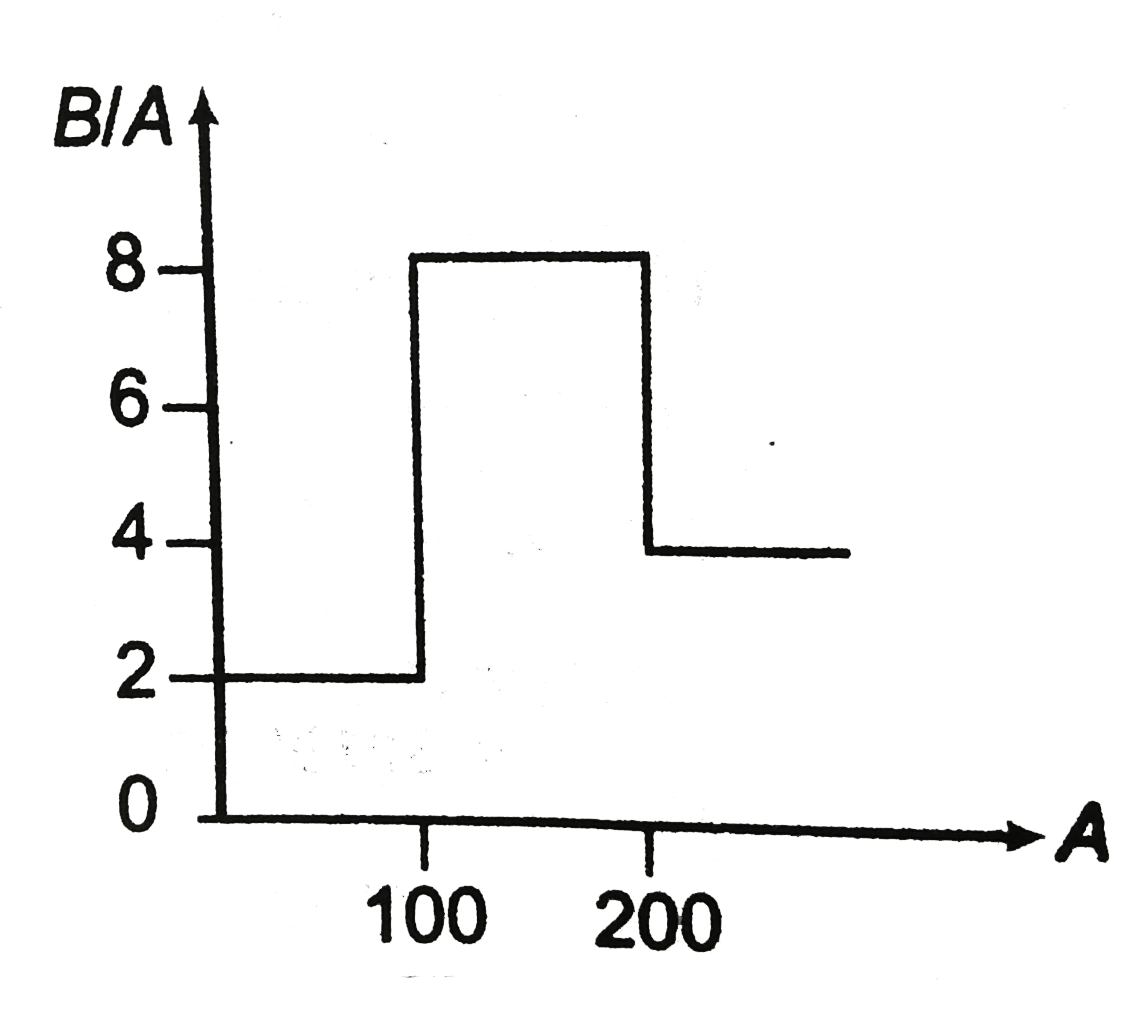
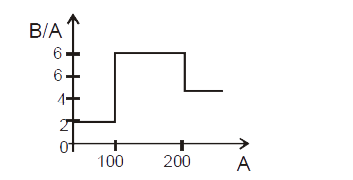
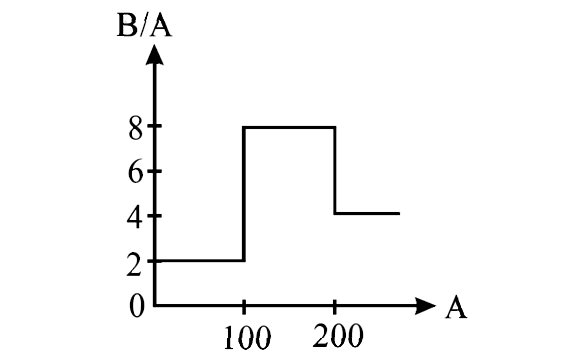
Assume that the nuclear binding energy per nucleon (B/A) versus mass number (A) is as shown in figure. Use this plot to choose the correct choice(s) given below.
(a) Fusion of two nuclei with mass numbers, lying in the range of 1<A<50 will release energy.
Fusion of two nuclei with mass numbers lying in the range of 51<A<100 will release energy.
(c) Fission of a nucleus lying in the mass range of 100<A<200 will release energy when broken into two equal fragements.
(d) Fission of a nucleus lying in the mass range of 200<A<260 will release energy when broken into two equal fragments.

View SolutionVariation Of Binding Energy Of Per Nucleon With Mass Number
View Solution
Knowledge Check
Binding energy per nucleon relation with mass number
Afirst decreases then increasesBfirst increases then decreasesCincreasesDdecreasesThe binding energy per nucleon is largest for
AO16BHe2CFe56DU238The binding energy per nucleon is maximum in the case of.
A.42HeB.5626FeC.14156BaD.23592U
Draw a graph showing the variation of binding energy per nucleon with mass number of different nuclei. State two inferences from this graph.
View SolutionThe binding energy per nucleon of nucleus is a measure of its.
View SolutionAssume that the nuclear binding energy per nucleon (B/A) versus mass number (A) is as shown in the figure. Use

this plot to choose the correct choice(s) given below. Figure
View SolutionThe average binding energy per nucleon is maximum for the nucleus
View SolutionAssume that the nucles binding energy per nucleus(B/A) versus mass number (A) is as shown in the figure Use this plate to choose the energy the correct (s) given below

View Solution

