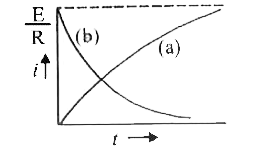
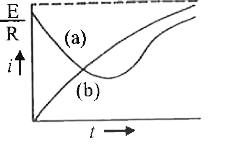
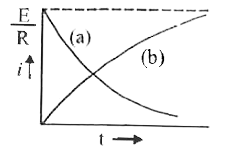
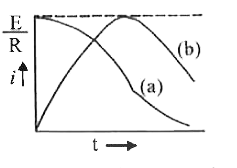
In the circuits (A) and (b) switches S1 and S2 are closed at t = 0 and are kept closed for a long time.The variation of current in the two circuits for t≥0 are roughly shown by figure (figures are schematic and not drawn to scale):

The correct Answer is:C
For capaciotr circuit, i=i0e−tRC
For inductor circuit, i=i0(1−e−RtL)
Hence graph (c) correctly depicts i versus t graph.
Related Playlists
Similar Questions
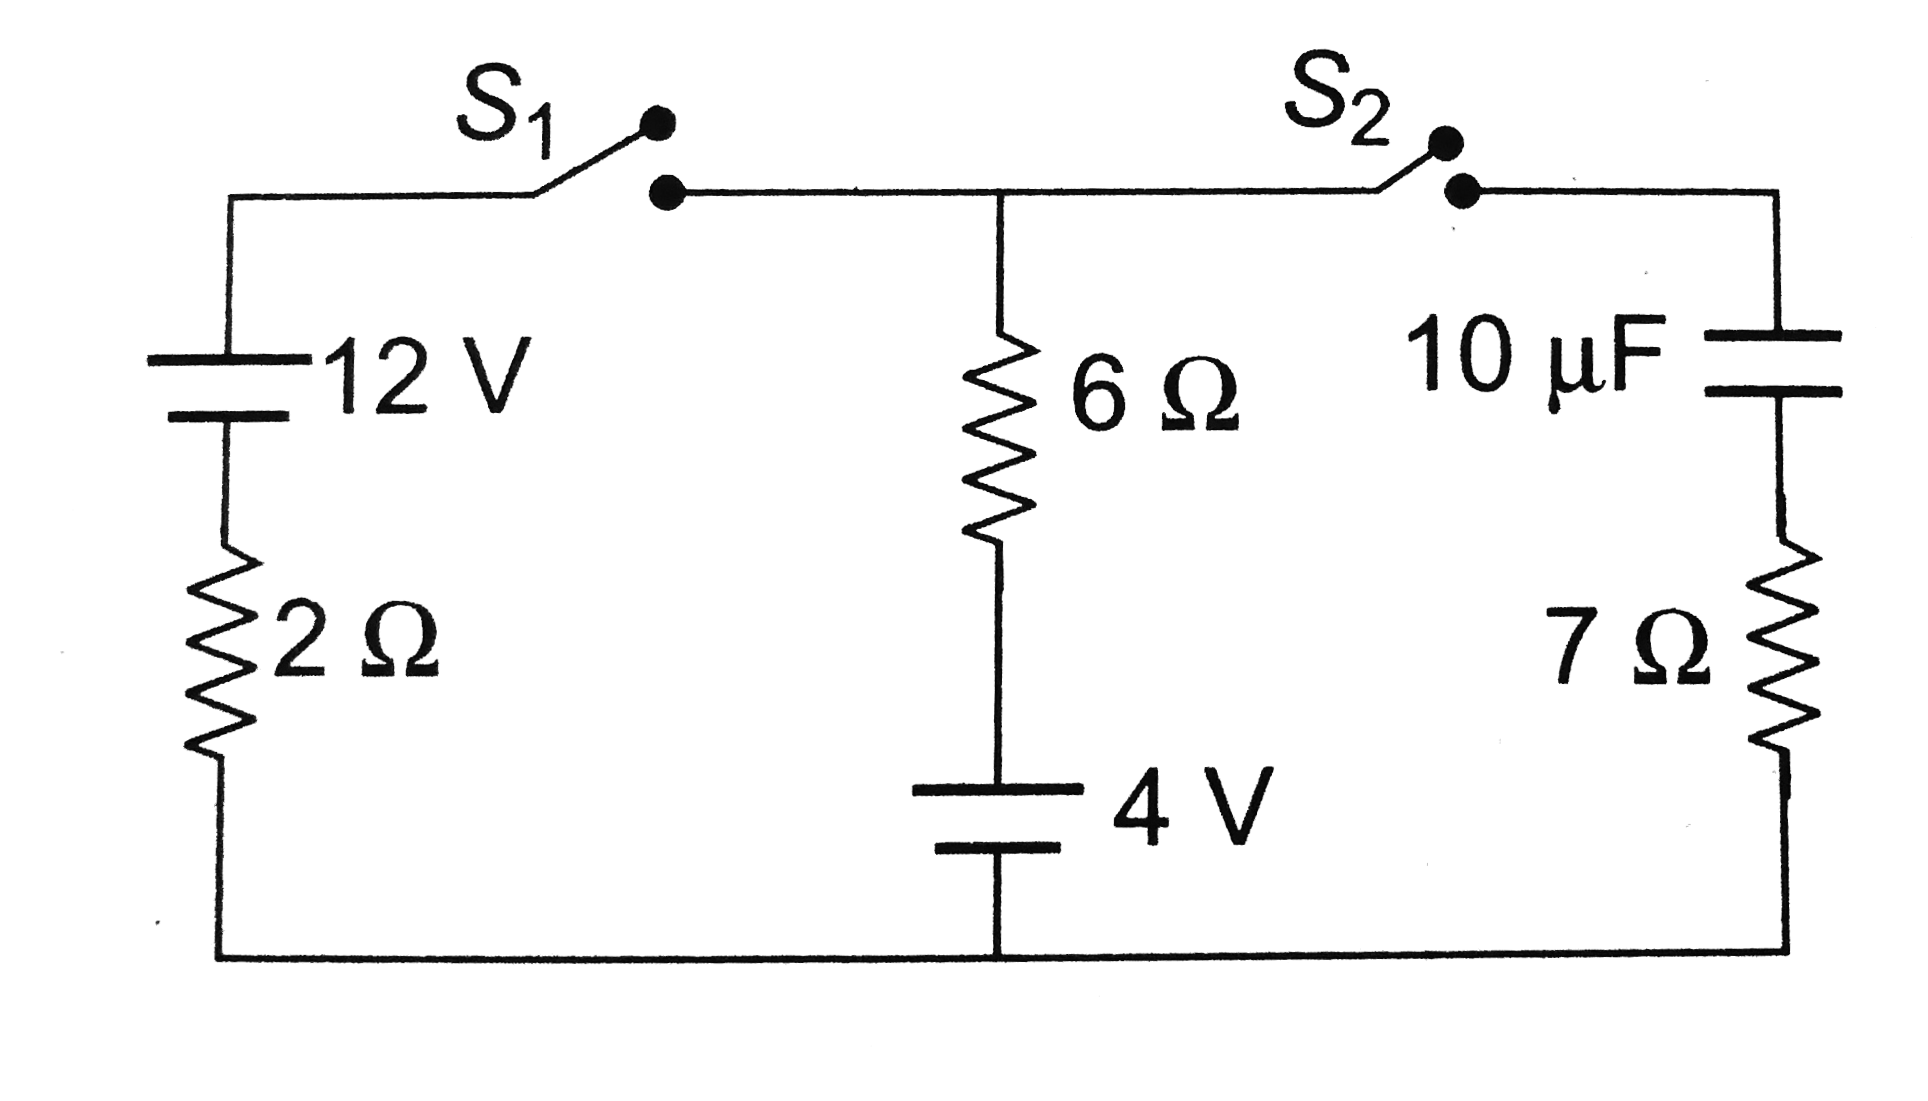
In the circuit shown in the figure, if switches S1 and S2 have been closed for a long time, then charge on the capacitor.
 View Solution
In the circuit shown in the figure, if switches S1 and S2 have been closed for a long time, then charge on the capacitor.
 View Solution
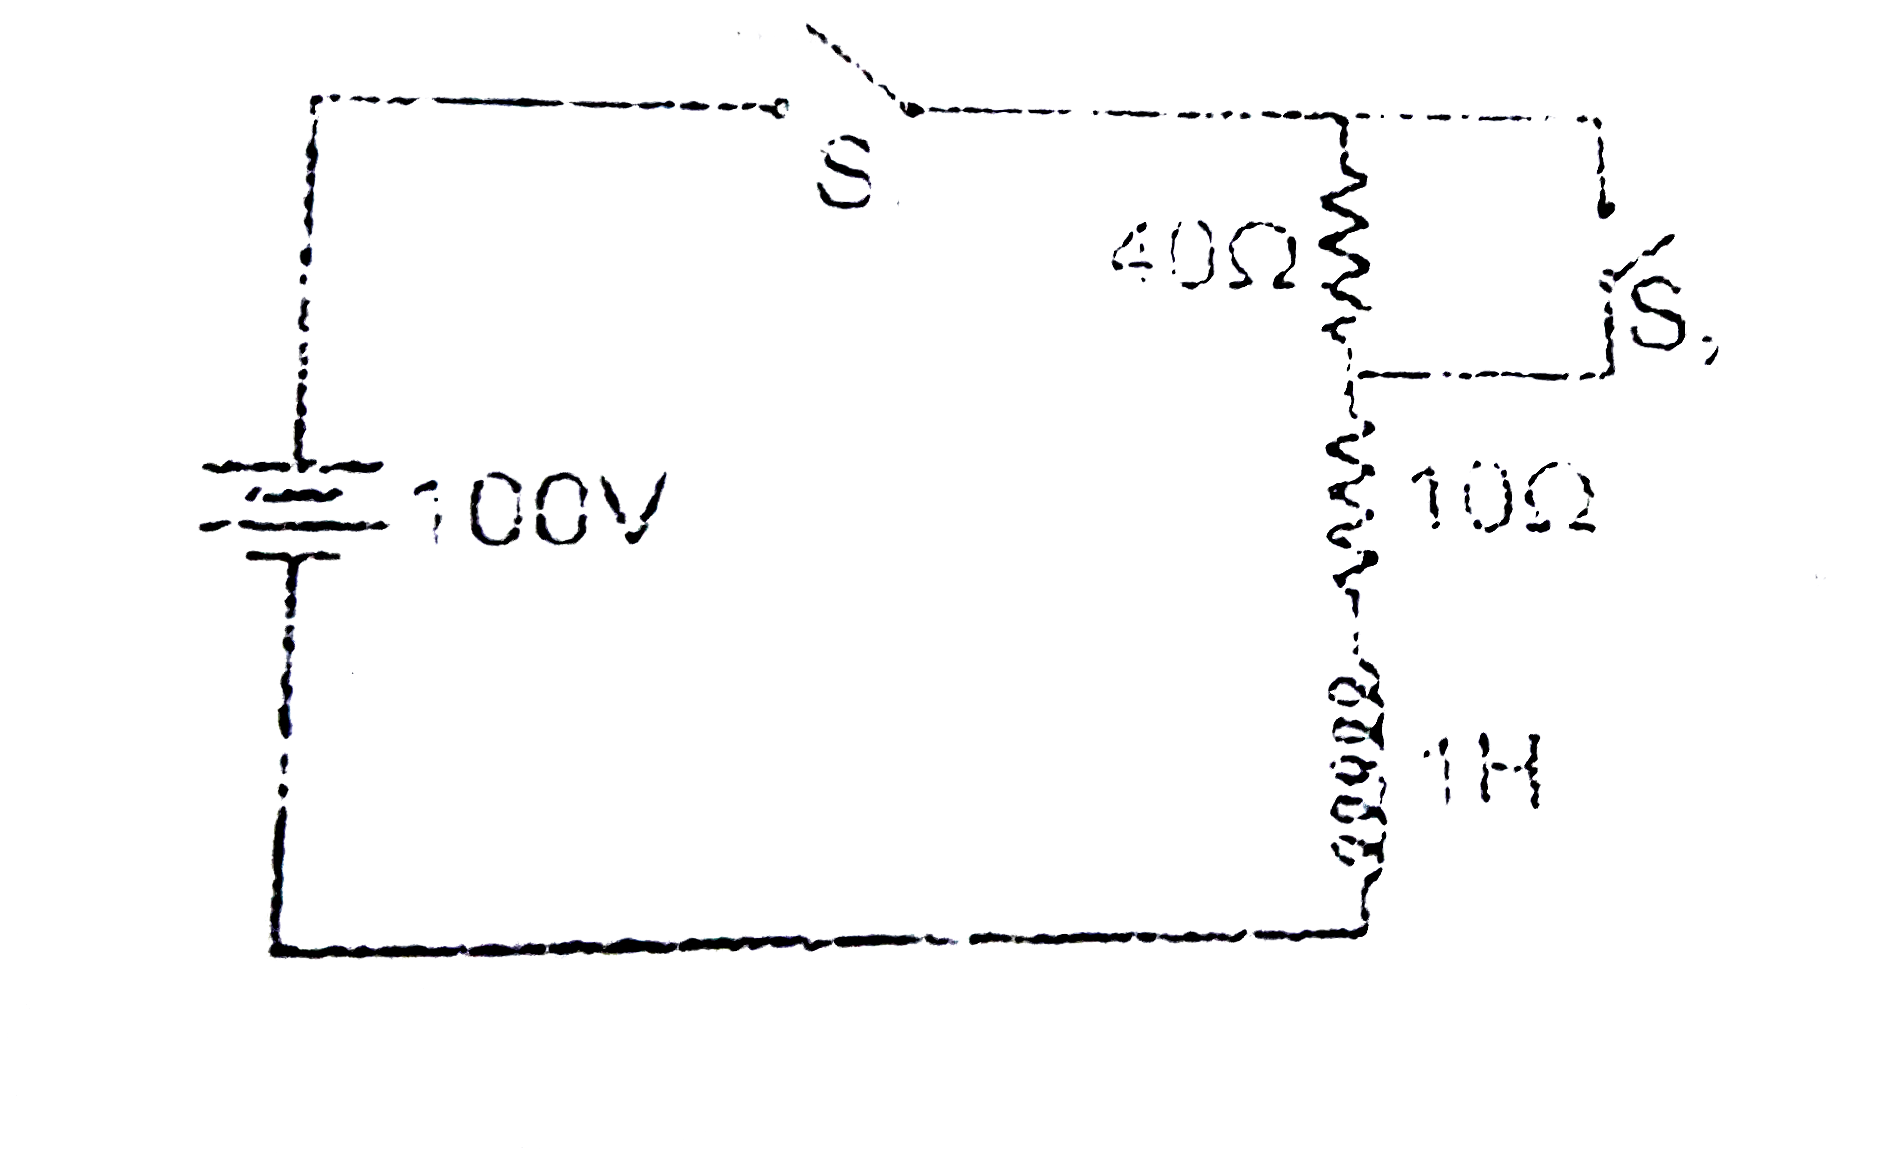
In the circuit diagram shown in the figure the switches S1 and S2 are closed at time t=0.After time t=(0.1)ln2sec, switch S2 is opened.The current in the circuit at time t=0.2n2sec is equal to x32amp.Find out value of x.
 View Solution
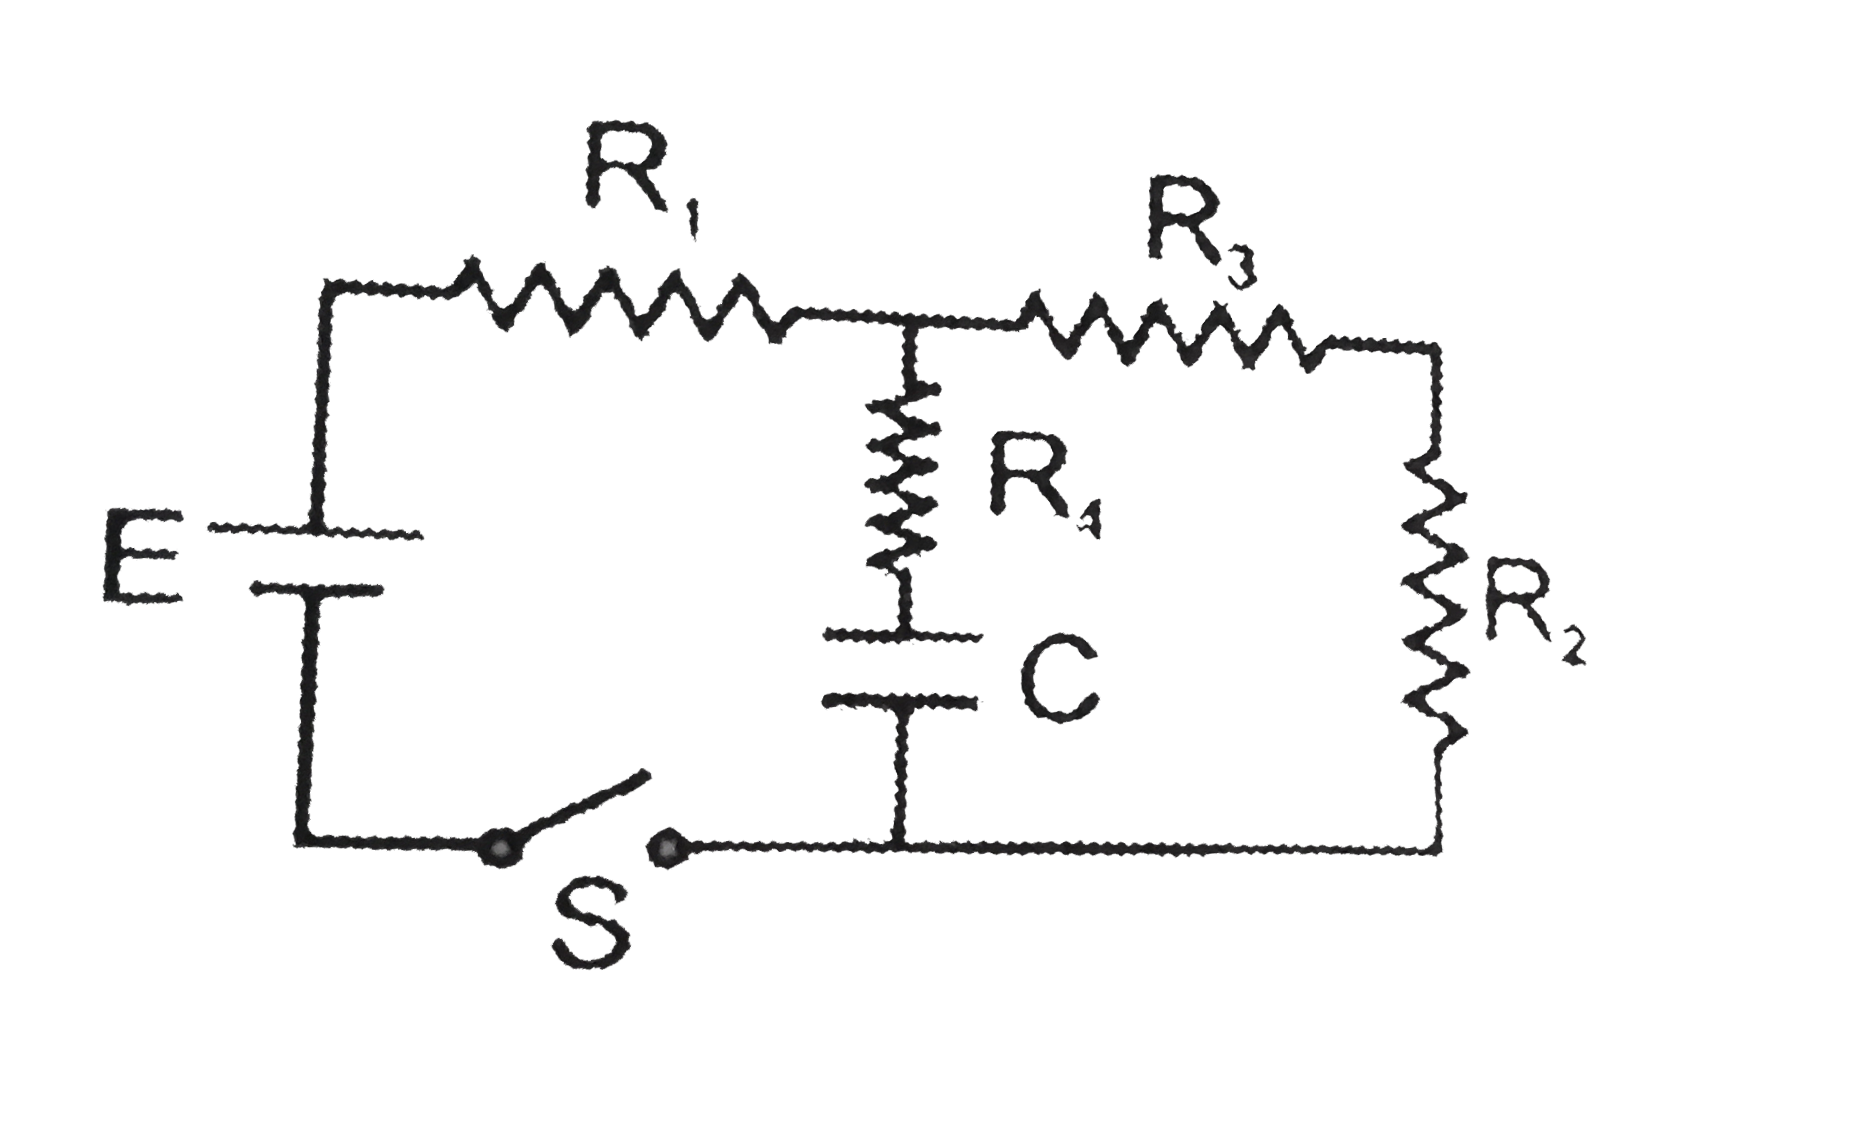
In the circuit shown in figure the switch S is closed at t = 0. A long time after closing the switch
 View Solution
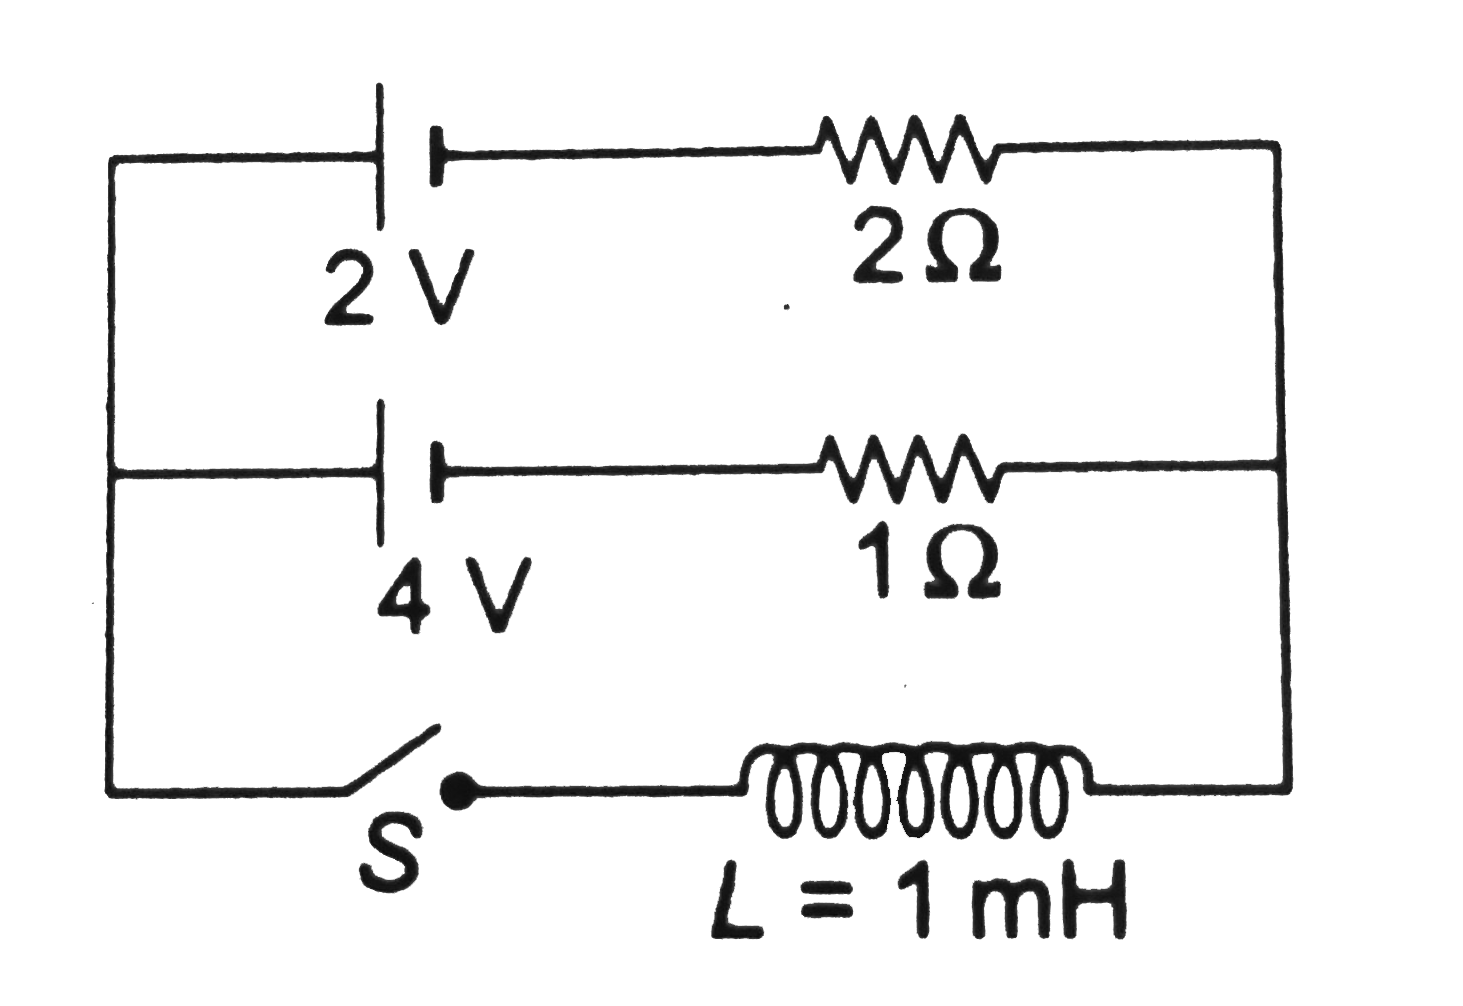
In the circuit shown, switch S is closed at time t=0. Find the current through the inductor as a function of time t.
 View Solution
In the circuit shown, switch S is closed at time t=0. Find the current through the inductor as a function of time t.
 View Solution
In the circuit as shown in figure the switch is closed at t=0.
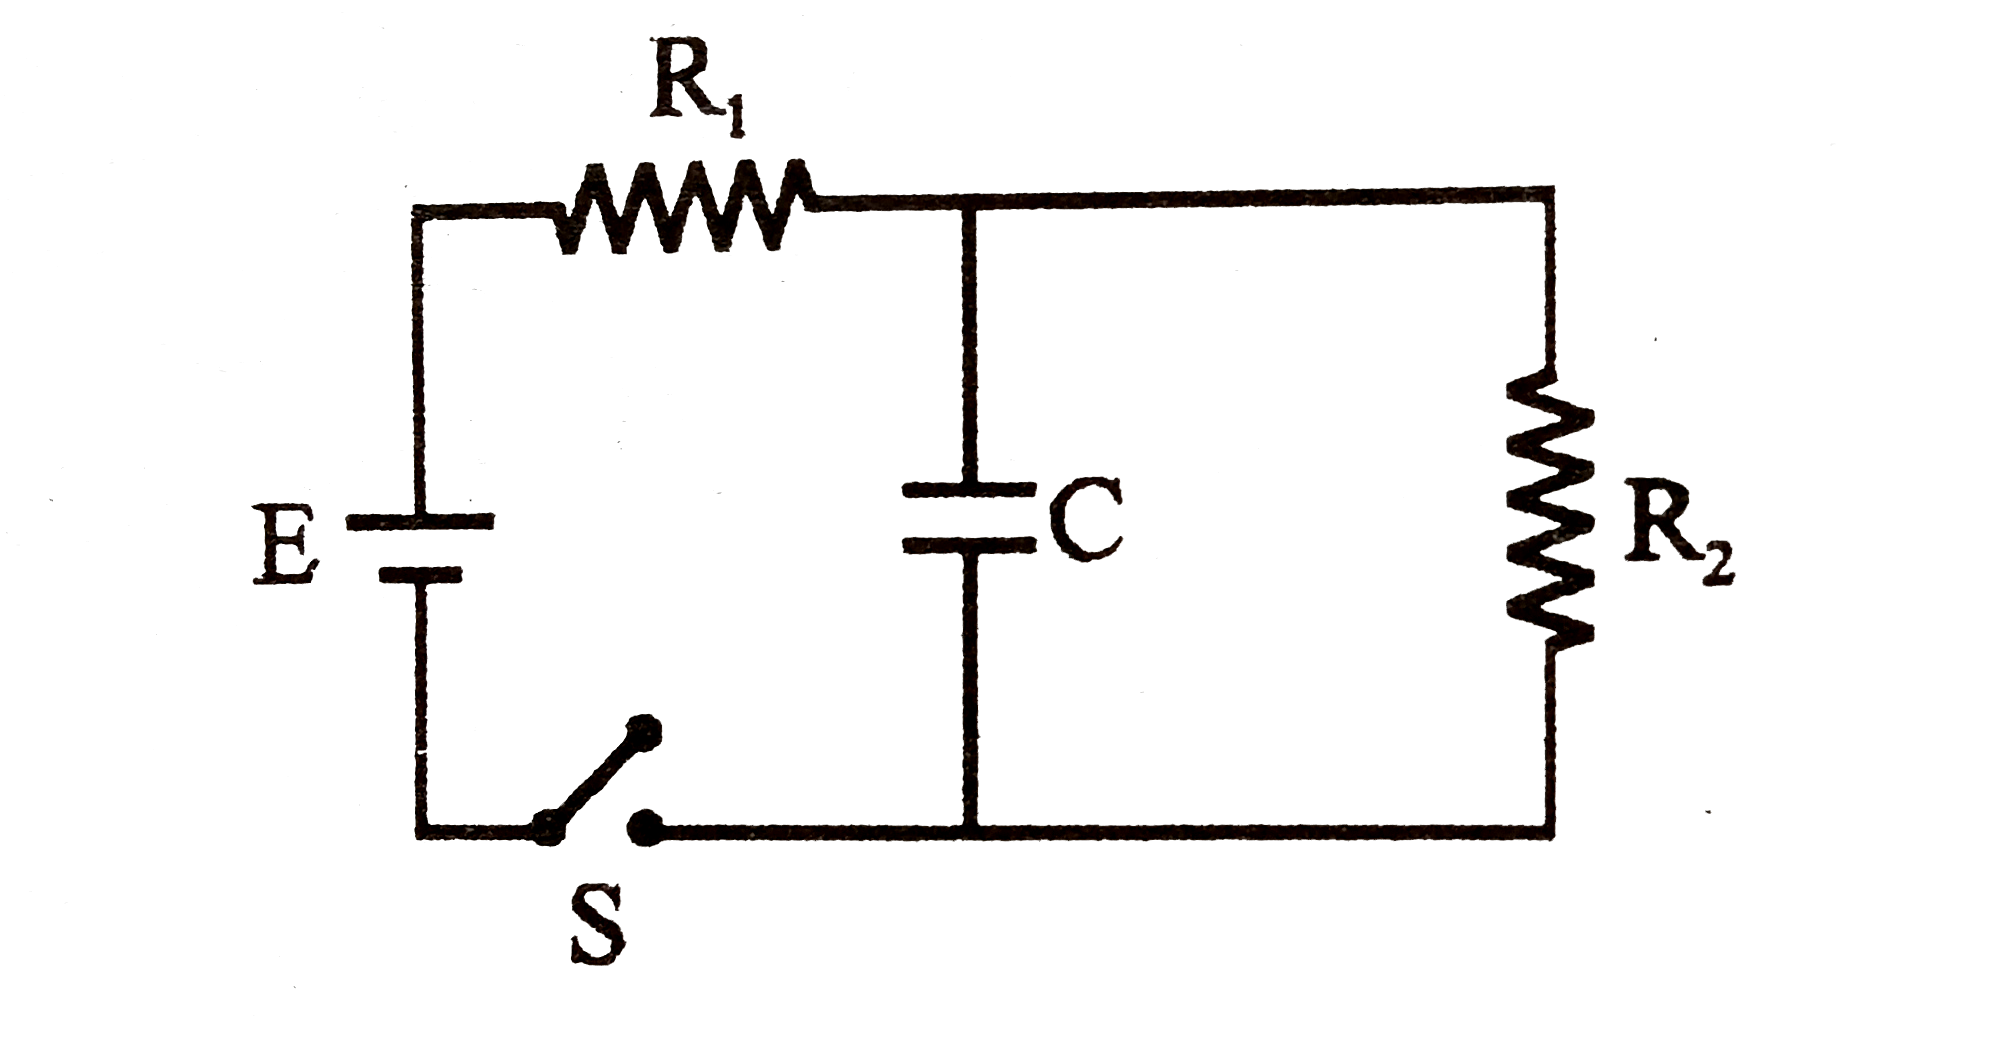
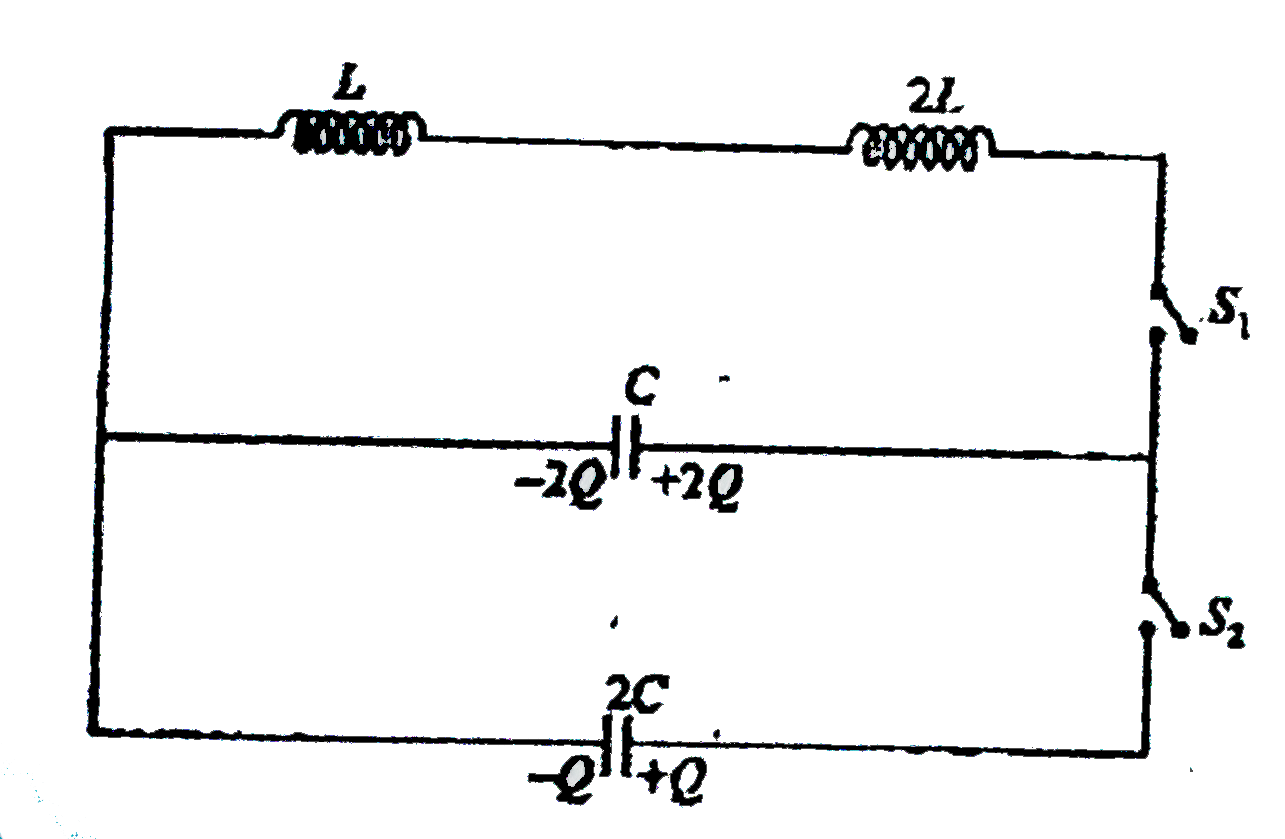
A long time after closing the switchView SolutionIn circuit shown in figure-5.149 if switches S1 and S2 are closed at t=0, find the oscillation frequency of charge in this circuit. Neglect mutual induction between inductors.
 View Solution
In the circuit as shown in figure the switch is closed at t=0.
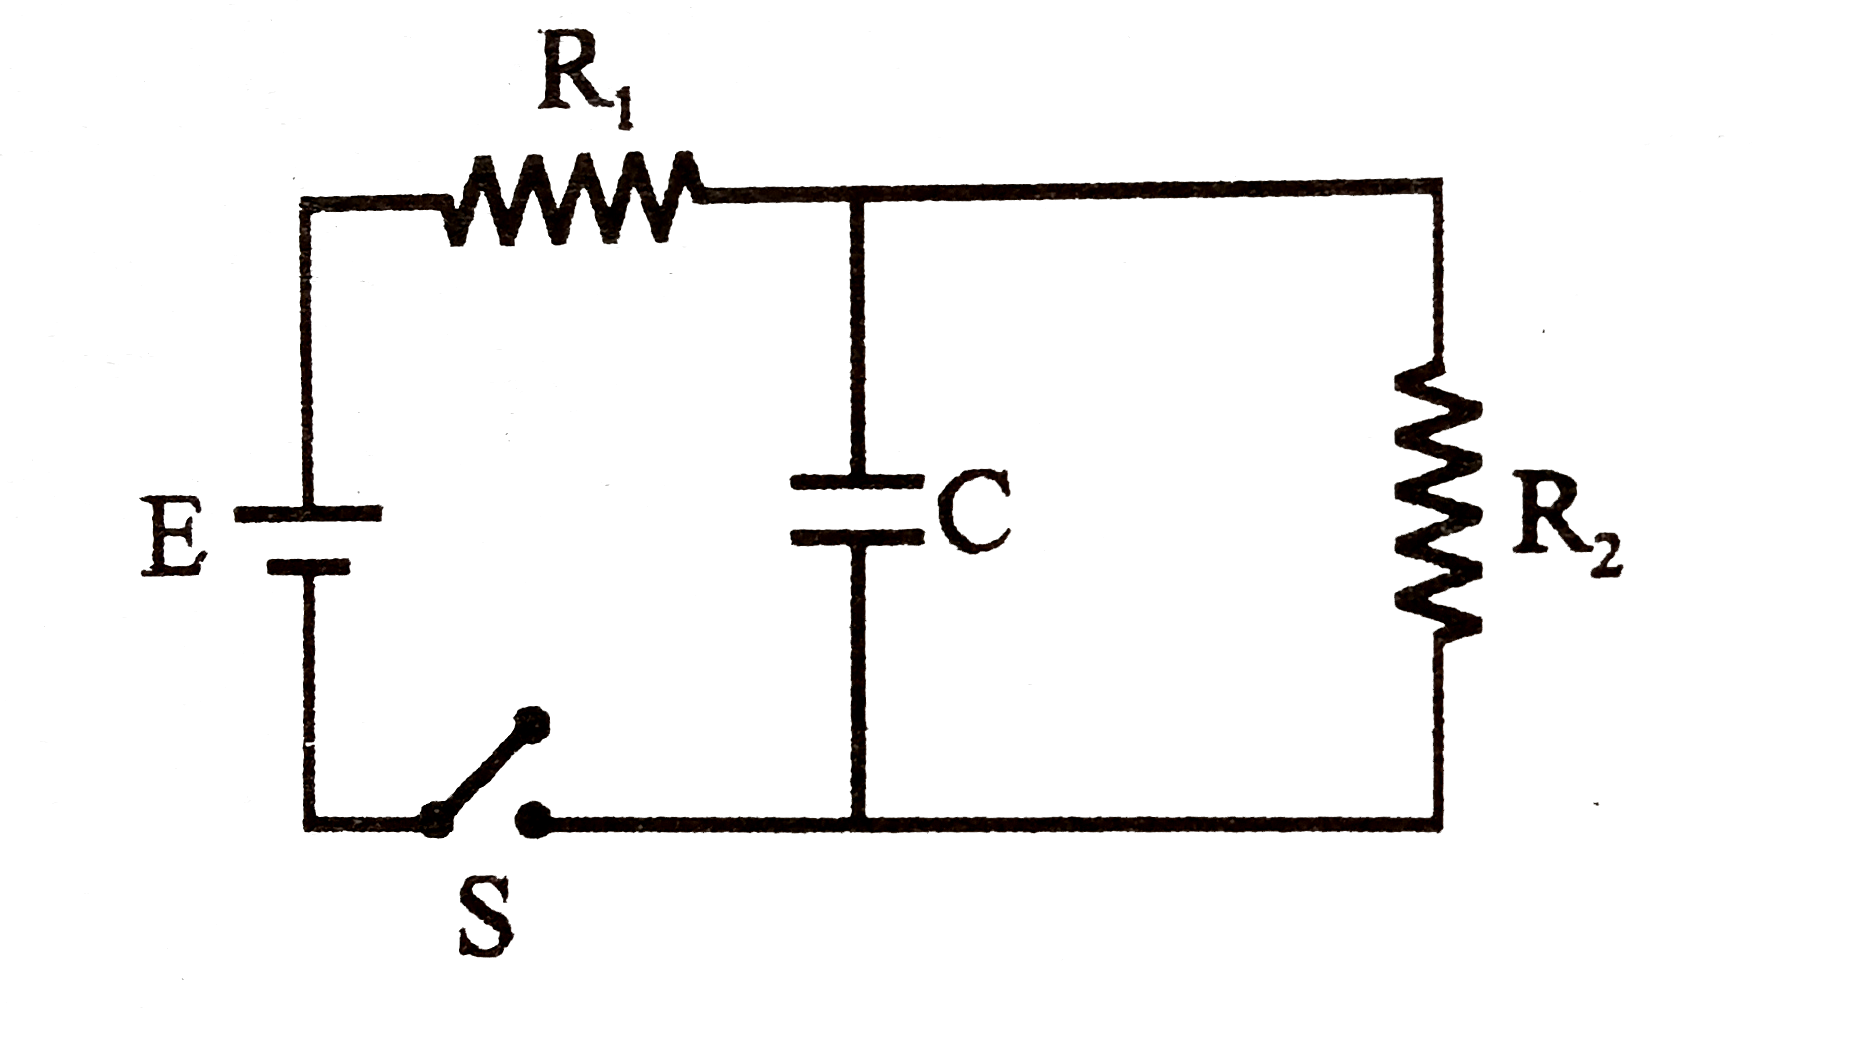
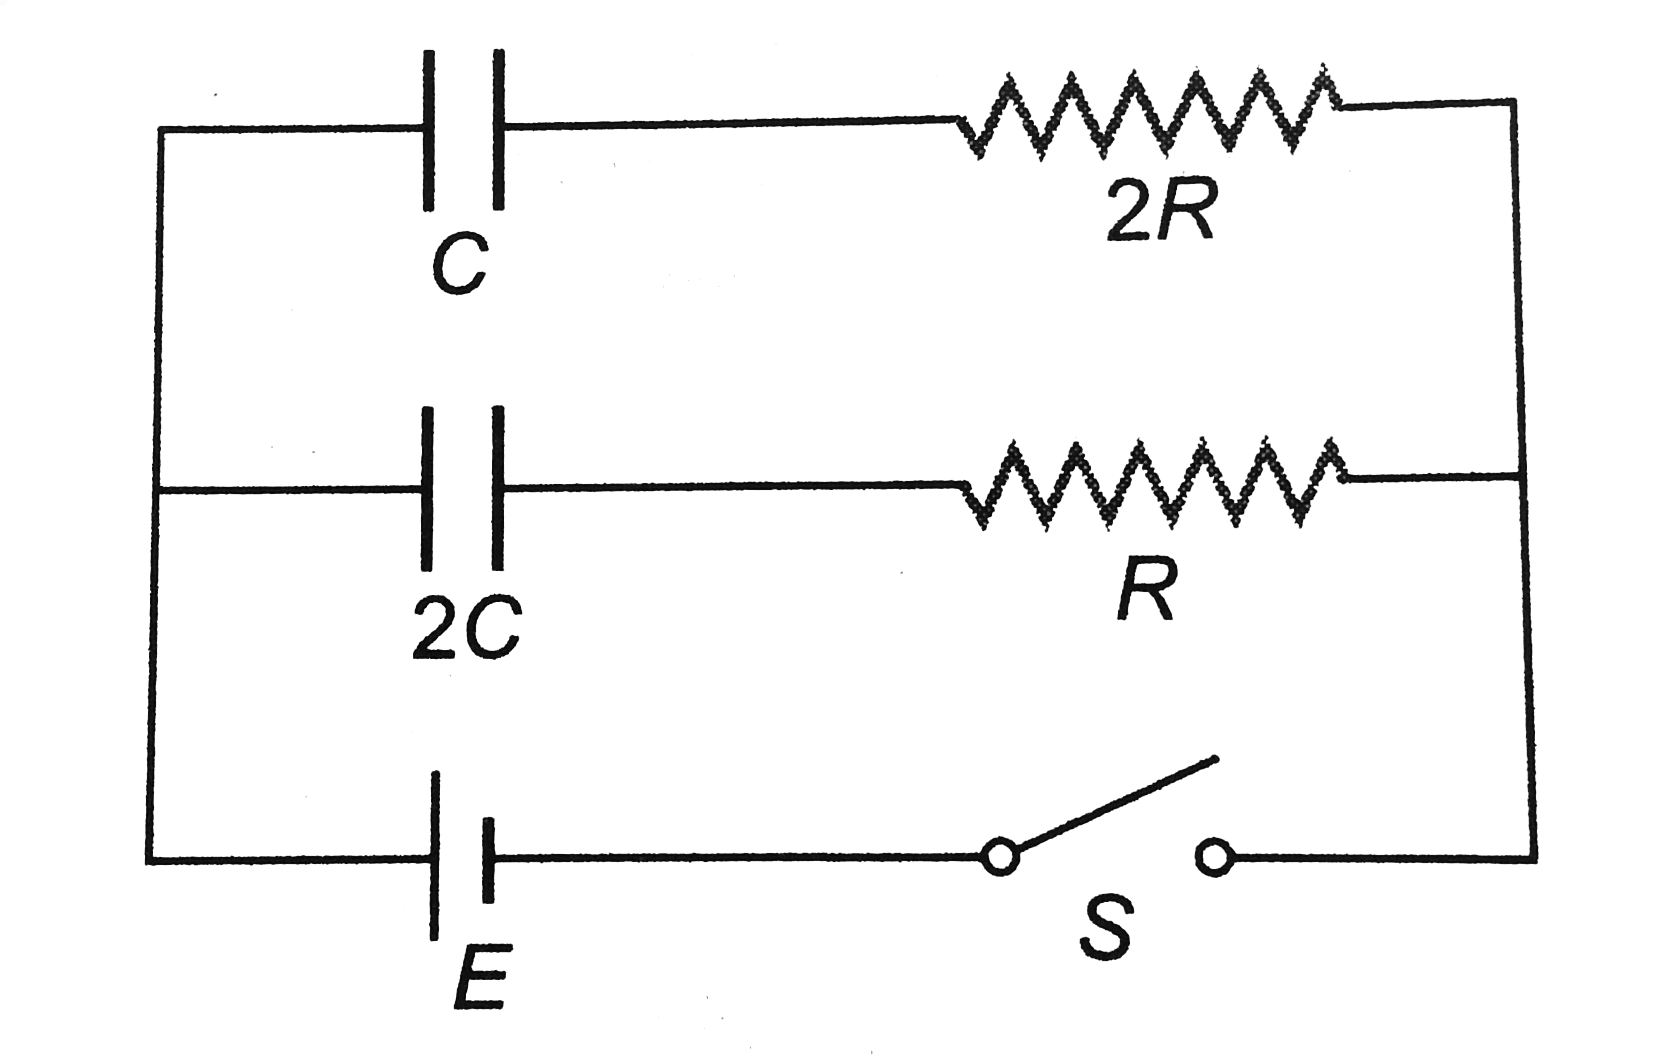
At the instant of closing the switchView SolutionIn the circuit shown in the figure, switch S is closed at time t=0. Select the correct statements.
 View Solution

