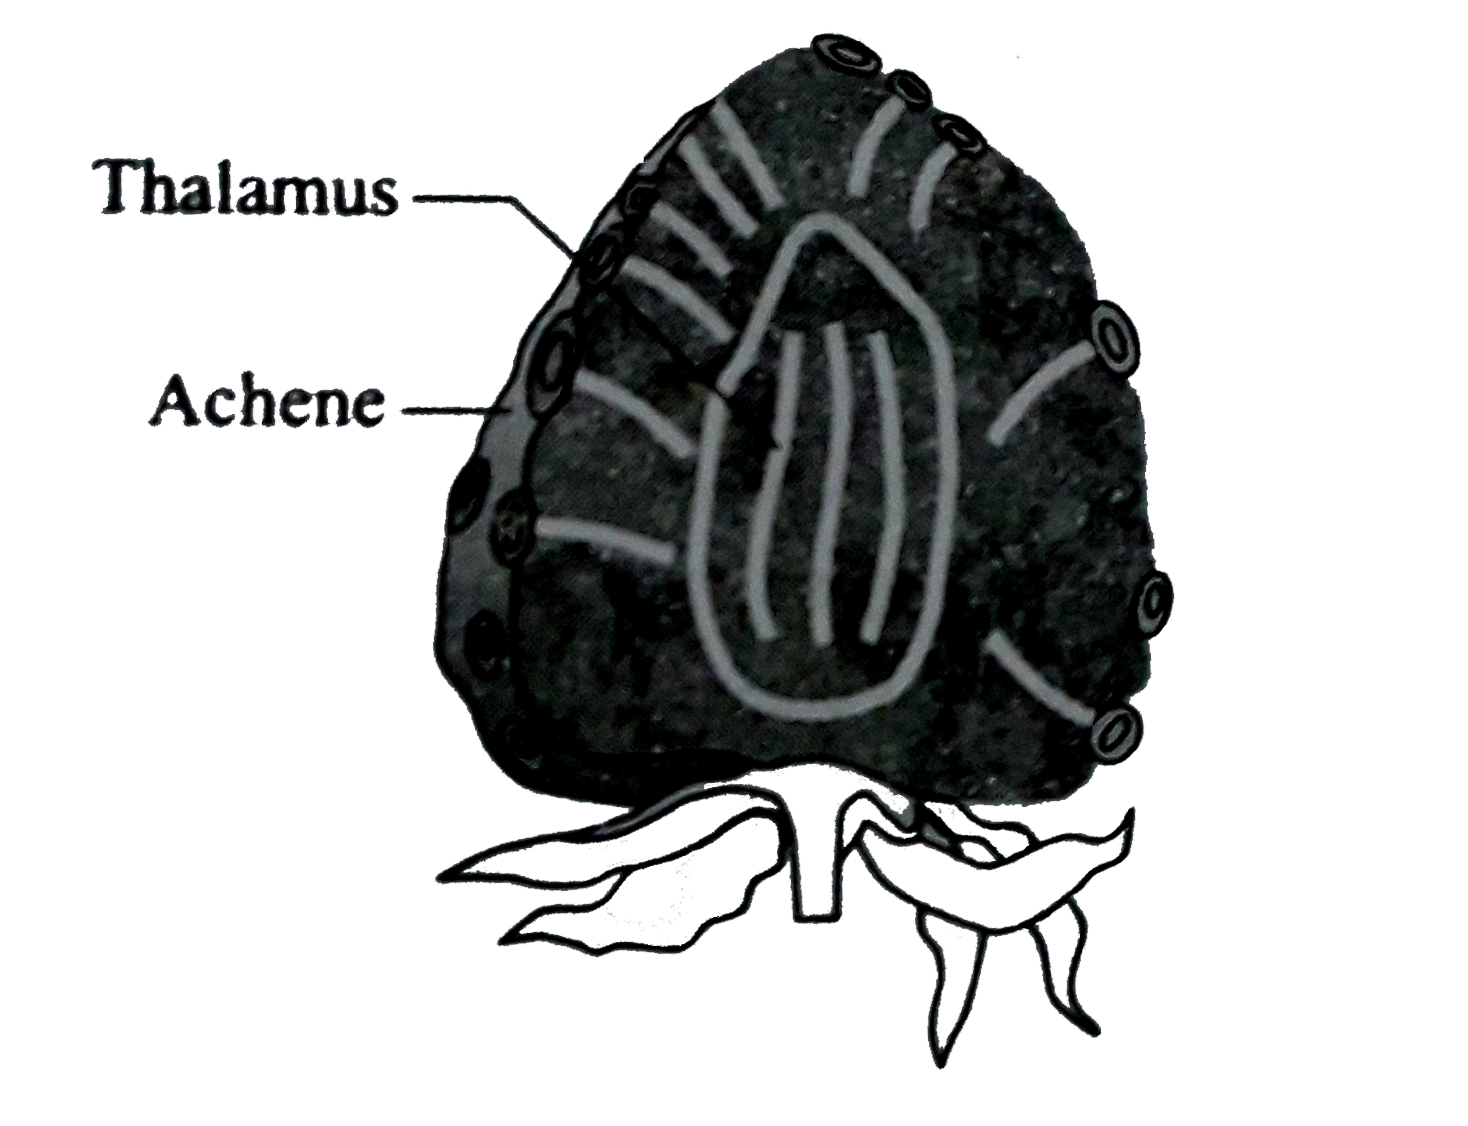
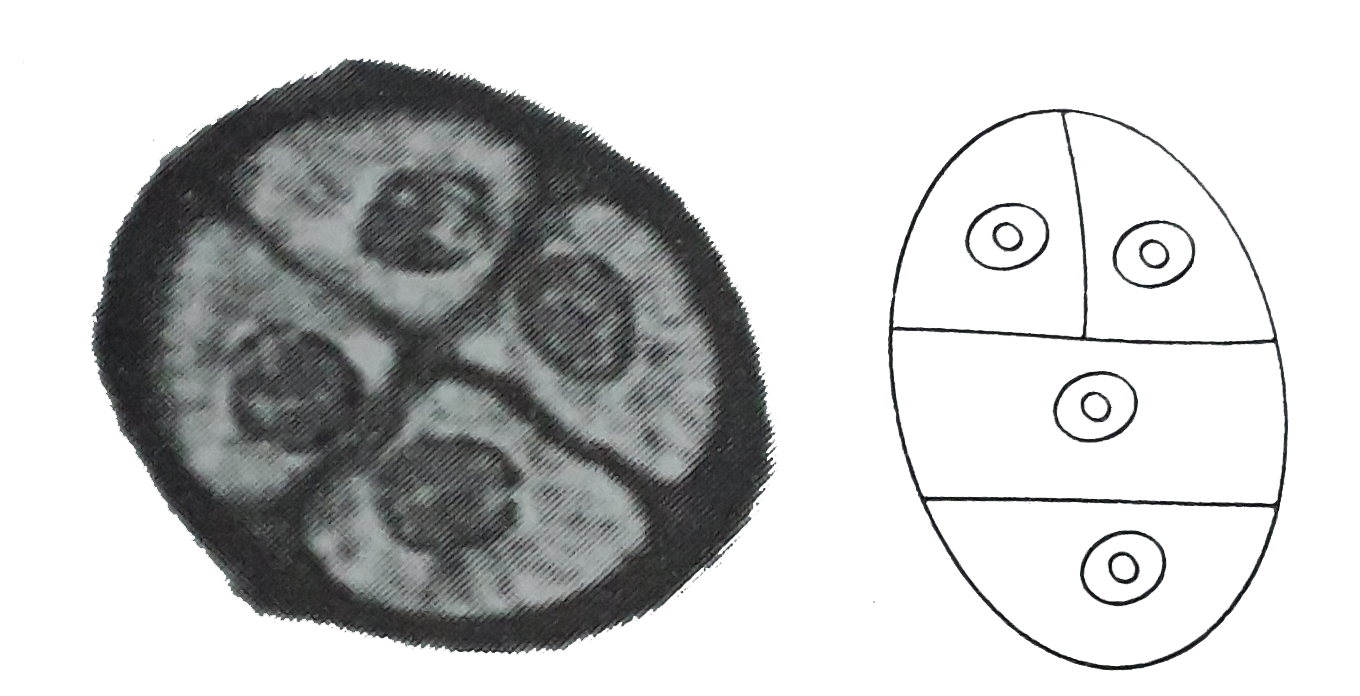
The following figure show
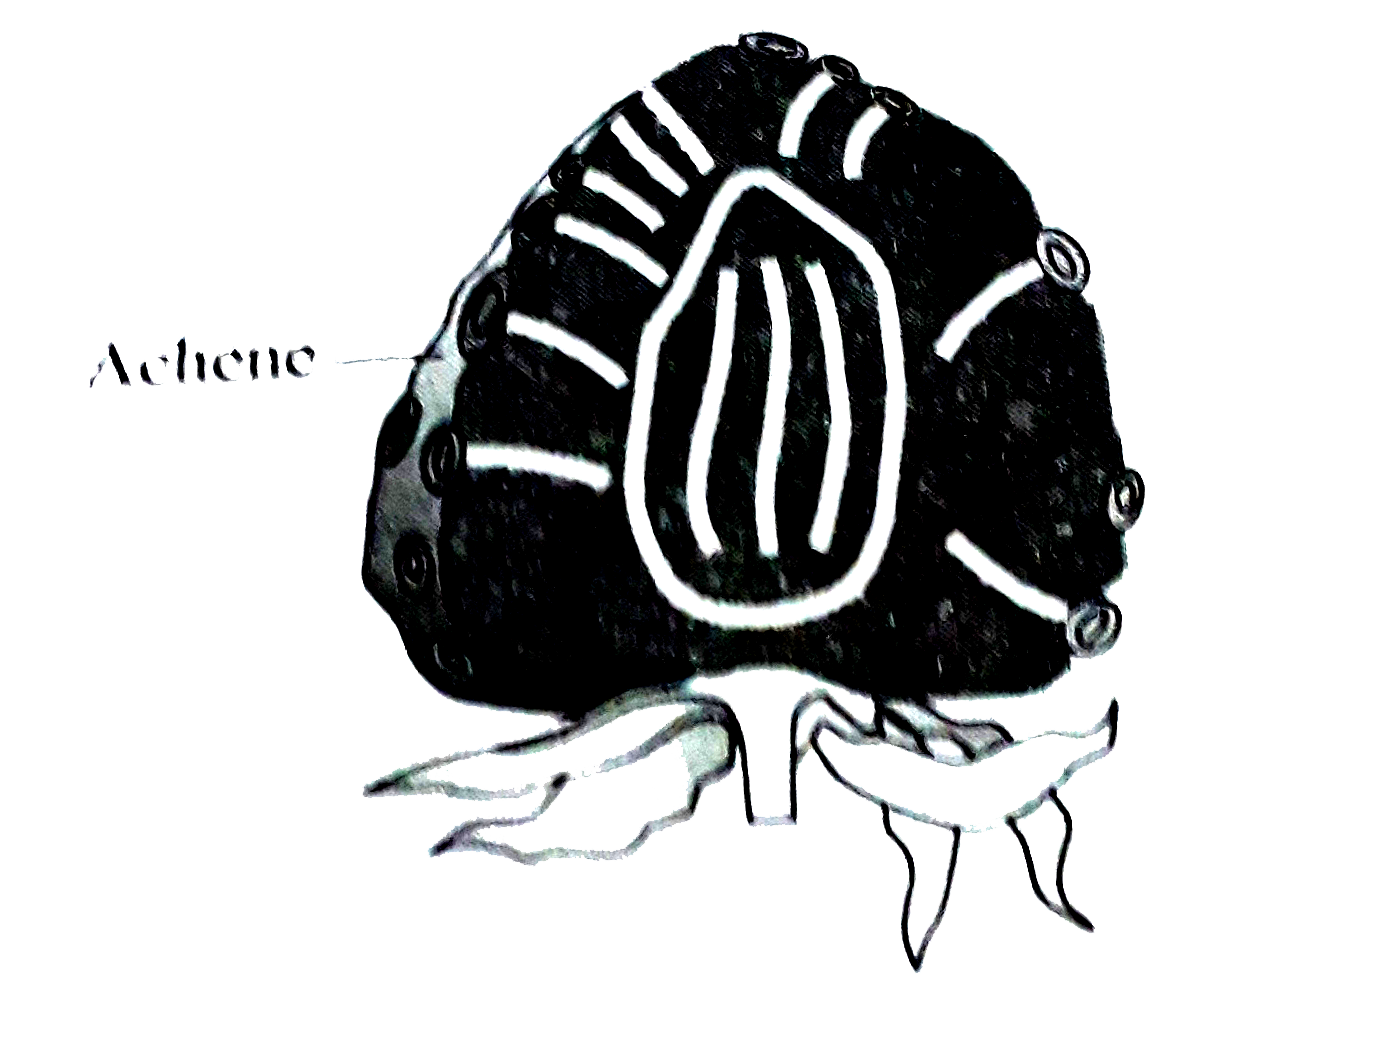
True fruit of cashew
False fruit of strawberry
Parthenocarpic fruit of strawberry
Apomictic seed of litchi
The correct Answer is:B
Topper's Solved these Questions
- SEXUAL REPRODUCTION IN FLOWERING PLANTS BOOK - A2ZCHAPTER - SEXUAL REPRODUCTION IN FLOWERING PLANTS EXERCISE - Section A: Topicwise Questions (topic : 8 Apomixis And Polyembryony)
6 Videos
- SEXUAL REPRODUCTION IN FLOWERING PLANTS BOOK - A2ZCHAPTER - SEXUAL REPRODUCTION IN FLOWERING PLANTS EXERCISE - Section B : (assertion-reasoning Questions)
15 Videos
- SEXUAL REPRODUCTION IN FLOWERING PLANTS BOOK - A2ZCHAPTER - SEXUAL REPRODUCTION IN FLOWERING PLANTS EXERCISE - Section A: Topicwise Questions (topic :6 Endosperm) Embryo
17 Videos
- REPRODUCTIVE IN ORGANISMSBOOK - A2ZCHAPTER - REPRODUCTIVE IN ORGANISMSEXERCISE - Section D: Chapter-end Test
50 Videos
- STRATEGIES FOR ENHANCEMENT IN FOOD PRODUCTIONBOOK - A2ZCHAPTER - STRATEGIES FOR ENHANCEMENT IN FOOD PRODUCTIONEXERCISE - Section-d Chapter End Test
50 Videos
Similar Questions
Knowledge Check
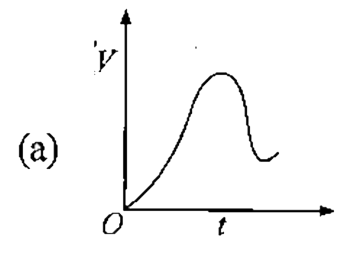
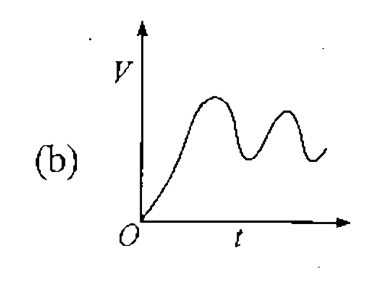
The following figures show some velocity versus time curves. But only some of these can be realised in practice. These are:
 ,
,  ,
, 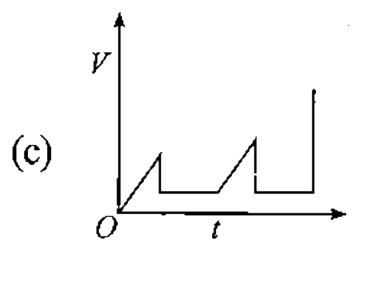 ,
, 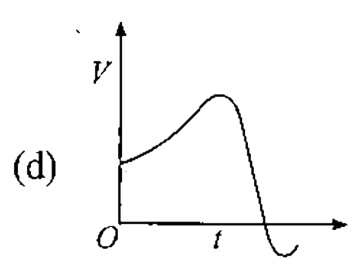 AOnly a, b and dBOnly a, b, cCOnly b and cDAll of them
Which of the following figures shows tubectomy ?
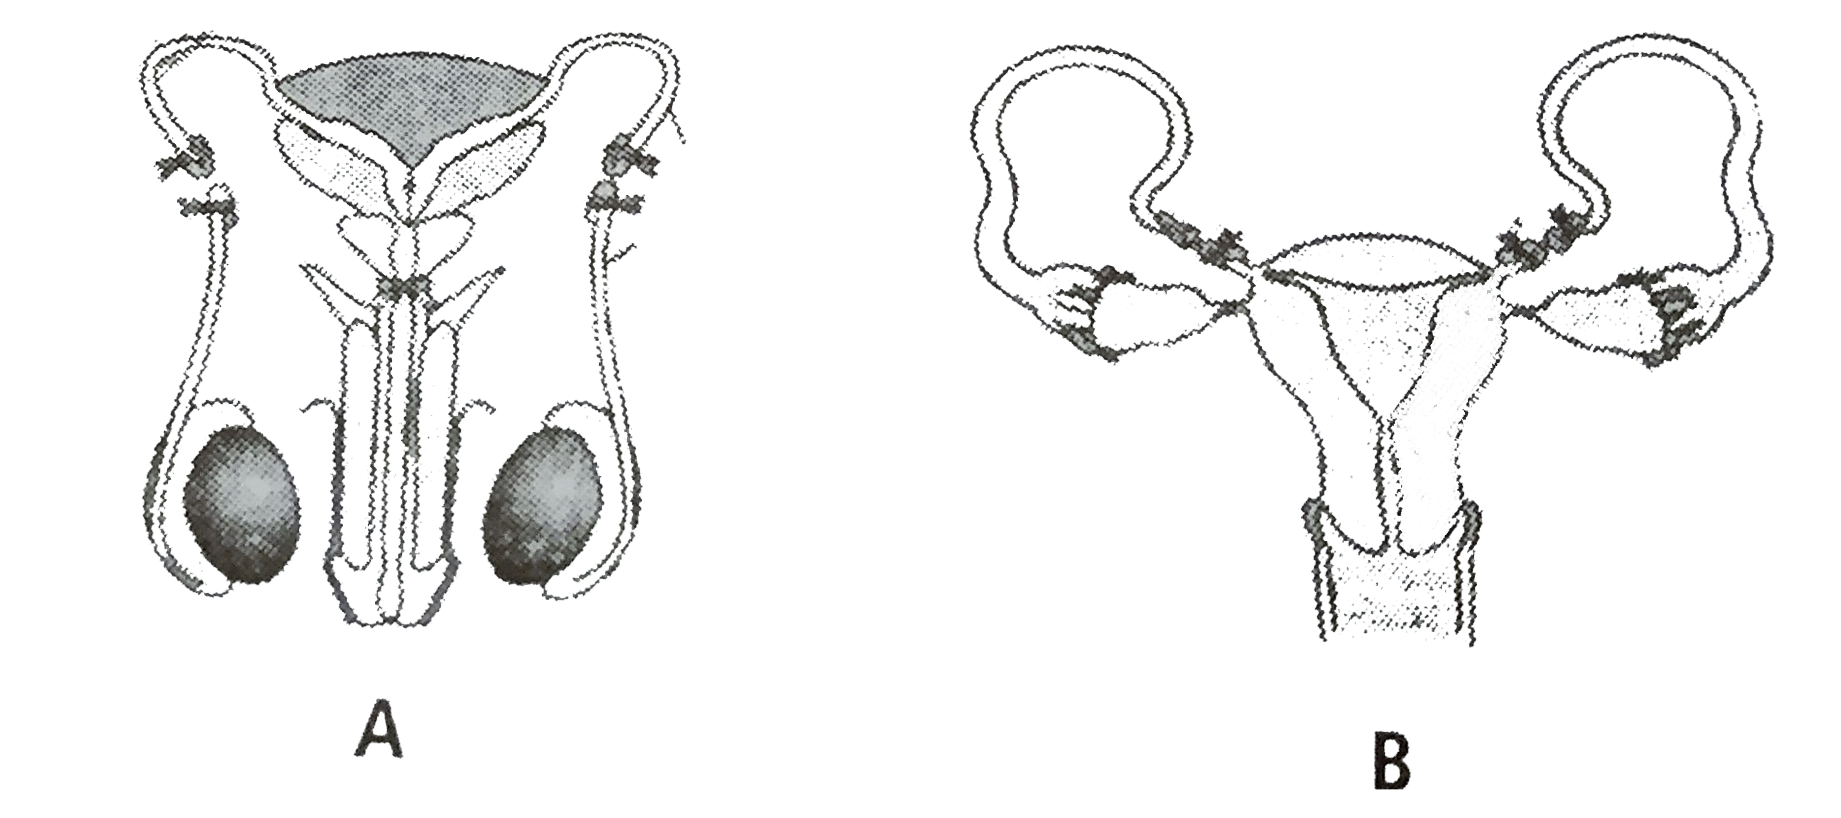 AA onlyBB onlyCEither A or BDNone of these
Which of the following figures shows a correct representations of deviation and dispersion of light by a prism?
A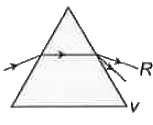 B
B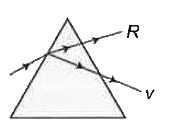 C
C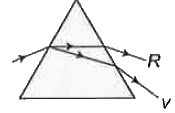 D
D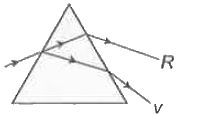
Each of the following figures shows paper cuttings with punched holes. Copy these figures on a plane sheet and mark the axis of symmetry so that paper is folded along it, then the wholes on one side of it coincide with the holes on the other side.
View SolutionWhich of the following figures shows the stages of development of the bean plant in correct order ?
View SolutionWhich of the following figures shows correct relative contribution of greenhouse gases to global warming?
View SolutionWhich of the following figures show(s) the bonding in diborane ?
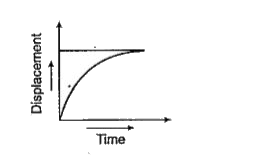
View SolutionThe variation of displacement with respect to time is depicted in the following figure. The figure shows that
View Solution

