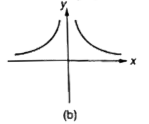
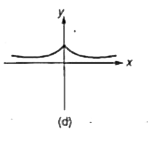
Which of the following represents the graph of e−x2:
A

B
C

D
Video Solution
Text Solution
The correct Answer is:D
|
Answer
Step by step video, text & image solution for Which of the following represents the graph of e^(-x^(2)): by Maths experts to help you in doubts & scoring excellent marks in Class 14 exams.
Updated on:21/07/2023Topper's Solved these Questions
- FUNCTIONS AND GRAPHBOOK - ARIHANT SSCCHAPTER - FUNCTIONS AND GRAPHEXERCISE - Final Round
40 Videos
- FUNCTIONS AND GRAPHBOOK - ARIHANT SSCCHAPTER - FUNCTIONS AND GRAPHEXERCISE - EXERCISE(LEVEL 1)
84 Videos
- ELEMENTS OF ALGEBRABOOK - ARIHANT SSCCHAPTER - ELEMENTS OF ALGEBRAEXERCISE - EXERCISE(LEVEL 1)
32 Videos
- FUNDAMENTALS BOOK - ARIHANT SSCCHAPTER - FUNDAMENTALS EXERCISE - TEST OF YOU - LEARNING - 2
40 Videos
Similar Questions
Knowledge Check
Which of the following represents an E isomer?
A B
B C
C D
D
Which of the following graph represents e−x?
A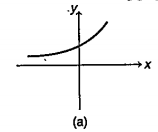 B
B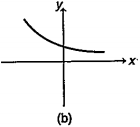 C
C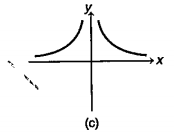 D
D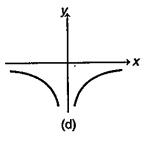
Let y=f(x)={e1x2ifx≠00ifx=0 then which of the following can best represent the graph of y=f(x)?
A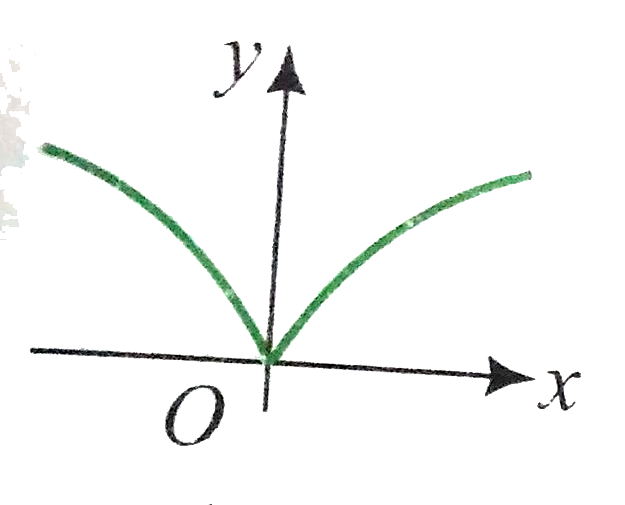 B
B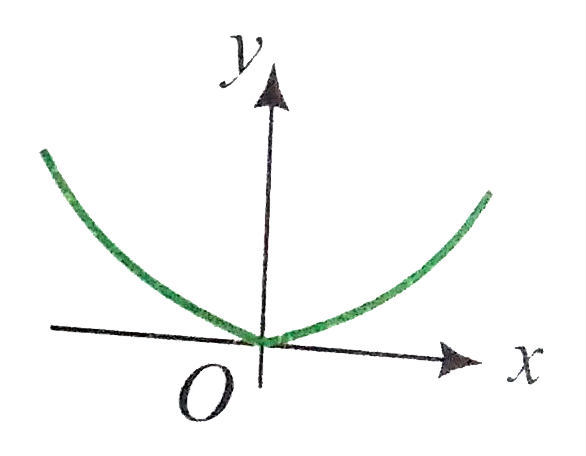 C
C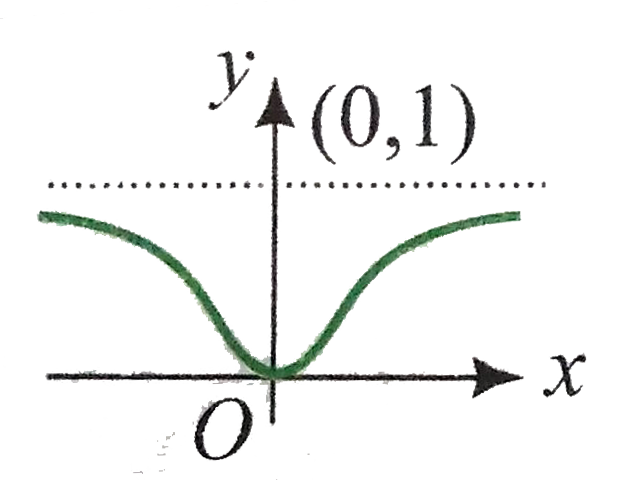 D
D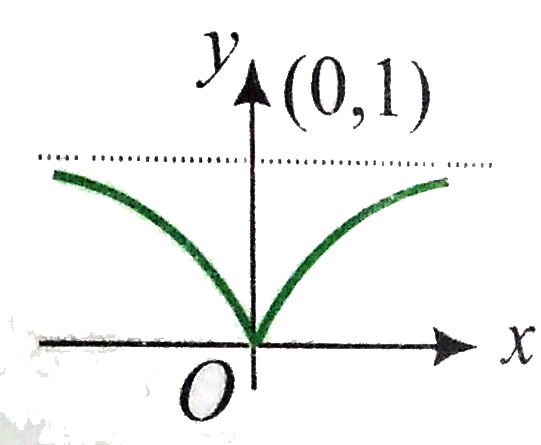
The graph of the function y=f(x). Then which of the following could represent the graph of the function y=|f(x)|
View Solution29. Which one of following best represents the graph of y=xlogxπ
View SolutionThe following graph represents
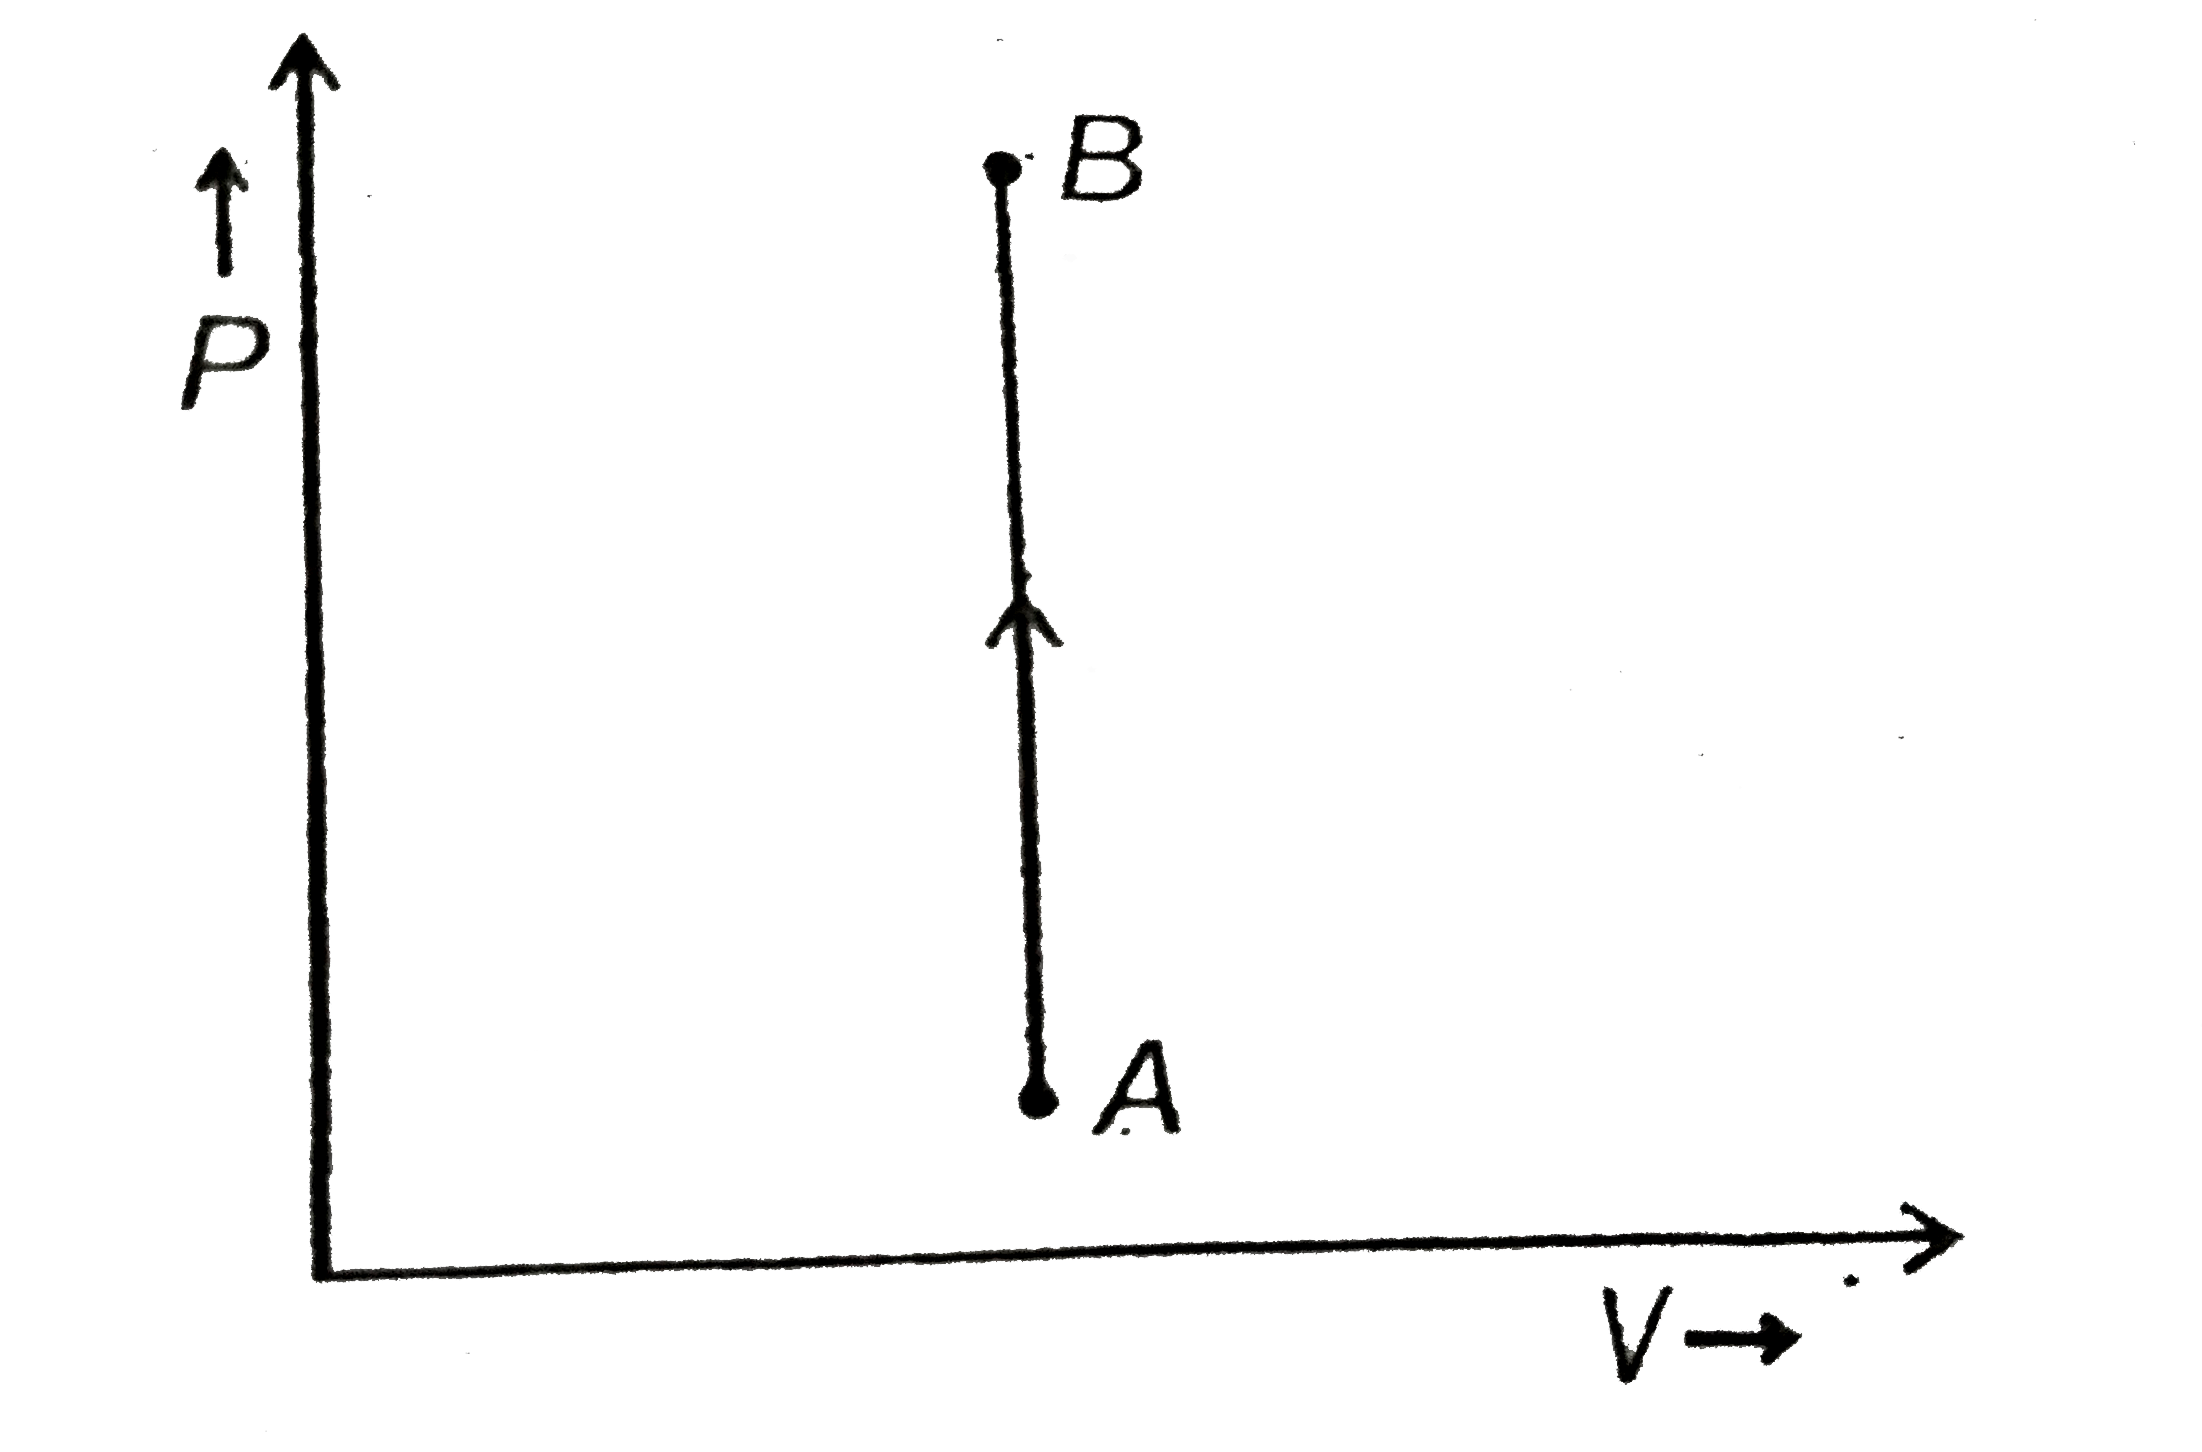
View SolutionAccording to Arrhenius equation rate constant K is equal to A e.−Ea/RT . Which of the following options represents the graph of ln K vs 1T?
View SolutionAccording to Arrhenius equation rate constant K is equal to A e.−Ea/RT . Which of the following options represents the graph of ln K vs 1T?
View Solution
