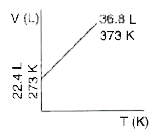
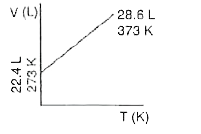
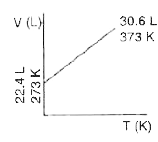
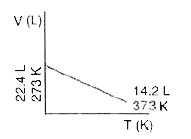
Which one of the following volume (V)- temperature (T) plots represents the behaviour of one mole of an ideal gas at one atmosphere?
The correct Answer is:C
To solve the problem of determining which volume (V) - temperature (T) plot represents the behavior of one mole of an ideal gas at one atmosphere, we can follow these steps:
Step 1: Understand the Ideal Gas Law
The ideal gas law is given by the equation:
PV=nRT
Where:
- P = pressure (in atm)
- V = volume (in liters)
- n = number of moles
- R = ideal gas constant
- T = temperature (in Kelvin)
Step 2: Substitute Known Values
In this case, we have:
- n=1 mole
- P=1 atm
- R=0.0821L atm K−1mol−1
- We need to find V at a specific temperature.
Step 3: Rearrange the Ideal Gas Law
Rearranging the ideal gas law to solve for volume V:
V=nRTP
Step 4: Calculate Volume at a Given Temperature
Assuming we want to find the volume at a temperature of T=373 K:
V=(1mol)(0.0821L atm K−1mol−1)(373K)1atm
Step 5: Perform the Calculation
Calculating the volume:
V=(1)(0.0821)(373)1
V=30.58L
This can be approximated to:
V≈30.6L
Step 6: Analyze the Graphs
Now, we need to check the given volume-temperature plots to find which one corresponds to V=30.6L at T=373K.
Step 7: Identify the Correct Plot
Look for the plot that shows a point at (373K,30.6L). The correct graph will show this specific volume at the specified temperature.
Conclusion
The plot that correctly represents the behavior of one mole of an ideal gas at one atmosphere, with the calculated volume of approximately 30.6 liters at 373 Kelvin, is the answer.
---
The ideal gas law is given by the equation:
PV=nRT
Where:
- P = pressure (in atm)
- V = volume (in liters)
- n = number of moles
- R = ideal gas constant
- T = temperature (in Kelvin)
In this case, we have:
- n=1 mole
- P=1 atm
- R=0.0821L atm K−1mol−1
- We need to find V at a specific temperature.
Rearranging the ideal gas law to solve for volume V:
V=nRTP
Assuming we want to find the volume at a temperature of T=373 K:
V=(1mol)(0.0821L atm K−1mol−1)(373K)1atm
Calculating the volume:
V=(1)(0.0821)(373)1
V=30.58L
This can be approximated to:
V≈30.6L
Now, we need to check the given volume-temperature plots to find which one corresponds to V=30.6L at T=373K.
Look for the plot that shows a point at (373K,30.6L). The correct graph will show this specific volume at the specified temperature.
The plot that correctly represents the behavior of one mole of an ideal gas at one atmosphere, with the calculated volume of approximately 30.6 liters at 373 Kelvin, is the answer.
Topper's Solved these Questions
- STATES OF MATTER : GASES AND LIQUIDSBook:MODERN PUBLICATIONChapter:STATES OF MATTER : GASES AND LIQUIDSExercise:COMPETITION FILE OBJECTIVE TYPE QUESTIONS (B. MULTIPLE CHOICE QUESTIONS)(JEE (ADVANCED) FOR IIT ENTRANCE)
Explore 8 Videos
- STATES OF MATTER : GASES AND LIQUIDSBook:MODERN PUBLICATIONChapter:STATES OF MATTER : GASES AND LIQUIDSExercise:COMPETITION FILE OBJECTIVE TYPE QUESTIONS (C. MULTIPLE CHOICE QUESTIONS)
Explore 10 Videos
- STATES OF MATTER : GASES AND LIQUIDSBook:MODERN PUBLICATIONChapter:STATES OF MATTER : GASES AND LIQUIDSExercise:COMPETITION FILE OBJECTIVE TYPE QUESTIONS (B. MULTIPLE CHOICE QUESTIONS)
Explore 32 Videos
- SOME BASIC CONCEPTS OF CHEMISTRY Book:MODERN PUBLICATIONChapter:SOME BASIC CONCEPTS OF CHEMISTRY Exercise:COMPETITION FILE (INTEGER TYPE AND NUMERICAL VALUE TYPE QUESTIONS)
Explore 10 Videos
- STRUCTURE OF ATOMBook:MODERN PUBLICATIONChapter:STRUCTURE OF ATOMExercise:Unit Practice Test
Explore 13 Videos
Similar Questions
Knowledge Check
Which of the following volume (V) - temperature (T) plots represents the behaviour of one mole of an ideal gas at one atmospheric pressure?
A B
B C
C D
D
Which one of the following volume (V)- temperature (T) plots represents the behaviour of one mole of an ideal gas at one atmosphere?
A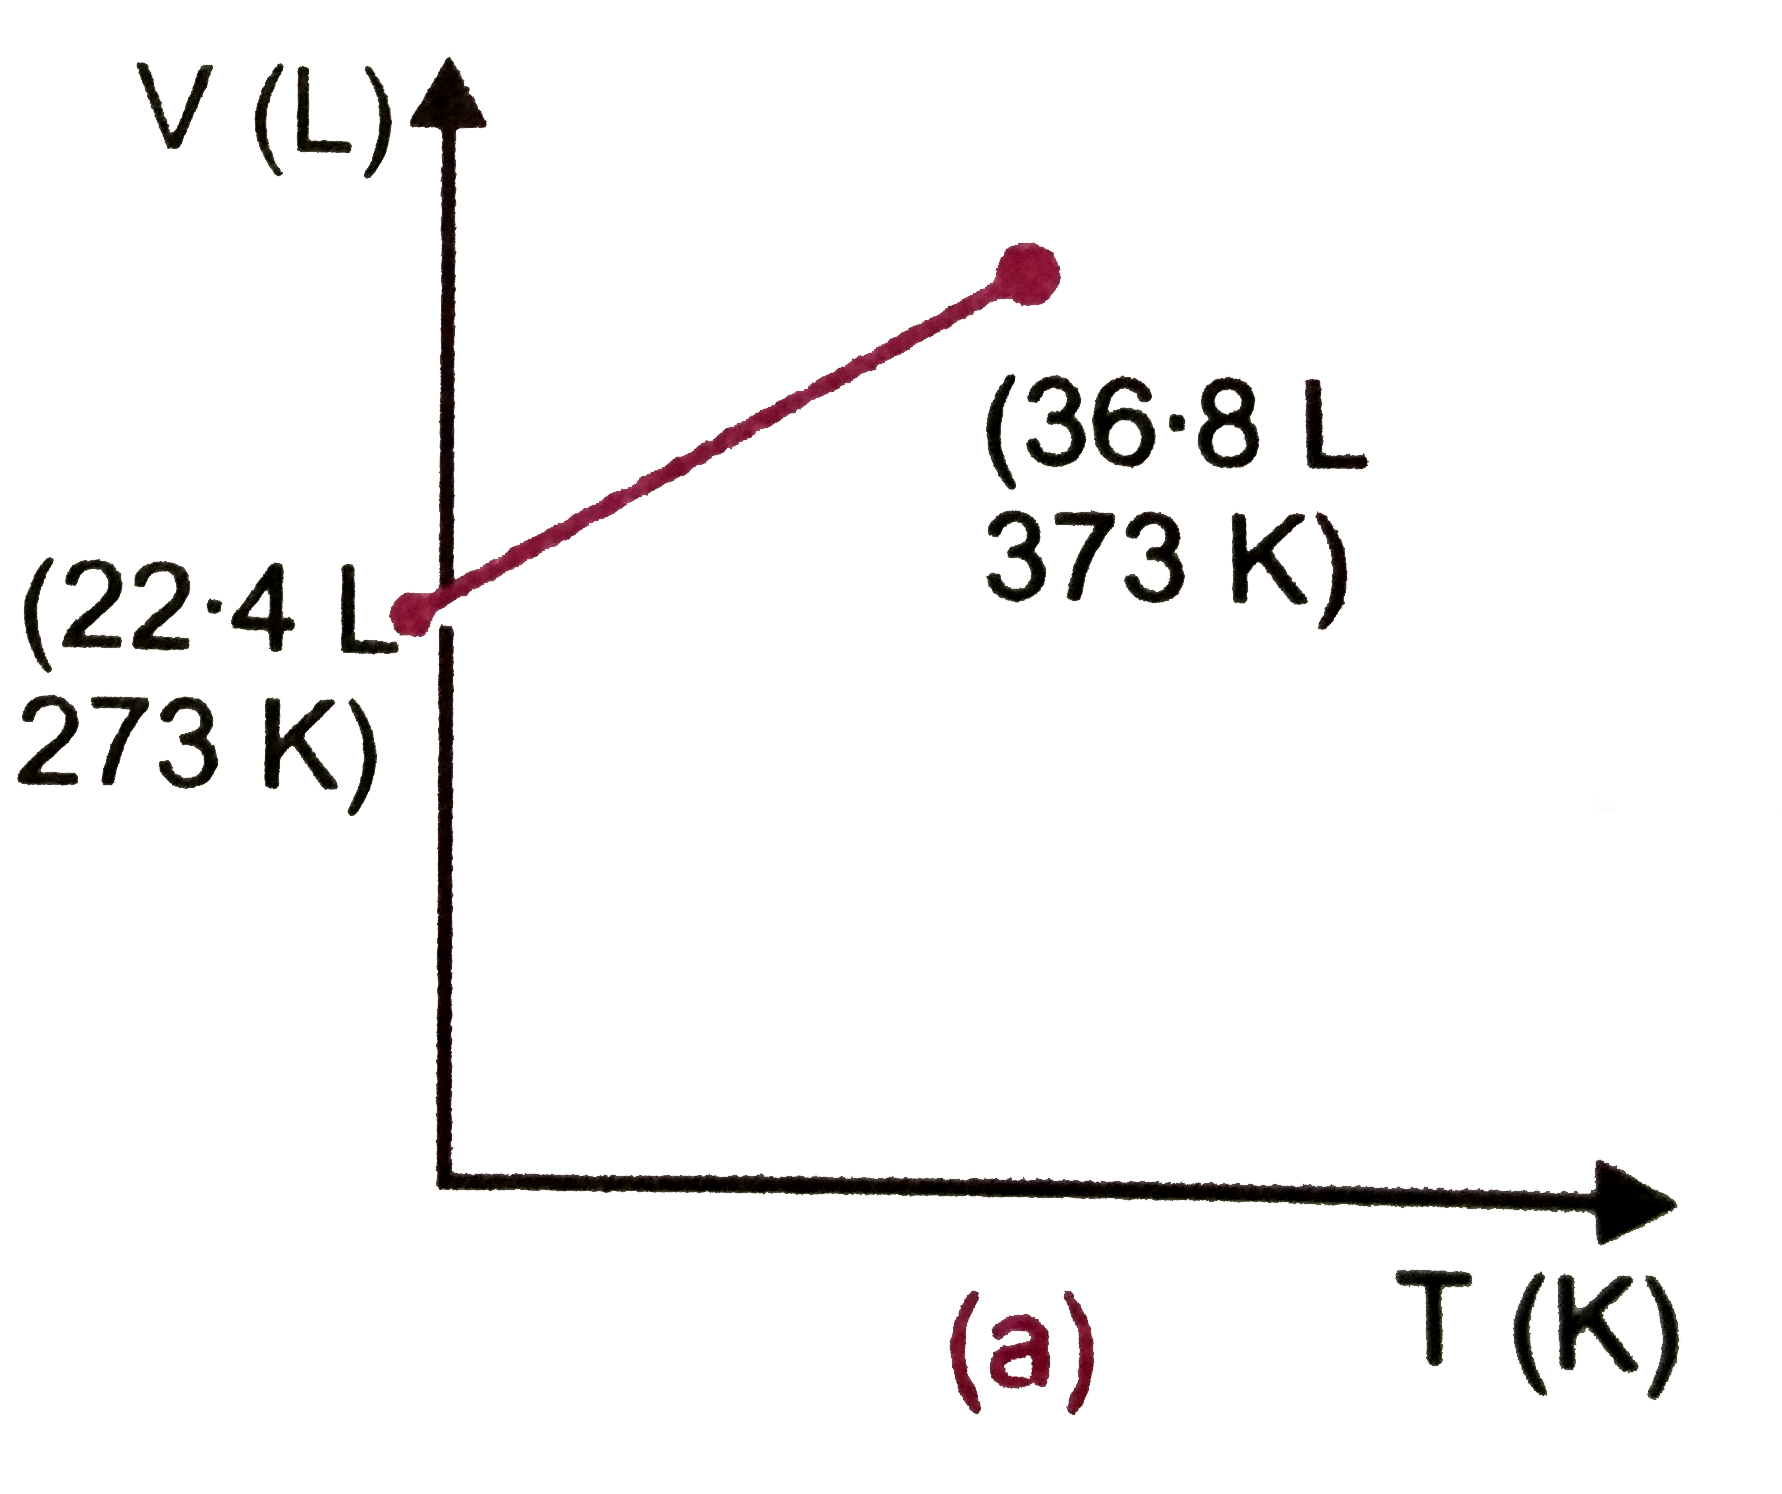 B
B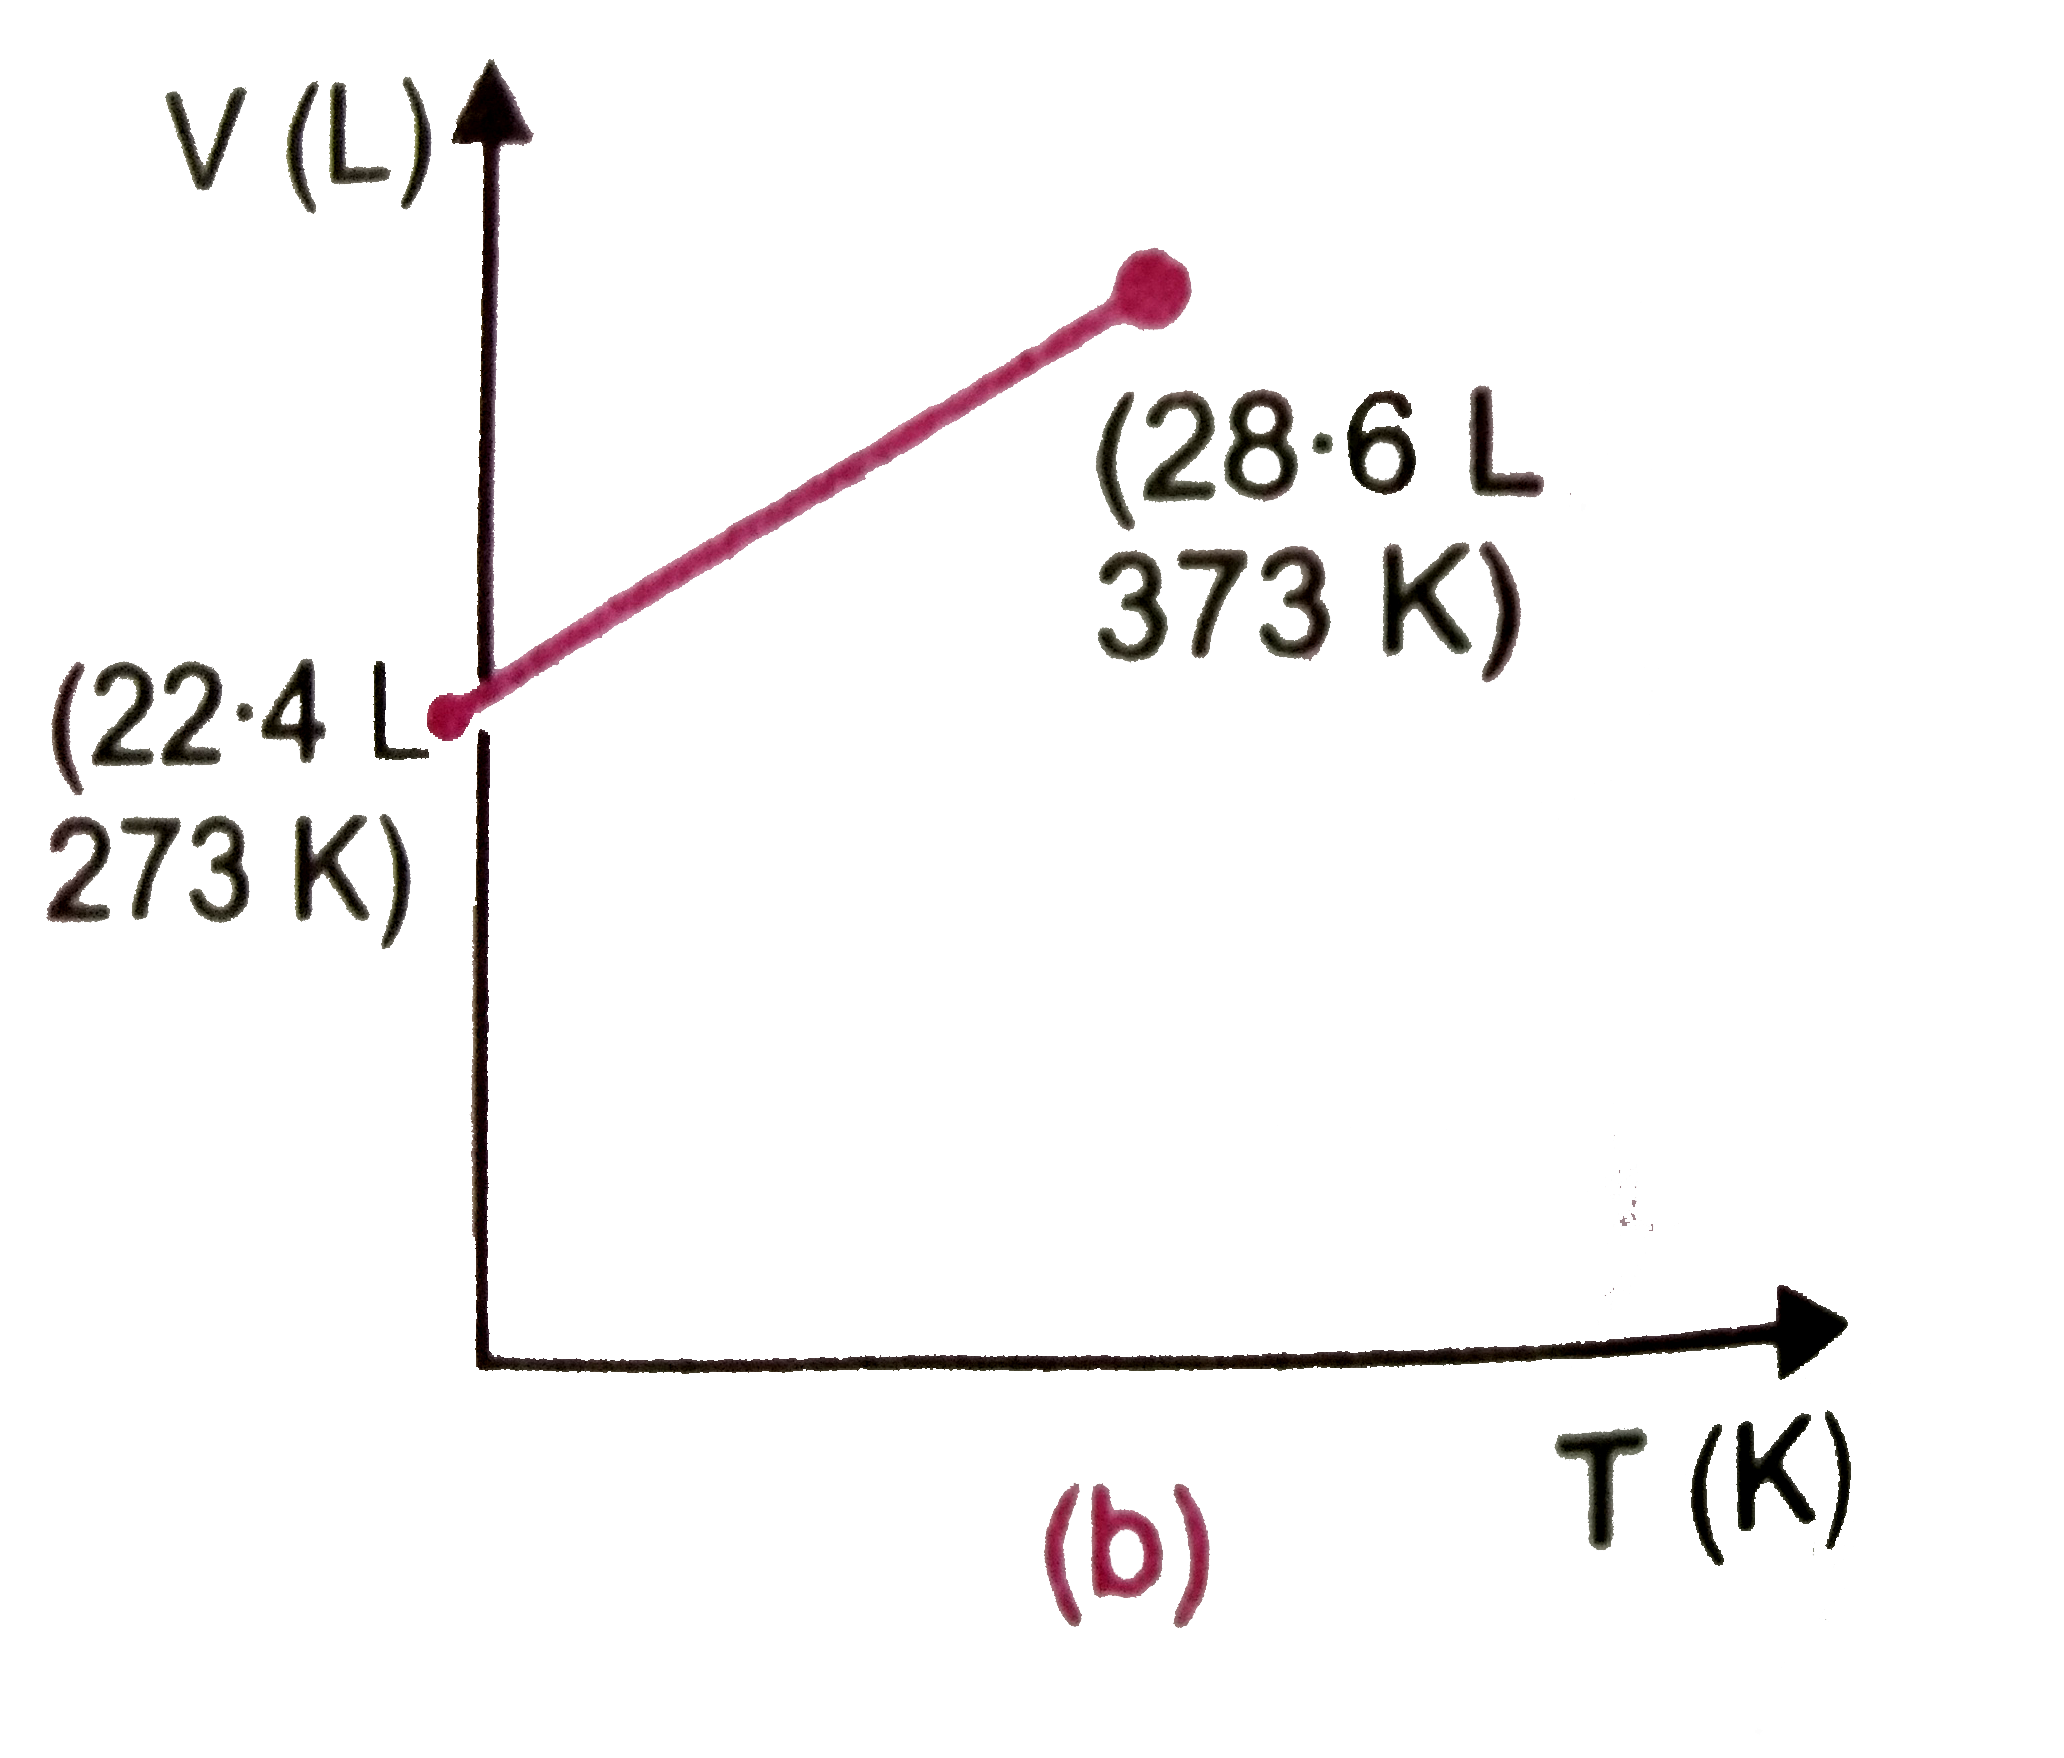 C
C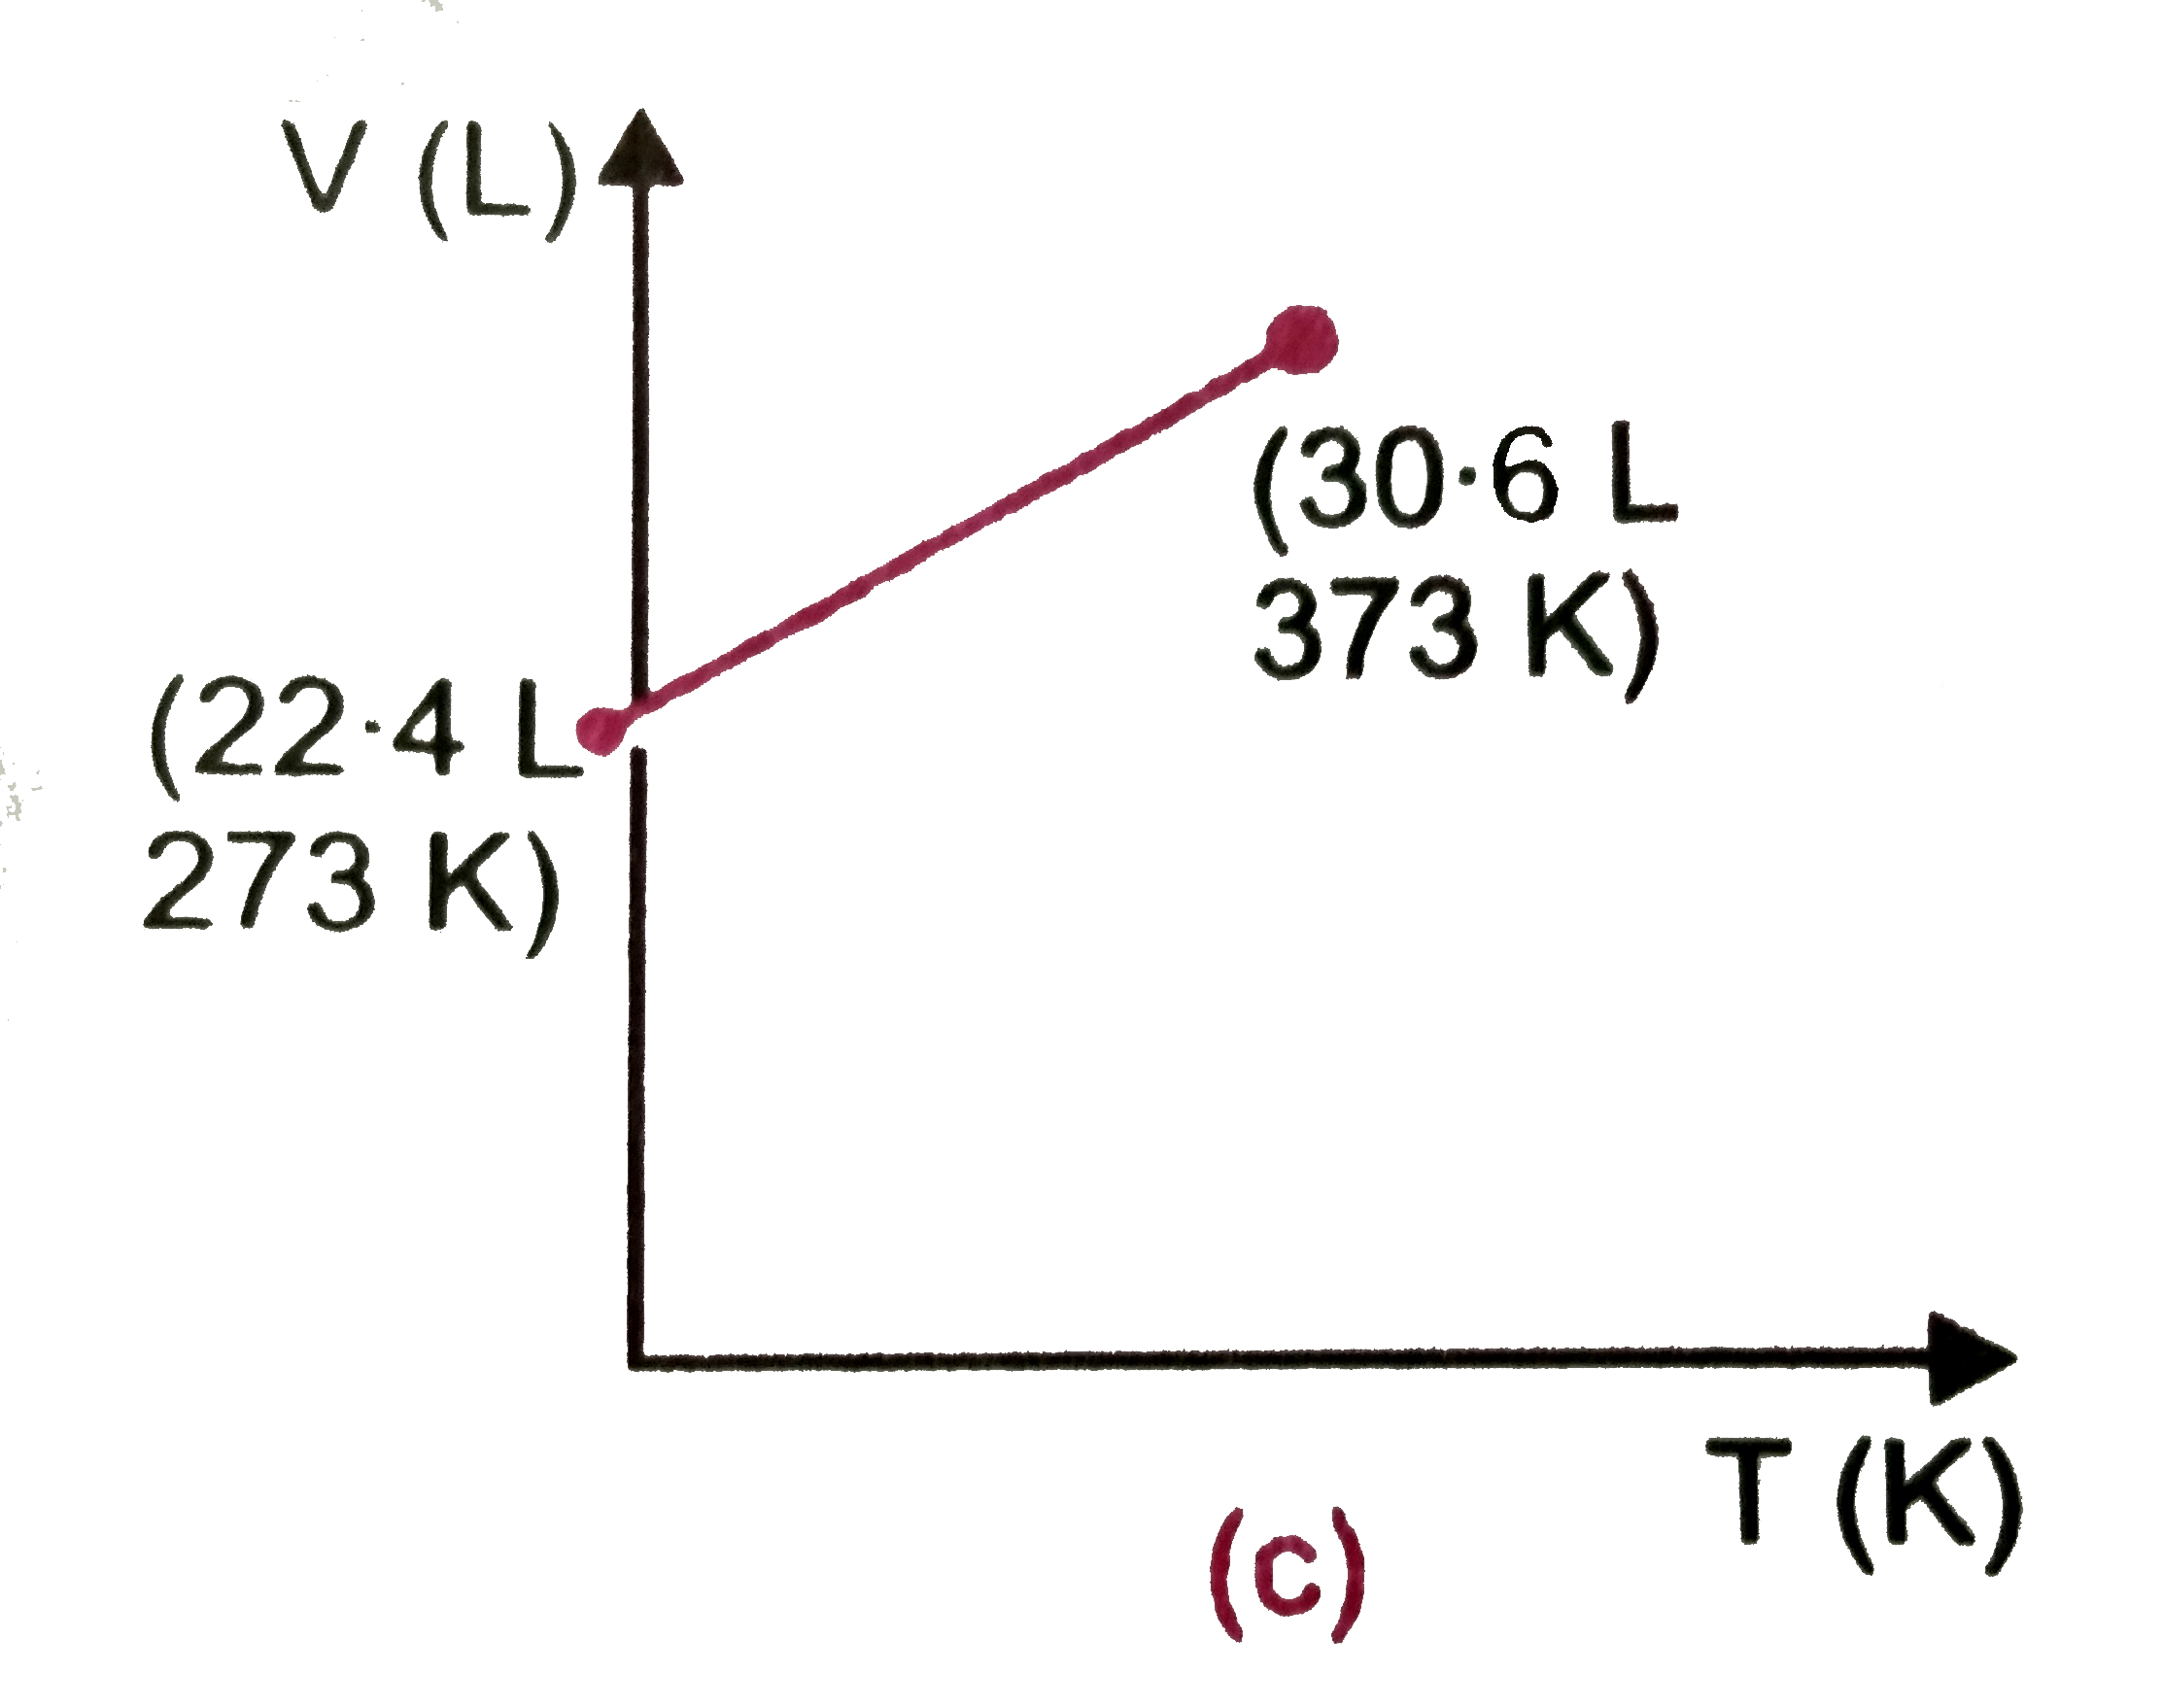 D
D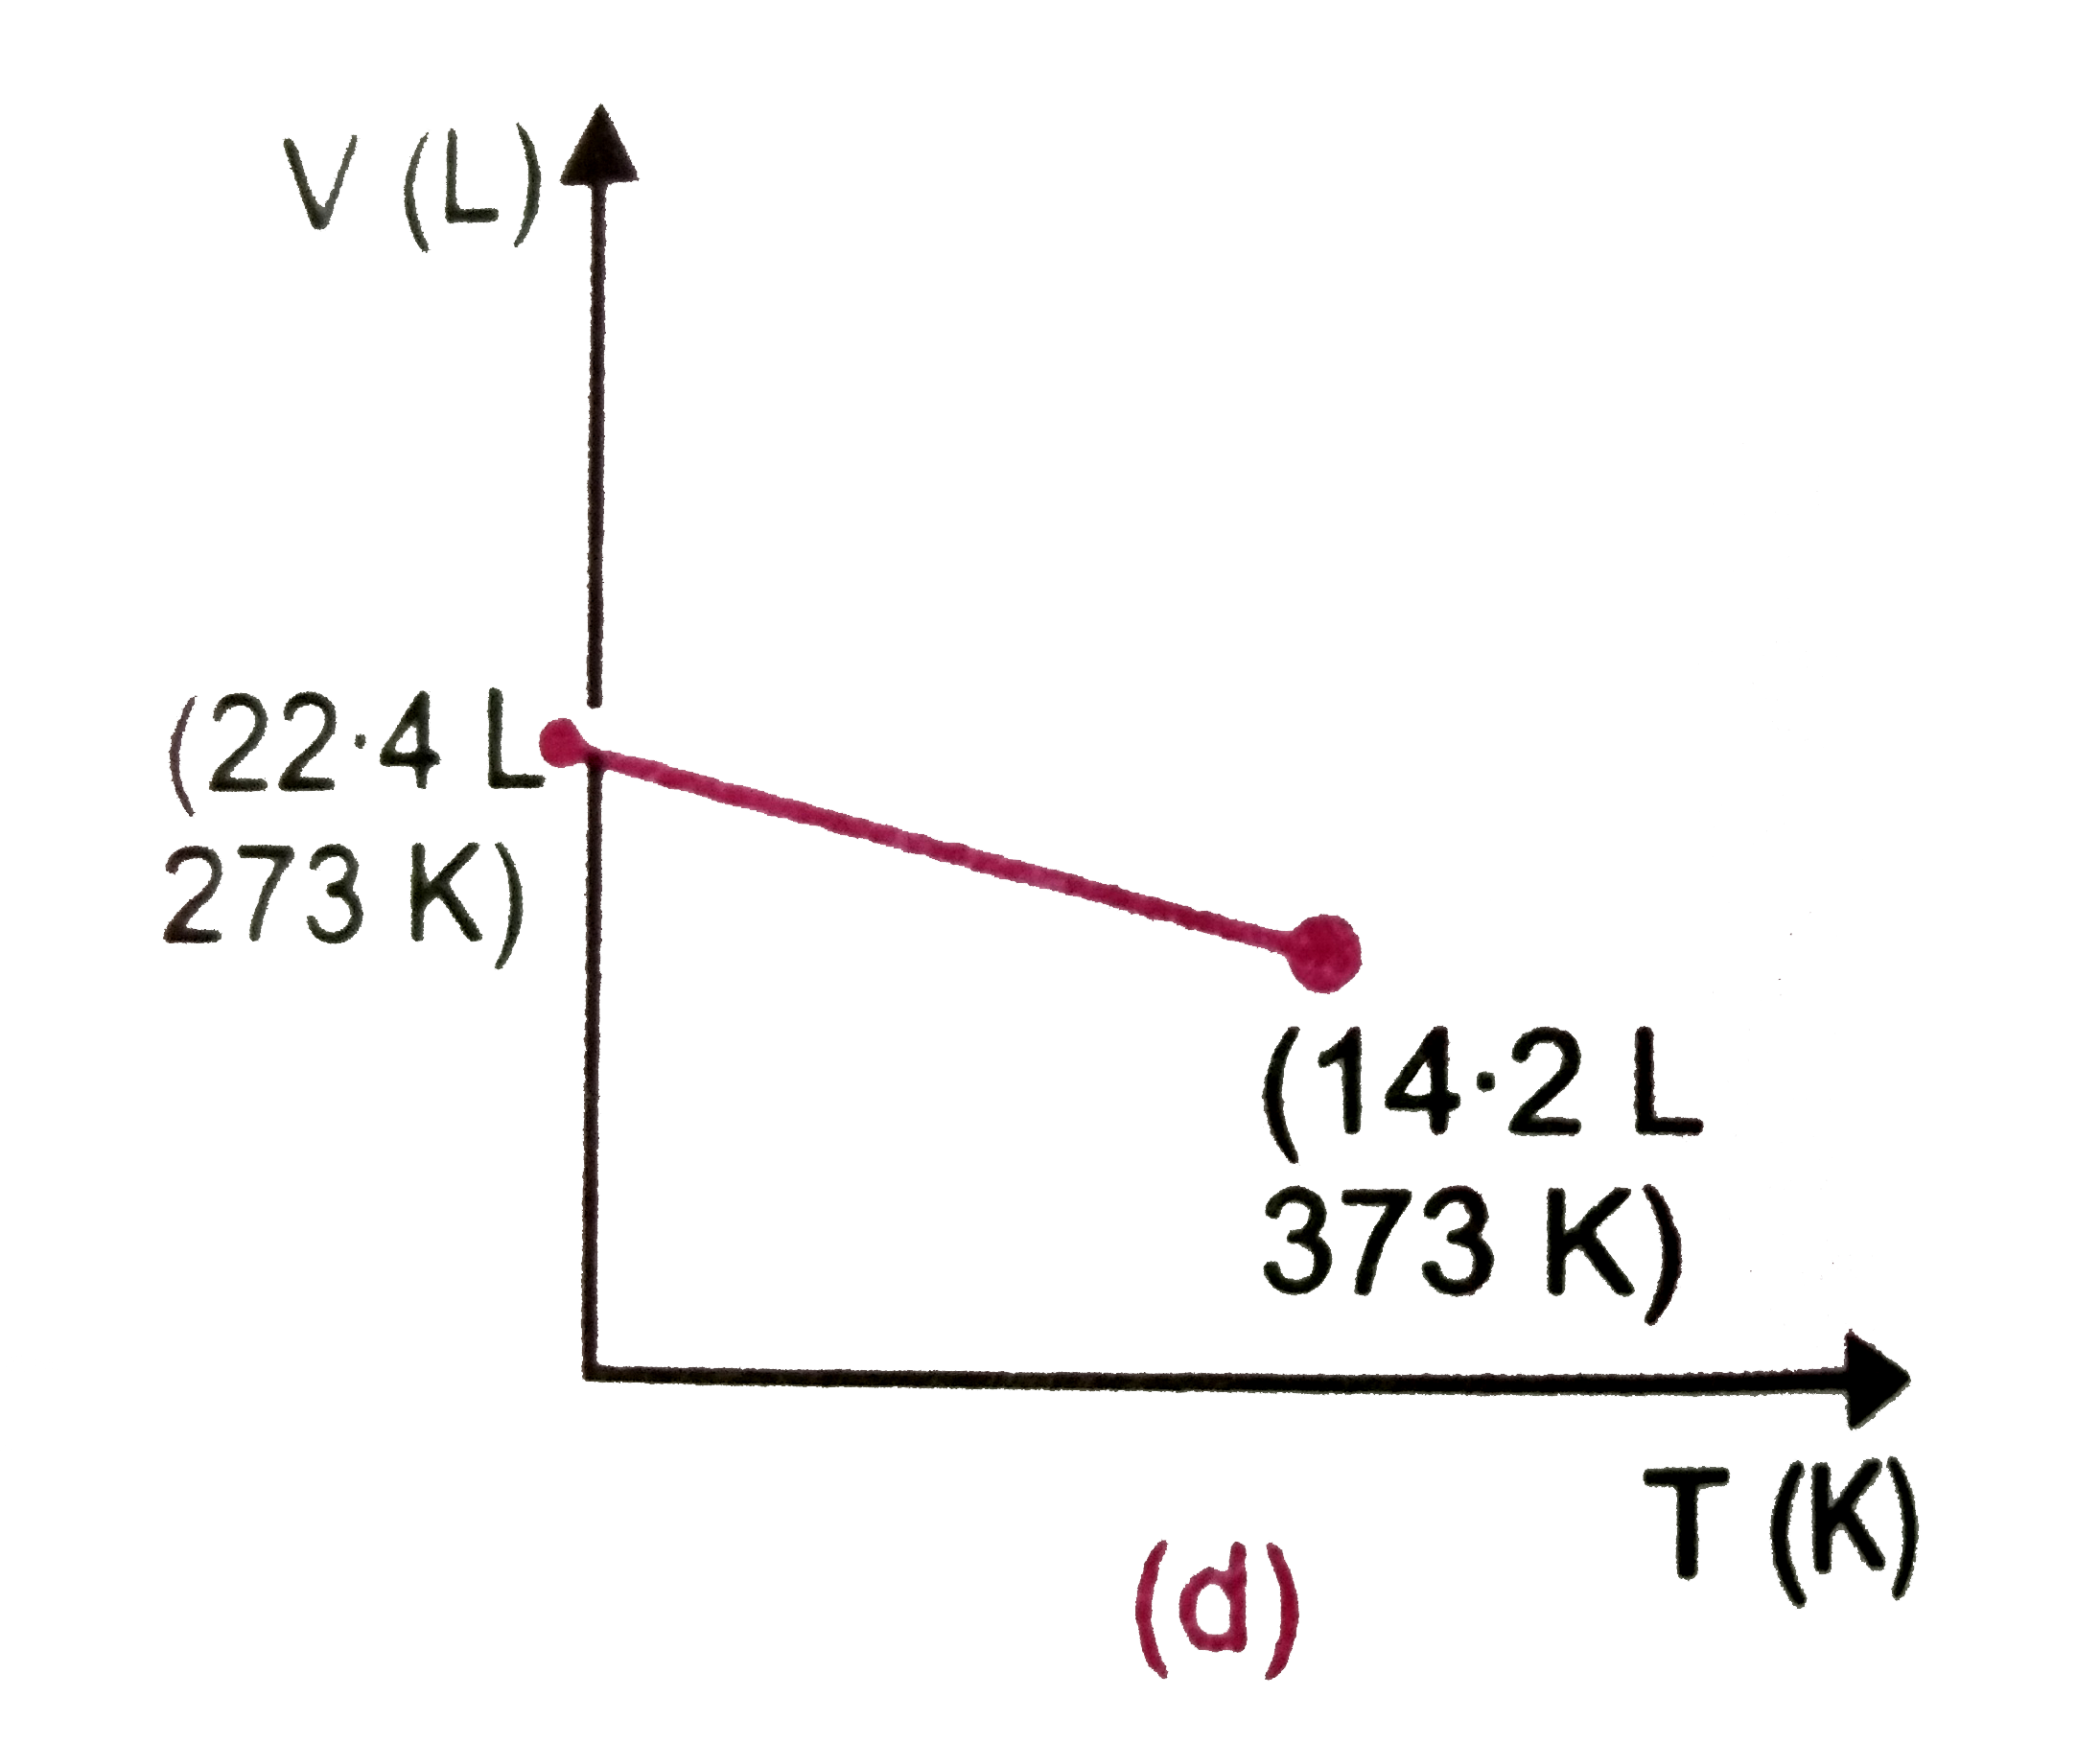
Which of the following volume (V) temperature (T) plots represents the behaviour of one mole of an ideal gas at one atmospheric pressure:
A B
B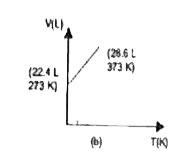 C
C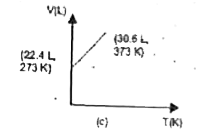 D
D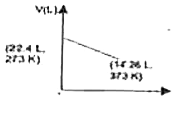
Which of the following volume (V)-temperature (T) plots represents the behaviour of one mole of an ideal gas at one atmoshperic pressure?
View SolutionWhich of the following volume-temperature (V−I) plots represents the behaviour of 1mole of an ideal gas at the atmospheric pressure?
View SolutionWhich of the following volume-temperature (V−I) plots represents the behaviour of 1mole of an ideal gas at the atmospheric pressure?
View SolutionThe K.E. of one mole of an ideal gas is
View SolutionWhich of the following graphs represent the behaviour of an ideal gas ?
View Solution

