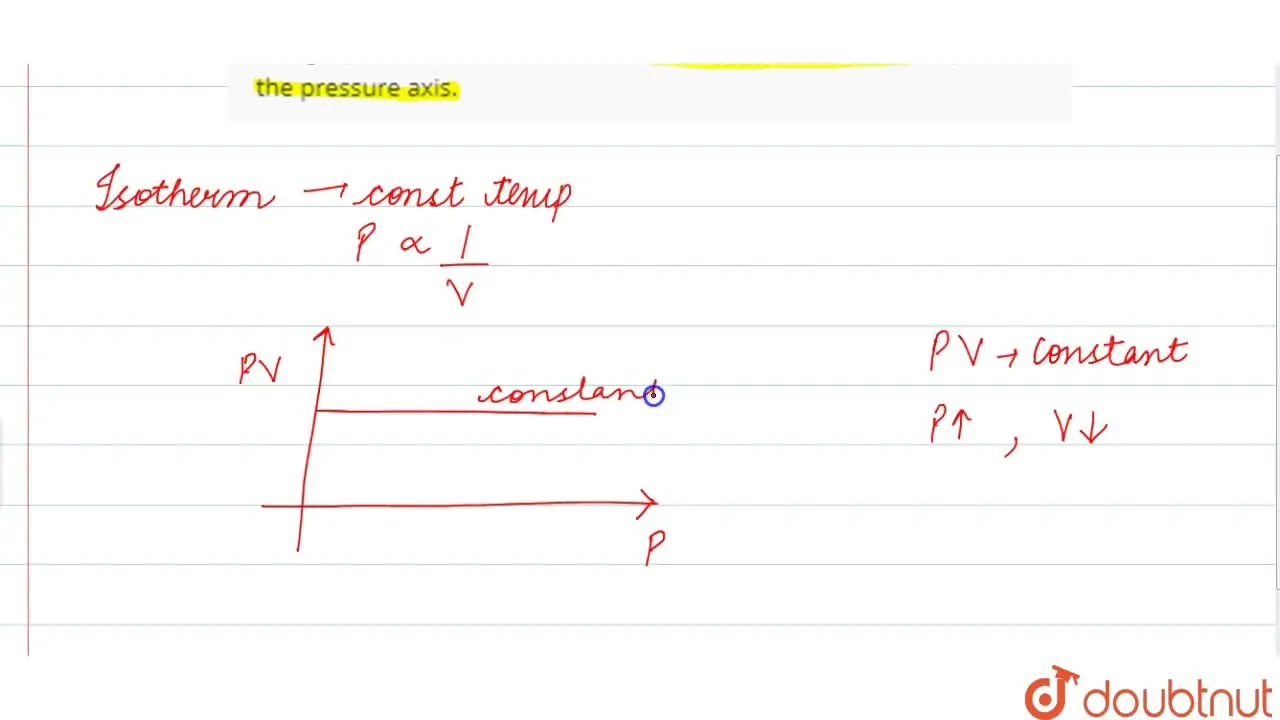
The graph between PV vs P at constant temperature is linear parallel to the pressure axis.
1
Related Playlists
- BOOK - MODERN PUBLICATIONCHAPTER - STATES OF MATTER : GASES AND LIQUIDSEXERCISE - Revision Exercises (Objective Questions)(Fill in the blanks Questions)10videos
STATES OF MATTER : GASES AND LIQUIDS
- BOOK - MODERN PUBLICATIONCHAPTER - STATES OF MATTER : GASES AND LIQUIDSEXERCISE - Revision Exercises (Objective Questions)(Assertion Reason Questions)10videos
STATES OF MATTER : GASES AND LIQUIDS
- BOOK - MODERN PUBLICATIONCHAPTER - STATES OF MATTER : GASES AND LIQUIDSEXERCISE - Revision Exercises (Objective Questions)(Passage Based Questions)10videos
STATES OF MATTER : GASES AND LIQUIDS
- BOOK - MODERN PUBLICATIONCHAPTER - SOME BASIC CONCEPTS OF CHEMISTRY EXERCISE - COMPETITION FILE (INTEGER TYPE AND NUMERICAL VALUE TYPE QUESTIONS)10videos
SOME BASIC CONCEPTS OF CHEMISTRY
- BOOK - MODERN PUBLICATIONCHAPTER - STRUCTURE OF ATOMEXERCISE - Unit Practice Test13videos
STRUCTURE OF ATOM
Similar Questions
Graph between p and V at constant temperature is
View SolutionGraph between p and V at constant temperature is
View SolutionSlop between pV and p at constant temperature is
View SolutionThe slope of the plot between pV and p at constant temperature is
View SolutionThe slope of the plot between pV and p at constant temperature is
View SolutionGraph between P & V below critical temperature is
View SolutionThe slope of the plot between pV and p at constant temperature is
View SolutionThe slope of the graph between log P and log V at constant temperature for a given mass of gas is
View SolutionThe plot of PV vs P at particular temperature is called isovbar.
View SolutionThe curve between adsorption and pressure at constant temperature is called as
View Solution


