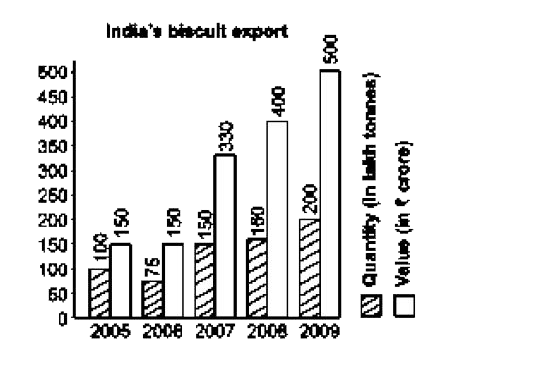
In which two years, was the value per ton equal?

2006 and 2007
2005 and 2006
2008 and 2009
2007 and 2008
The correct Answer is:C
Step by step video, text & image solution for In which two years, was the value per ton equal? by Maths experts to help you in doubts & scoring excellent marks in Class 14 exams.
Updated on:21/07/2023Topper's Solved these Questions
- BAR CHARTBOOK - ARIHANT SSCCHAPTER - BAR CHARTEXERCISE - Higher Skill Level Questions
20 Videos
- BAR CHARTBOOK - ARIHANT SSCCHAPTER - BAR CHARTEXERCISE - Higher Skill Level Questions
20 Videos
- AVERAGESBOOK - ARIHANT SSCCHAPTER - AVERAGESEXERCISE - Final Round
27 Videos
- BOATS AND STREAMS BOOK - ARIHANT SSCCHAPTER - BOATS AND STREAMS EXERCISE - EXERCISE HIGHER SKILL LEVEL QUESTIONS
9 Videos
Similar Questions
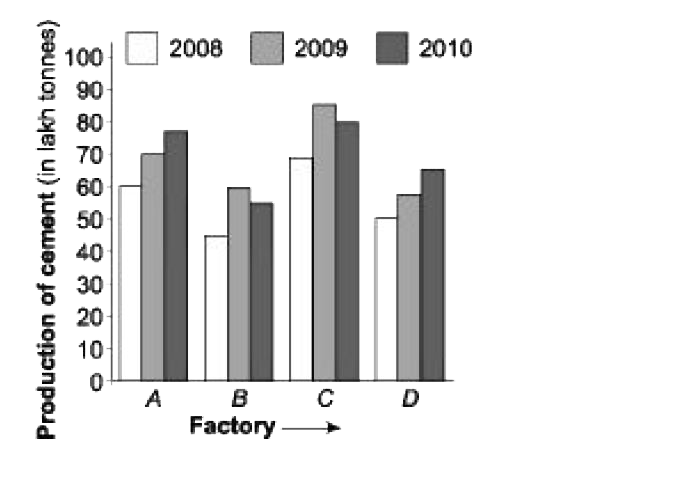
The percentage increase in production of cement by factor B from 2008 to 2009 is about

View SolutionThe percentage increase in production of cement by factor B from 2008 to 2009 is about

View SolutionThere are 3 sets of natural numbers 1 ot 100. Set A contains all the natural numbers which are prime, upto 100. Set B contains all the non-prime even natural numbers upto 100. Set C contains all the non-prime odd natural numbers upto 100 i.e.,
A = {2,3,5,7,11,...89, 97}
B = {4,6,8,10,12,...98,100}
C = {1,9,15,21,25,27,33,95,99}
The average of the elements of the Set A and C combined as :
View SolutionA boat running upstream takes 528 min to cover a certain distance, while it takes 240 min to cover the same distance running down stream.What is the ratio between the speed of the boat and speed of the water current, respectively?
View SolutionHow many lines of symmetry does the above figure have ?
View SolutionWhich of the following are correct chain isomers of butane ? (i)
View SolutionDetermine the point of symmetry of a regular hexagon.
View SolutionDtermine the images of the following figure about the given line :
View SolutionMatch the following Column A to Column B

View SolutionMatch the following Column A to Column B

View SolutionMatch the following Column A to Column B

View SolutionThe inequation represented by the graph given below is :
View SolutionThe inequation that best describes the graph given below is _________
View SolutionThe inequation that best describes the following graph is _________
View SolutionWhich inequations represent the shaded region in the given figure
View SolutionIn Fig, find the value of x.
ltimg src="https://d10lpgp6xz60nq.cloudfront.net/physics_images/PS_MATH_IX_C12_S01_032_Q01.png" width="80%"gt
View Solution
