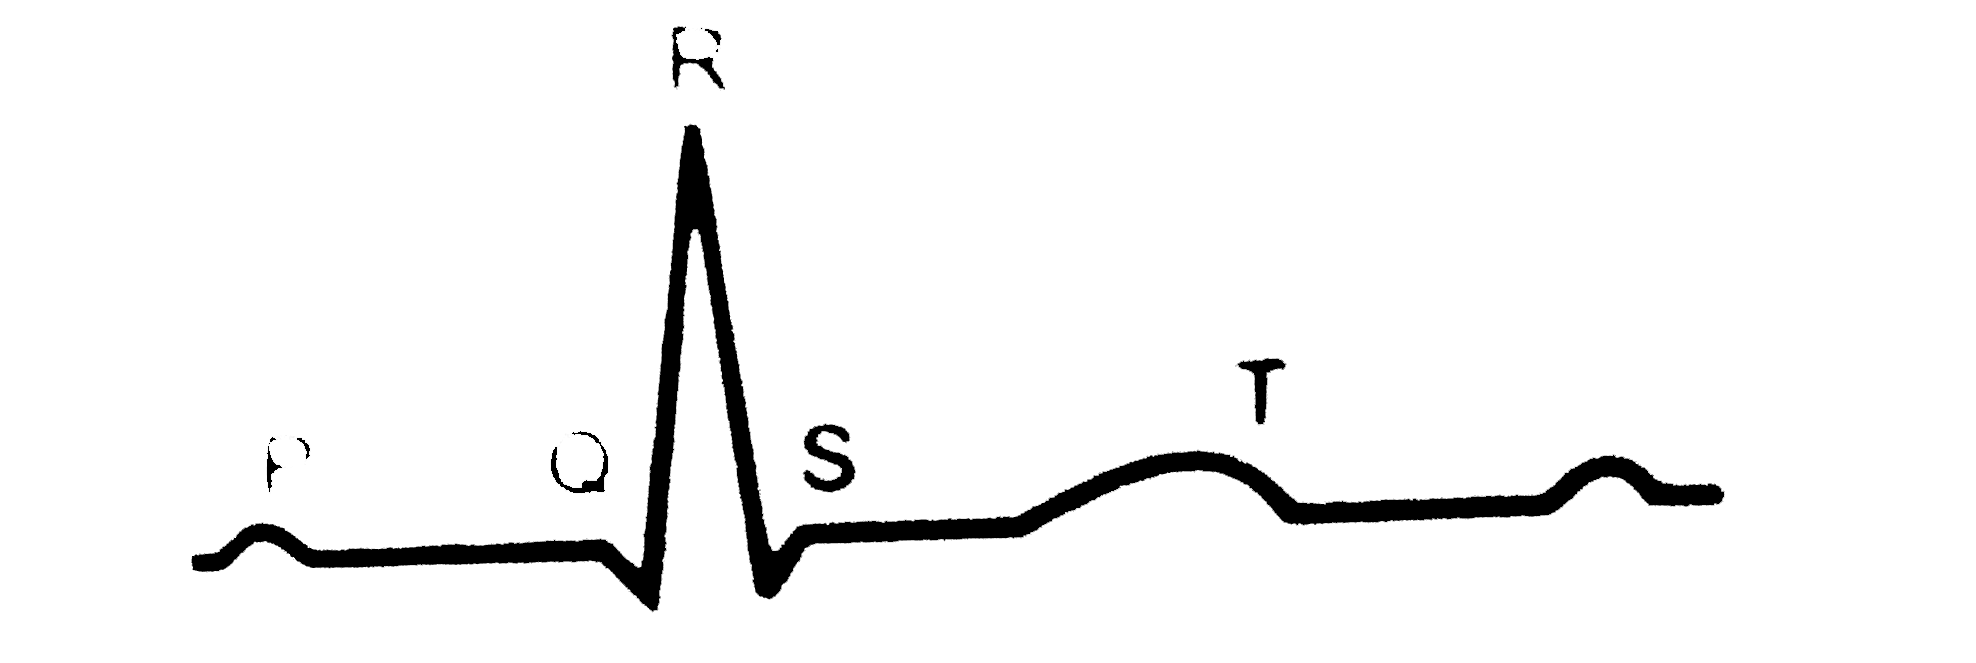
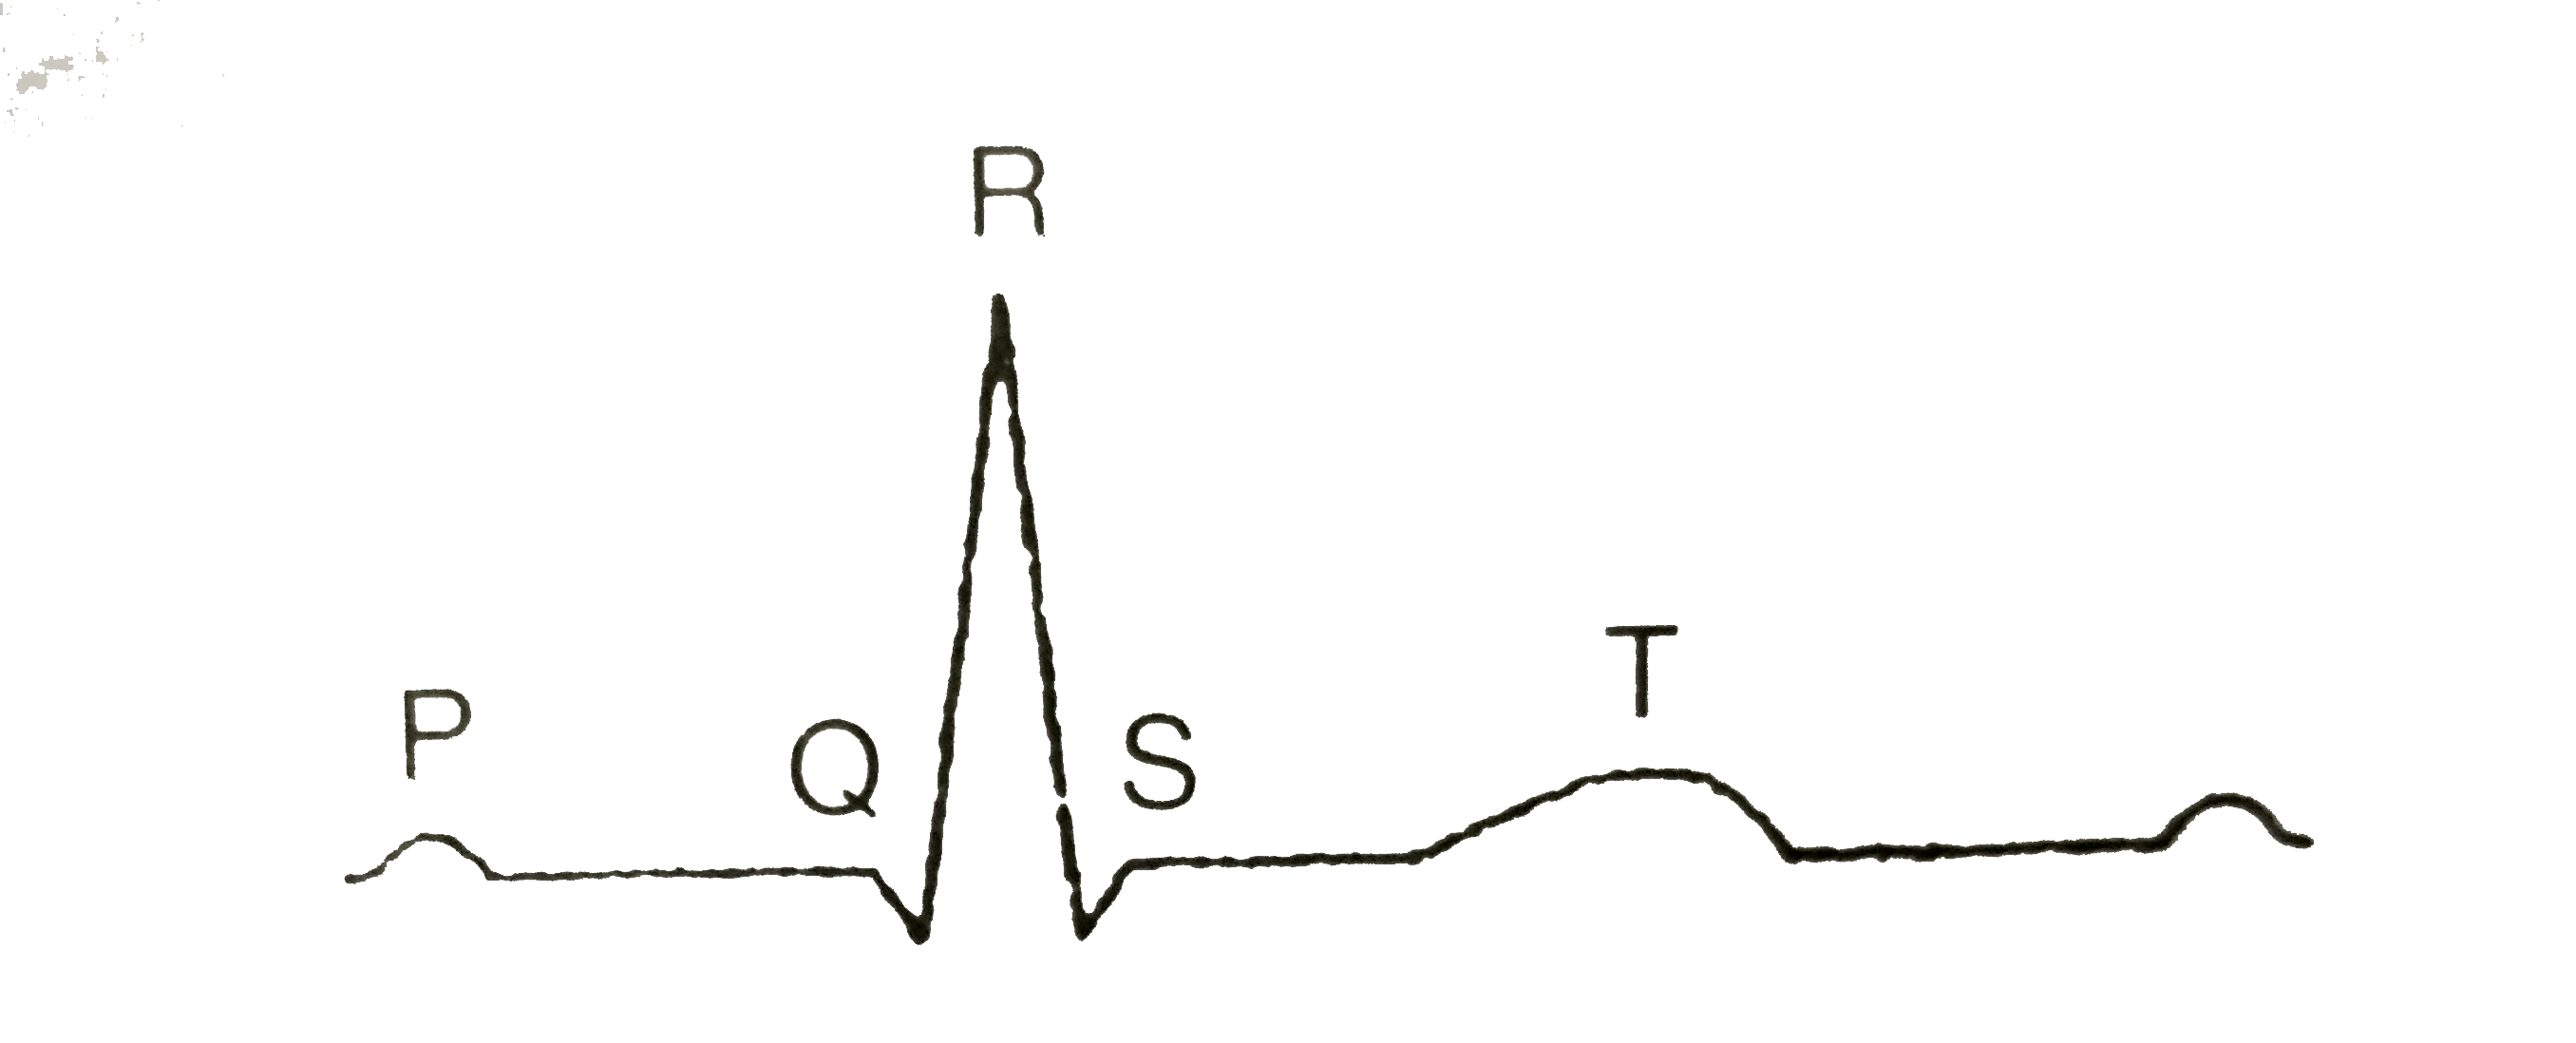
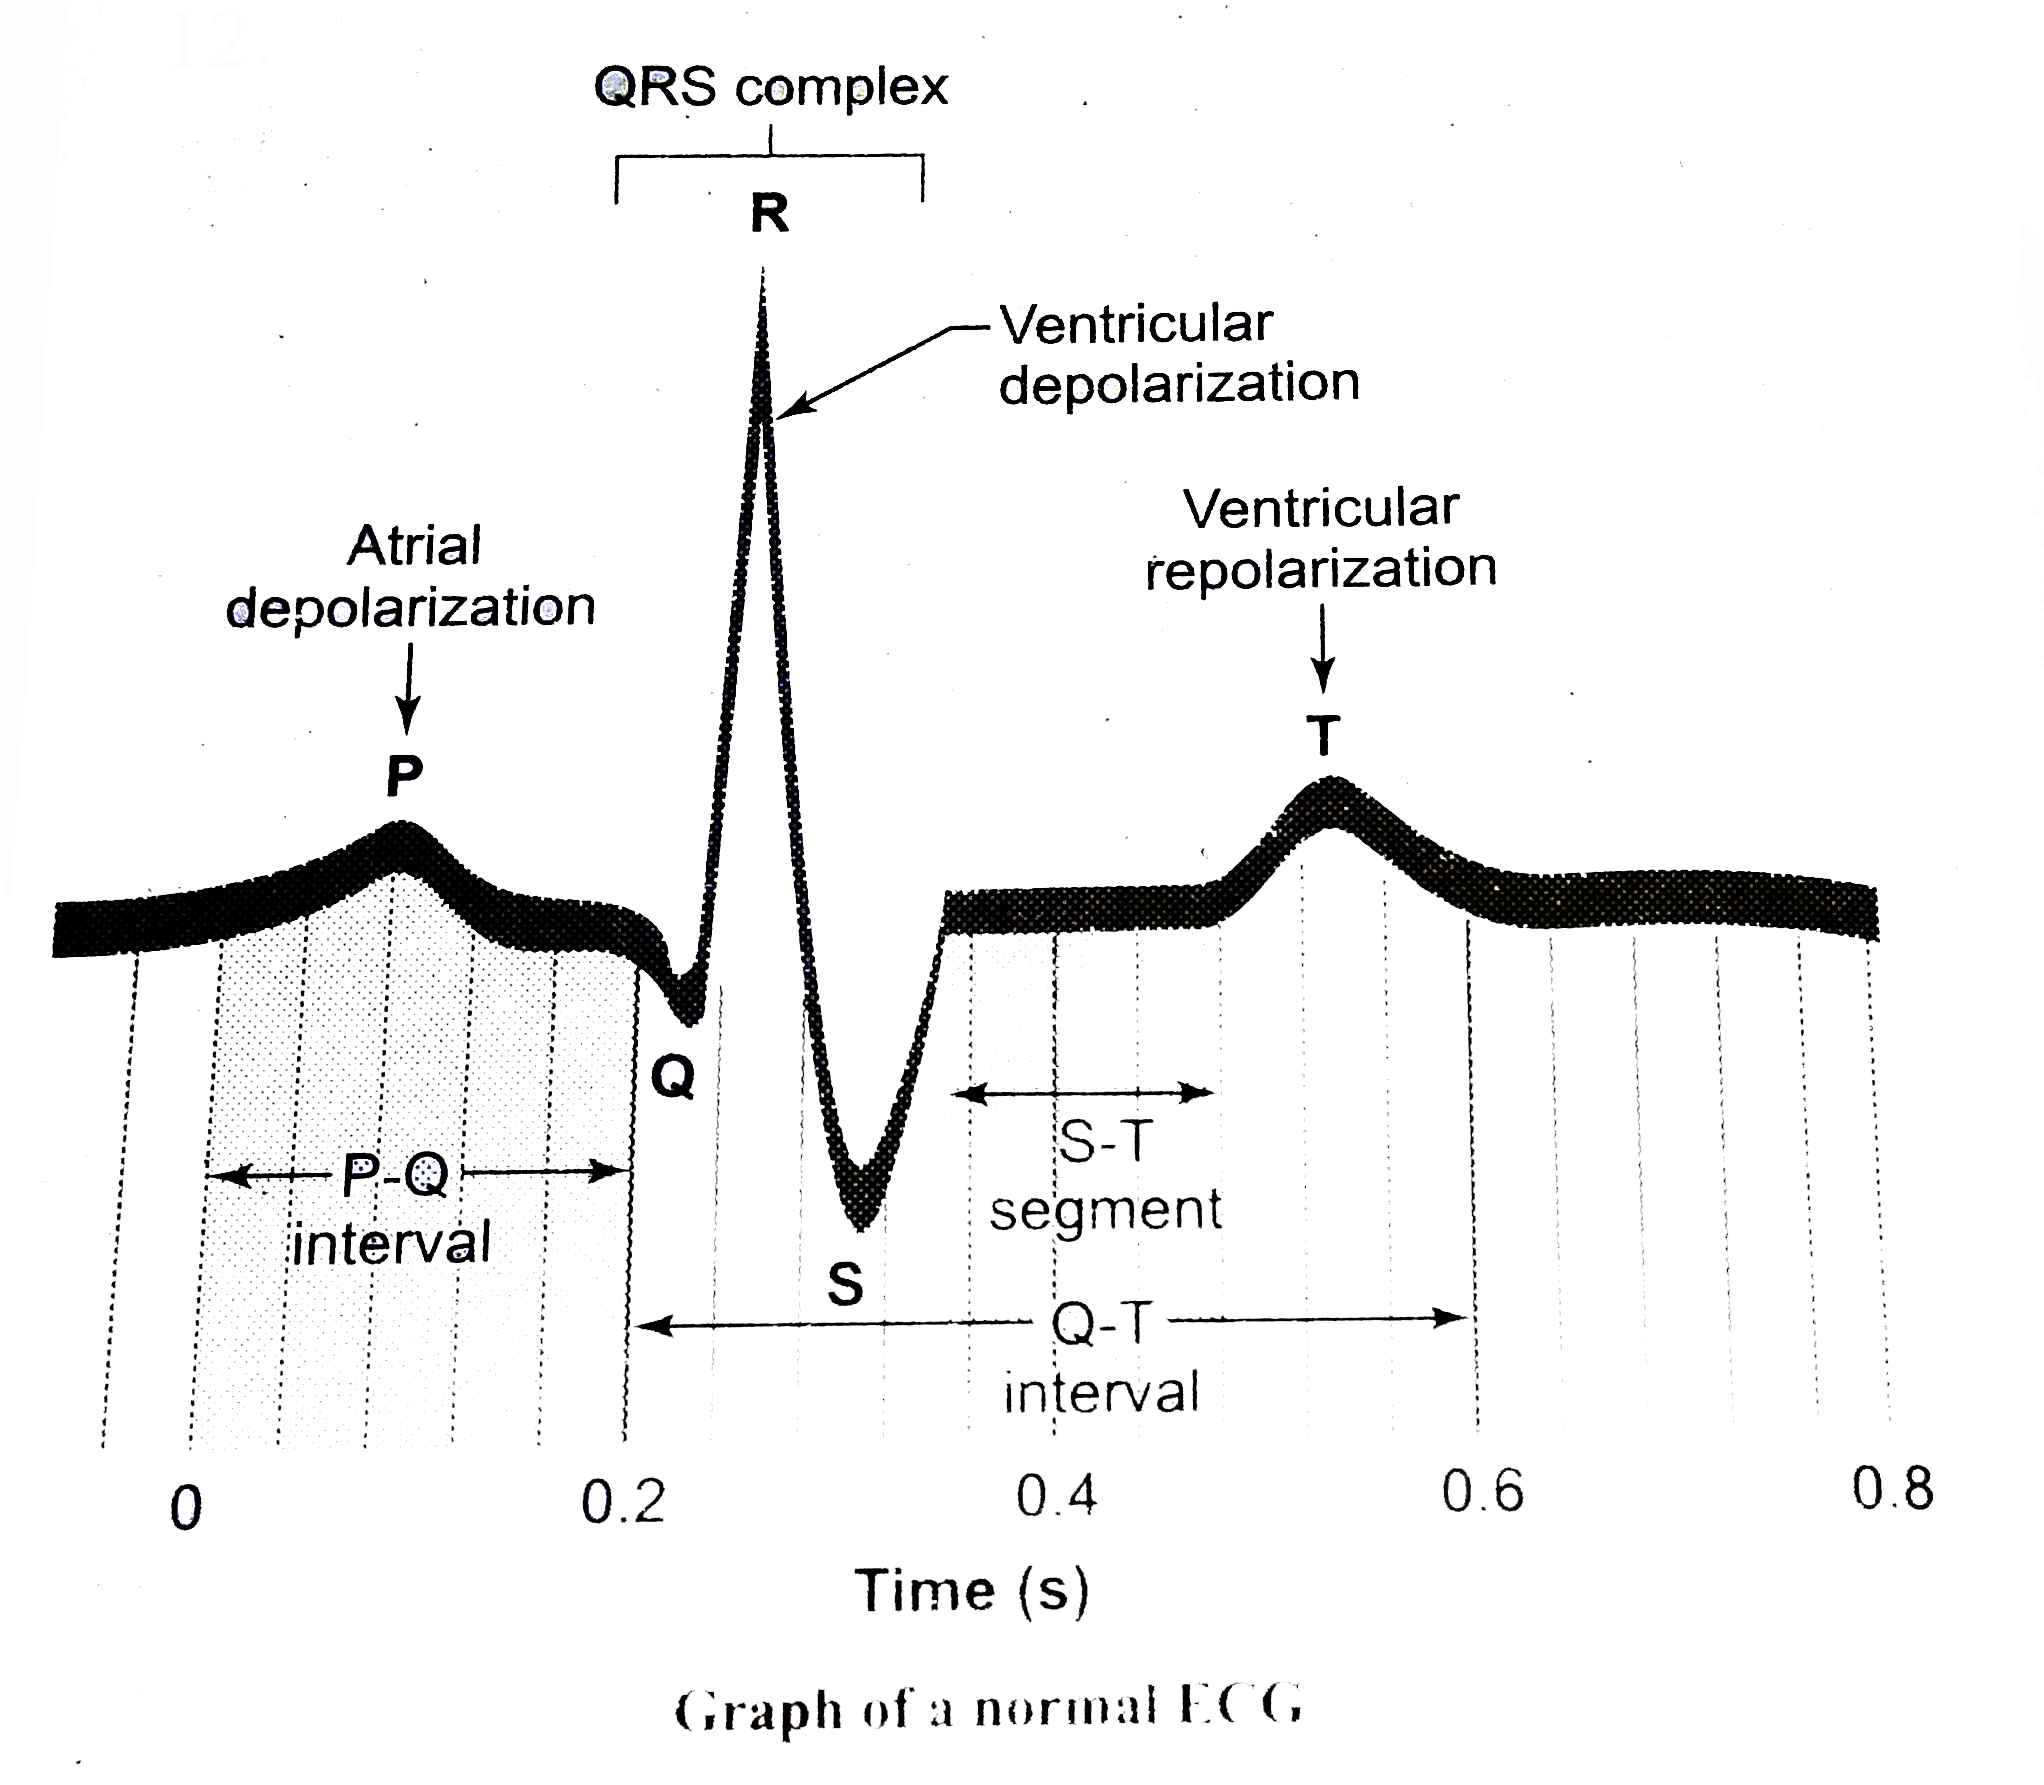
Draw the diagram of Graph of a normal ECG.Solution in Tamil
Topper's Solved these Questions
- SAMPLE PAPER - 15BOOK - FULL MARKSCHAPTER - SAMPLE PAPER - 15EXERCISE - Bio - Zoology (PART - III)
5 Videos
- SAMPLE PAPER - 15BOOK - FULL MARKSCHAPTER - SAMPLE PAPER - 15EXERCISE - Bio - Zoology (PART - IV)
4 Videos
- SAMPLE PAPER - 15BOOK - FULL MARKSCHAPTER - SAMPLE PAPER - 15EXERCISE - Bio - Zoology (PART - I)
8 Videos
- SAMPLE PAPER - 14BOOK - FULL MARKSCHAPTER - SAMPLE PAPER - 14EXERCISE - Bio - Zoology (PART - IV)
4 Videos
- SAMPLE PAPER - 16BOOK - FULL MARKSCHAPTER - SAMPLE PAPER - 16EXERCISE - Bio - Zoology (PART - IV)
4 Videos
Similar Questions
What are the advantages of bilateral synmmetrical animals?
View SolutionDraw the digestive system of frog and label the parts.
View SolutionWho coined the word Taxonomy?
View SolutionDraw the flowchart of classification of phylum Chordata.
View SolutionDescribe the excretory system of ''Periplaneta americana''.
View SolutionThe diagram given here is the standard ECG of a normal person. The P-wave represents the

View SolutionThe diagram given here is the standard ECG of a normal person, the P-wave represents the

View SolutionThe diagram given here is the standard ECG of a normal person.The P-wave represents the

View SolutionThe diagram given here is the standard ECG of a normal person. The P-wave represents the

View SolutionExplain the stage of Electrocadiogram ( ECG) graphs.
View SolutionThe diagram given here is the standard ECG of a normal person. The P-wave represents the :
View SolutionA normal ECG shows
View SolutionA normal ECG shows
View SolutionThe diagram given here is the standard ECG of a normal person. The P-wave represents the

View SolutionIn a normal ECG, ventricular depolarisation is represented by
View Solution

