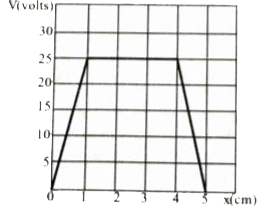
The following figure represents the electric potential as a function of x -coordinate Plot the corresponding electric field as a function of x.
 Solution in Tamil
In the given problem since the potential depends only on x we can use →E=−dVdx−ˆi
(the other two terms ∂V∂yand ∂V∂z are zero )
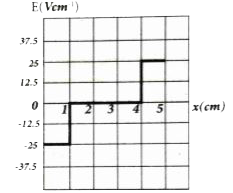
From 0 to 1 cm the slope is constant and so dVdx=25Vcm−1 . So →E=−25Vcm−1ˆi
From 1 to 4 cm the potential is constant V = 25 V . It implies that dVdx=0. So →E=0
From 4 to 5 cm the slope dVdx=−25Vcm−1
So →E=+25Vcm−1ˆi
The plot of electric field for the various points along the x axis is given below .
Topper's Solved these Questions
- ELECTROSTATICS BOOK - FULL MARKSCHAPTER - ELECTROSTATICS EXERCISE - Textual Evaluation Solved (Multiple choice questions : )
15 Videos
- ELECTROSTATICS BOOK - FULL MARKSCHAPTER - ELECTROSTATICS EXERCISE - Textual Evaluation Solved (II. Short Answer Questions : )
21 Videos
- DUAL NATURE OF RADIATION AND MATTERBOOK - FULL MARKSCHAPTER - DUAL NATURE OF RADIATION AND MATTEREXERCISE - ADDITIONAL QUESTIONS -( ADDITIONAL NUMERICAL PROBLEMS : )
10 Videos
- MAGNETISM AND MAGNETIC EFFECTS OF ELECTRIC CURRENT BOOK - FULL MARKSCHAPTER - MAGNETISM AND MAGNETIC EFFECTS OF ELECTRIC CURRENT EXERCISE - ADDITIONAL QUESTIONS SOLVED - NUMERICAL PROBLEMS :
4 Videos
Similar Questions
Two identical point charges'of magnitude -q are fixed as shown in the figure below. A third charge +q is placed midway between the two charges at the point P. Suppose this charge is displaced a small distance from the point P in the directions indicated by the arrows, in which direction(s) will +q be stable with respect to the displacement?

View SolutionWhat is meant by quantisation of charges ?
View SolutionIf a light of wavelength 4950 Å is viewed as a continuous flow of photons, what is the energy of each photon in eV ? (Given h=6.6×10⁻³⁴Js, c =3×10⁸ms−1)
View SolutionThe radius of the first orbit of hydrogen atom is 0.5 Å. The electron moves is an orbit with a uniform speed of 2.2×10⁶ms−1. What is the magnetic field produced at the centre of the uncleus due to the mation of this electron ? Use μ0=4π×10−7Hm−1 and electric charge =1.6×10⁻¹⁹ C
View SolutionFigure shows a plot of the conservative force F in a unidimensional field. The plot representing the function corresponding to the potential energy (U) in the field is
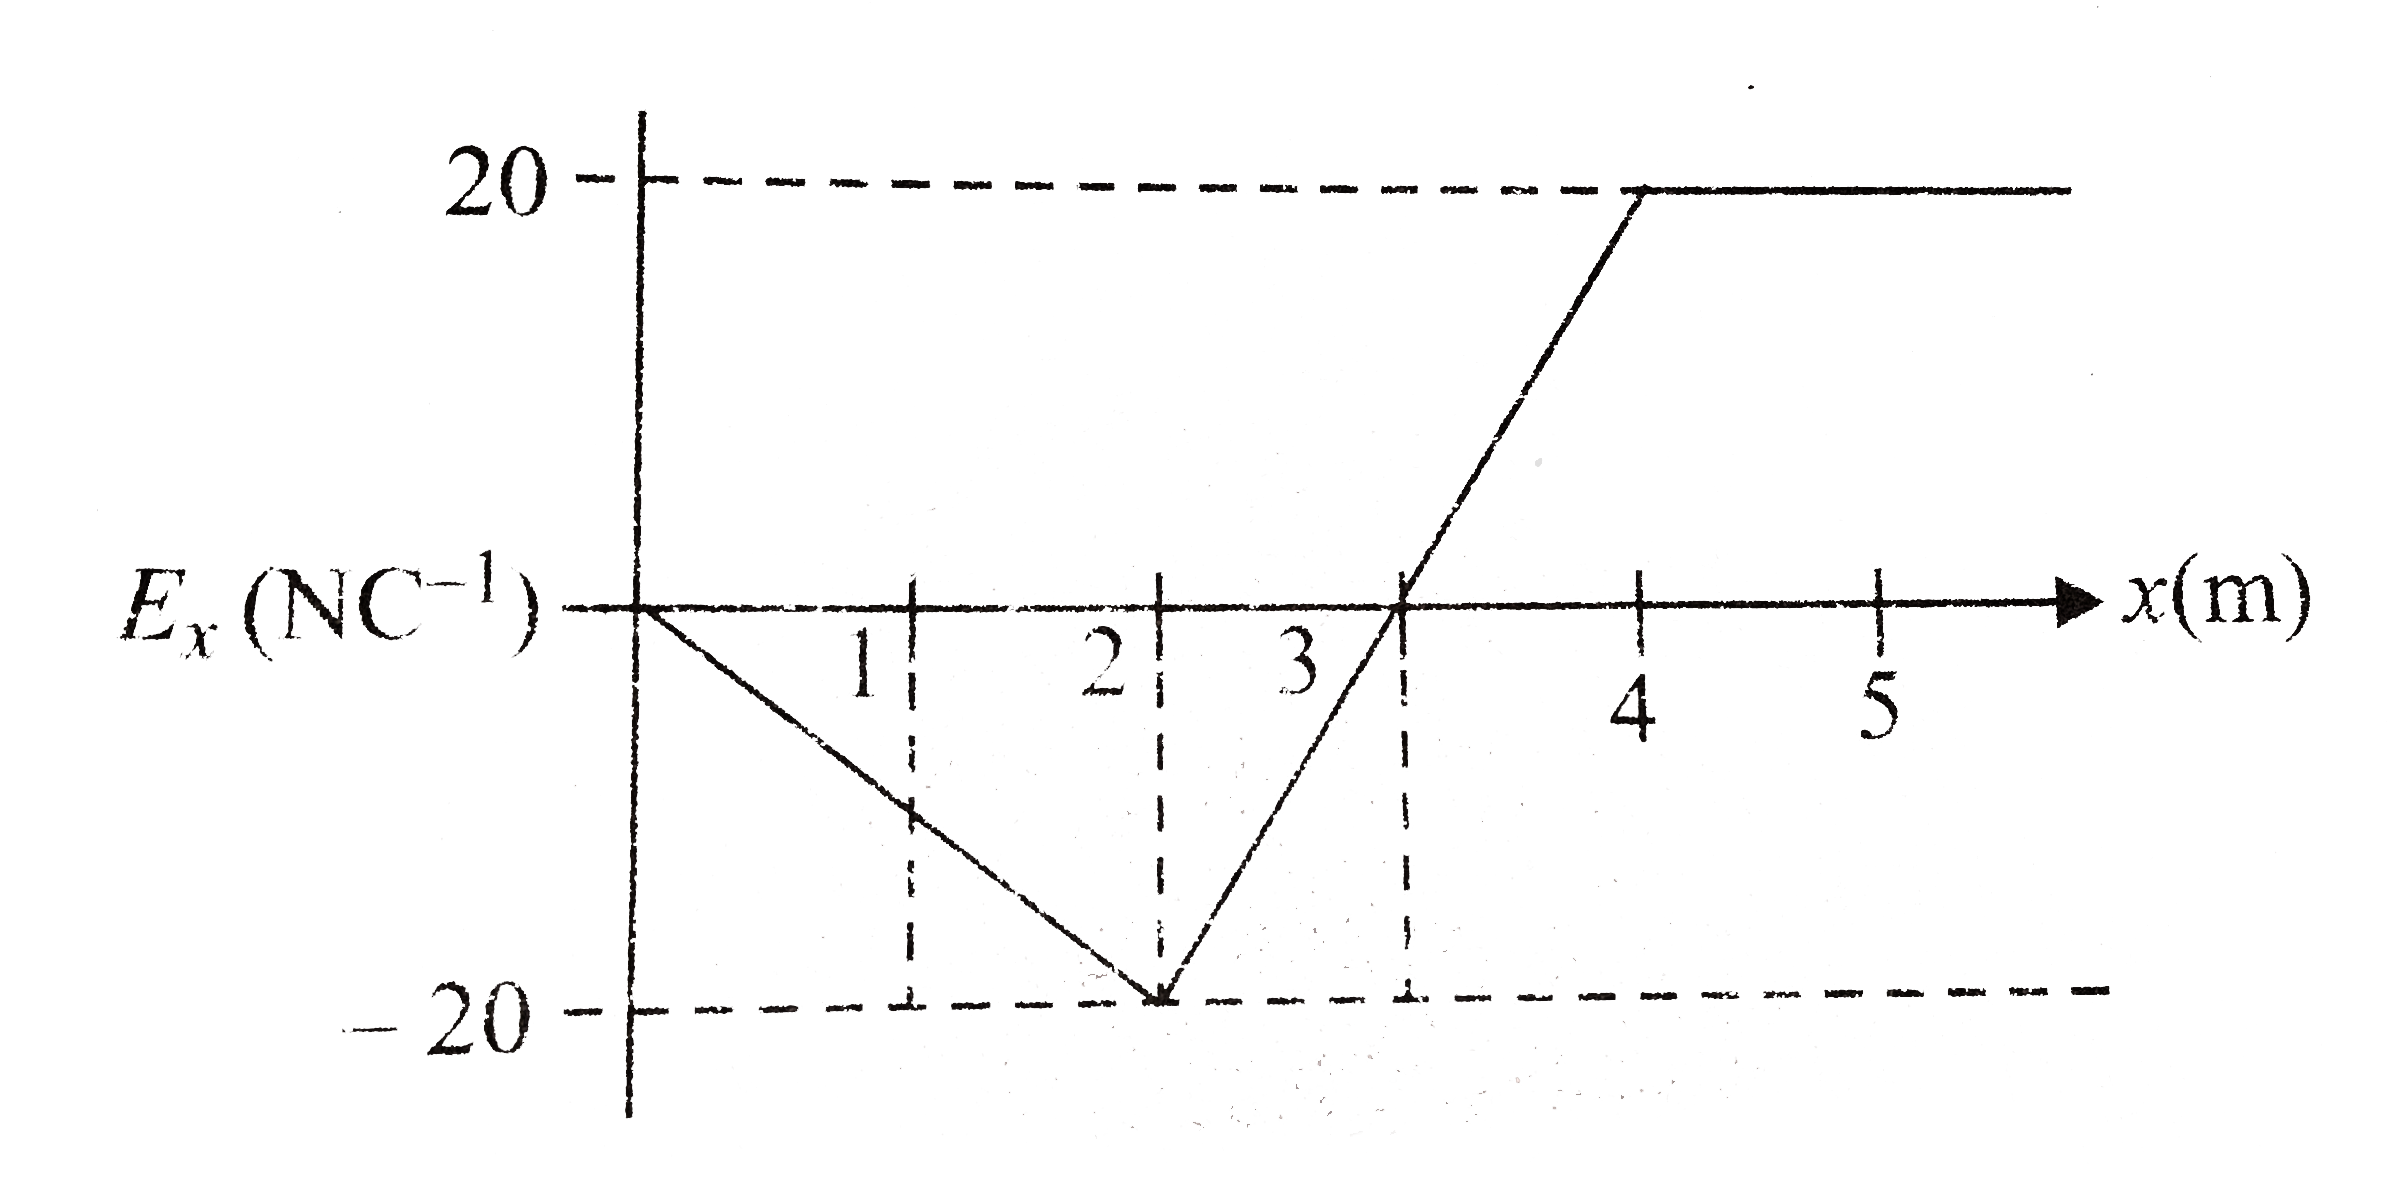
View SolutionA graph of the x-component of the electric field as a function of x in a region of space is shown in figure. The y−andz−compo≠nts of the electric field are zero in this region. If the electric potential is 10 V at the origin, then the potential at x = 2.0 m is
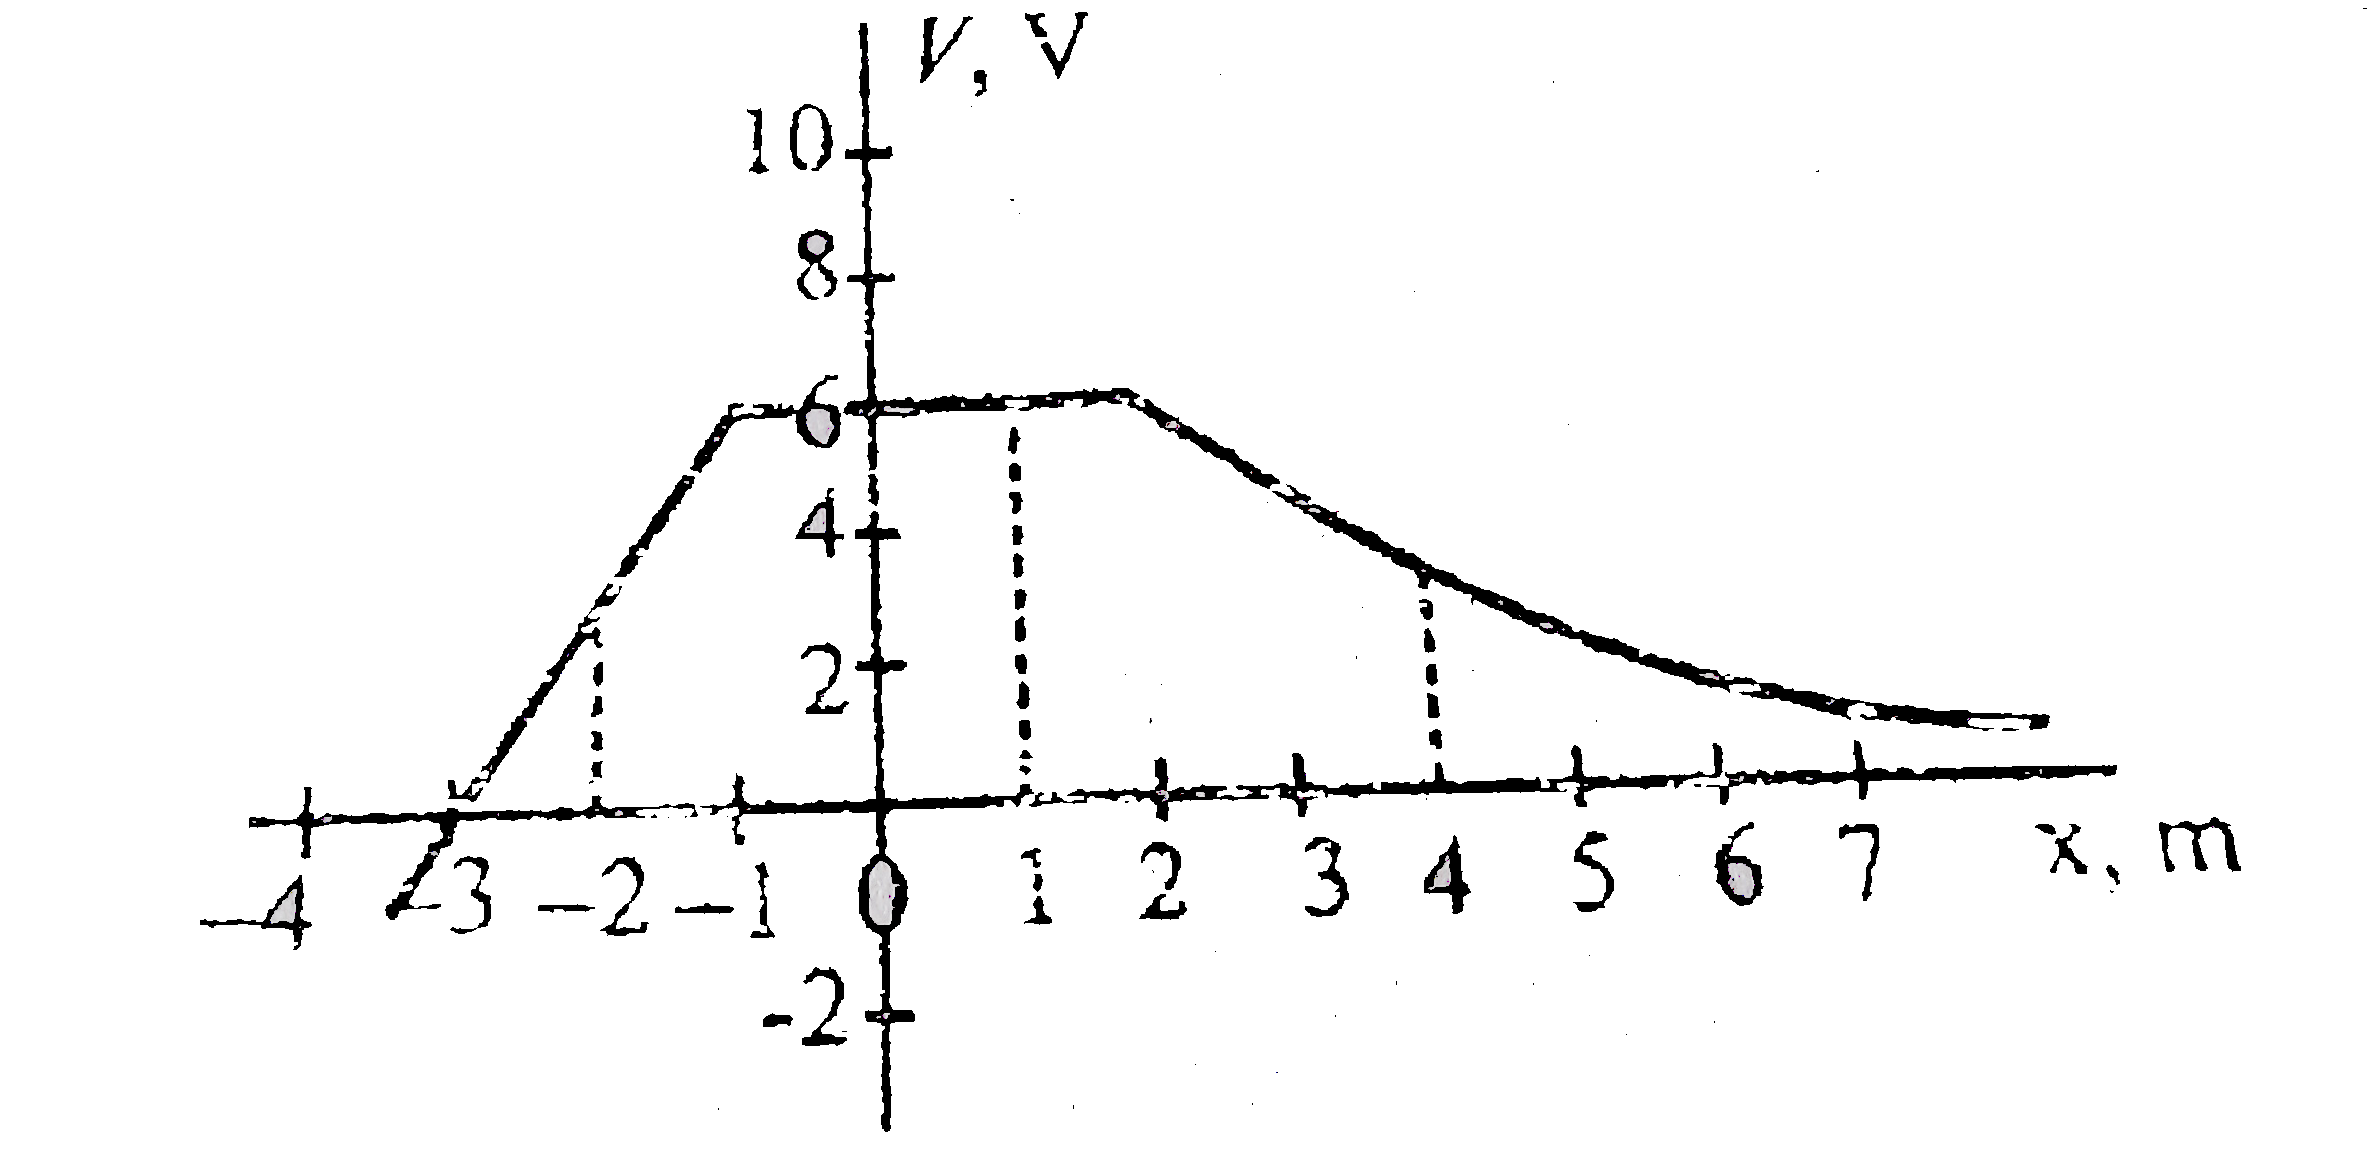
View SolutionThe potential as a function of x is plotted in figure. Which of the following is / are correct?
View SolutionFigure given below shows the plot of the conservative force F, in a unidimensional field. The plot representing the function corresponding to the potential energy (U) in the field is :
View SolutionThe figure gives the electric potential V as a function of distance through four regions , on x-axis. Which of the following is true for the magnitude of the electric field E in these regions?
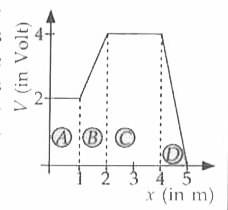
View SolutionThe electrostatic potential is given as a function of x in figure ( a) and (b) . Calculate the corresponding electric fields in regions A, B, C and D . Plot the electric field as a function of x for the figure (b).
View SolutionThe electric potential as a function of distance 'x' is shown in the figure . Draw a graph of the electric field E as a function of x.
View Solutionकिसी क्षेत्र में विद्युत विभव निर्देशांकों के फलन के रूप में V=1x+1y+1z से दिया जाता है। निर्देशांक (1,1,1) पर विद्युत क्षेत्र की तीव्रता ज्ञात करो
View SolutionFigure shows a plot of the conservative force F in a unidimensional field. The plot representing the function corresponding to the potential energy (U) in the field is
View SolutionA graph of the x-component of the electric field as a function of x in a region of space is shown in figure. The y−andz−compo≠nts of the electric field are zero in this region. If the electric potential is 10 V at the origin, then the potential at x = 2.0 m is

View SolutionThe field lines corresponding to an electric filed is shown in the figure then ( E denotes electric field and V denotes electric potential)
View Solution
