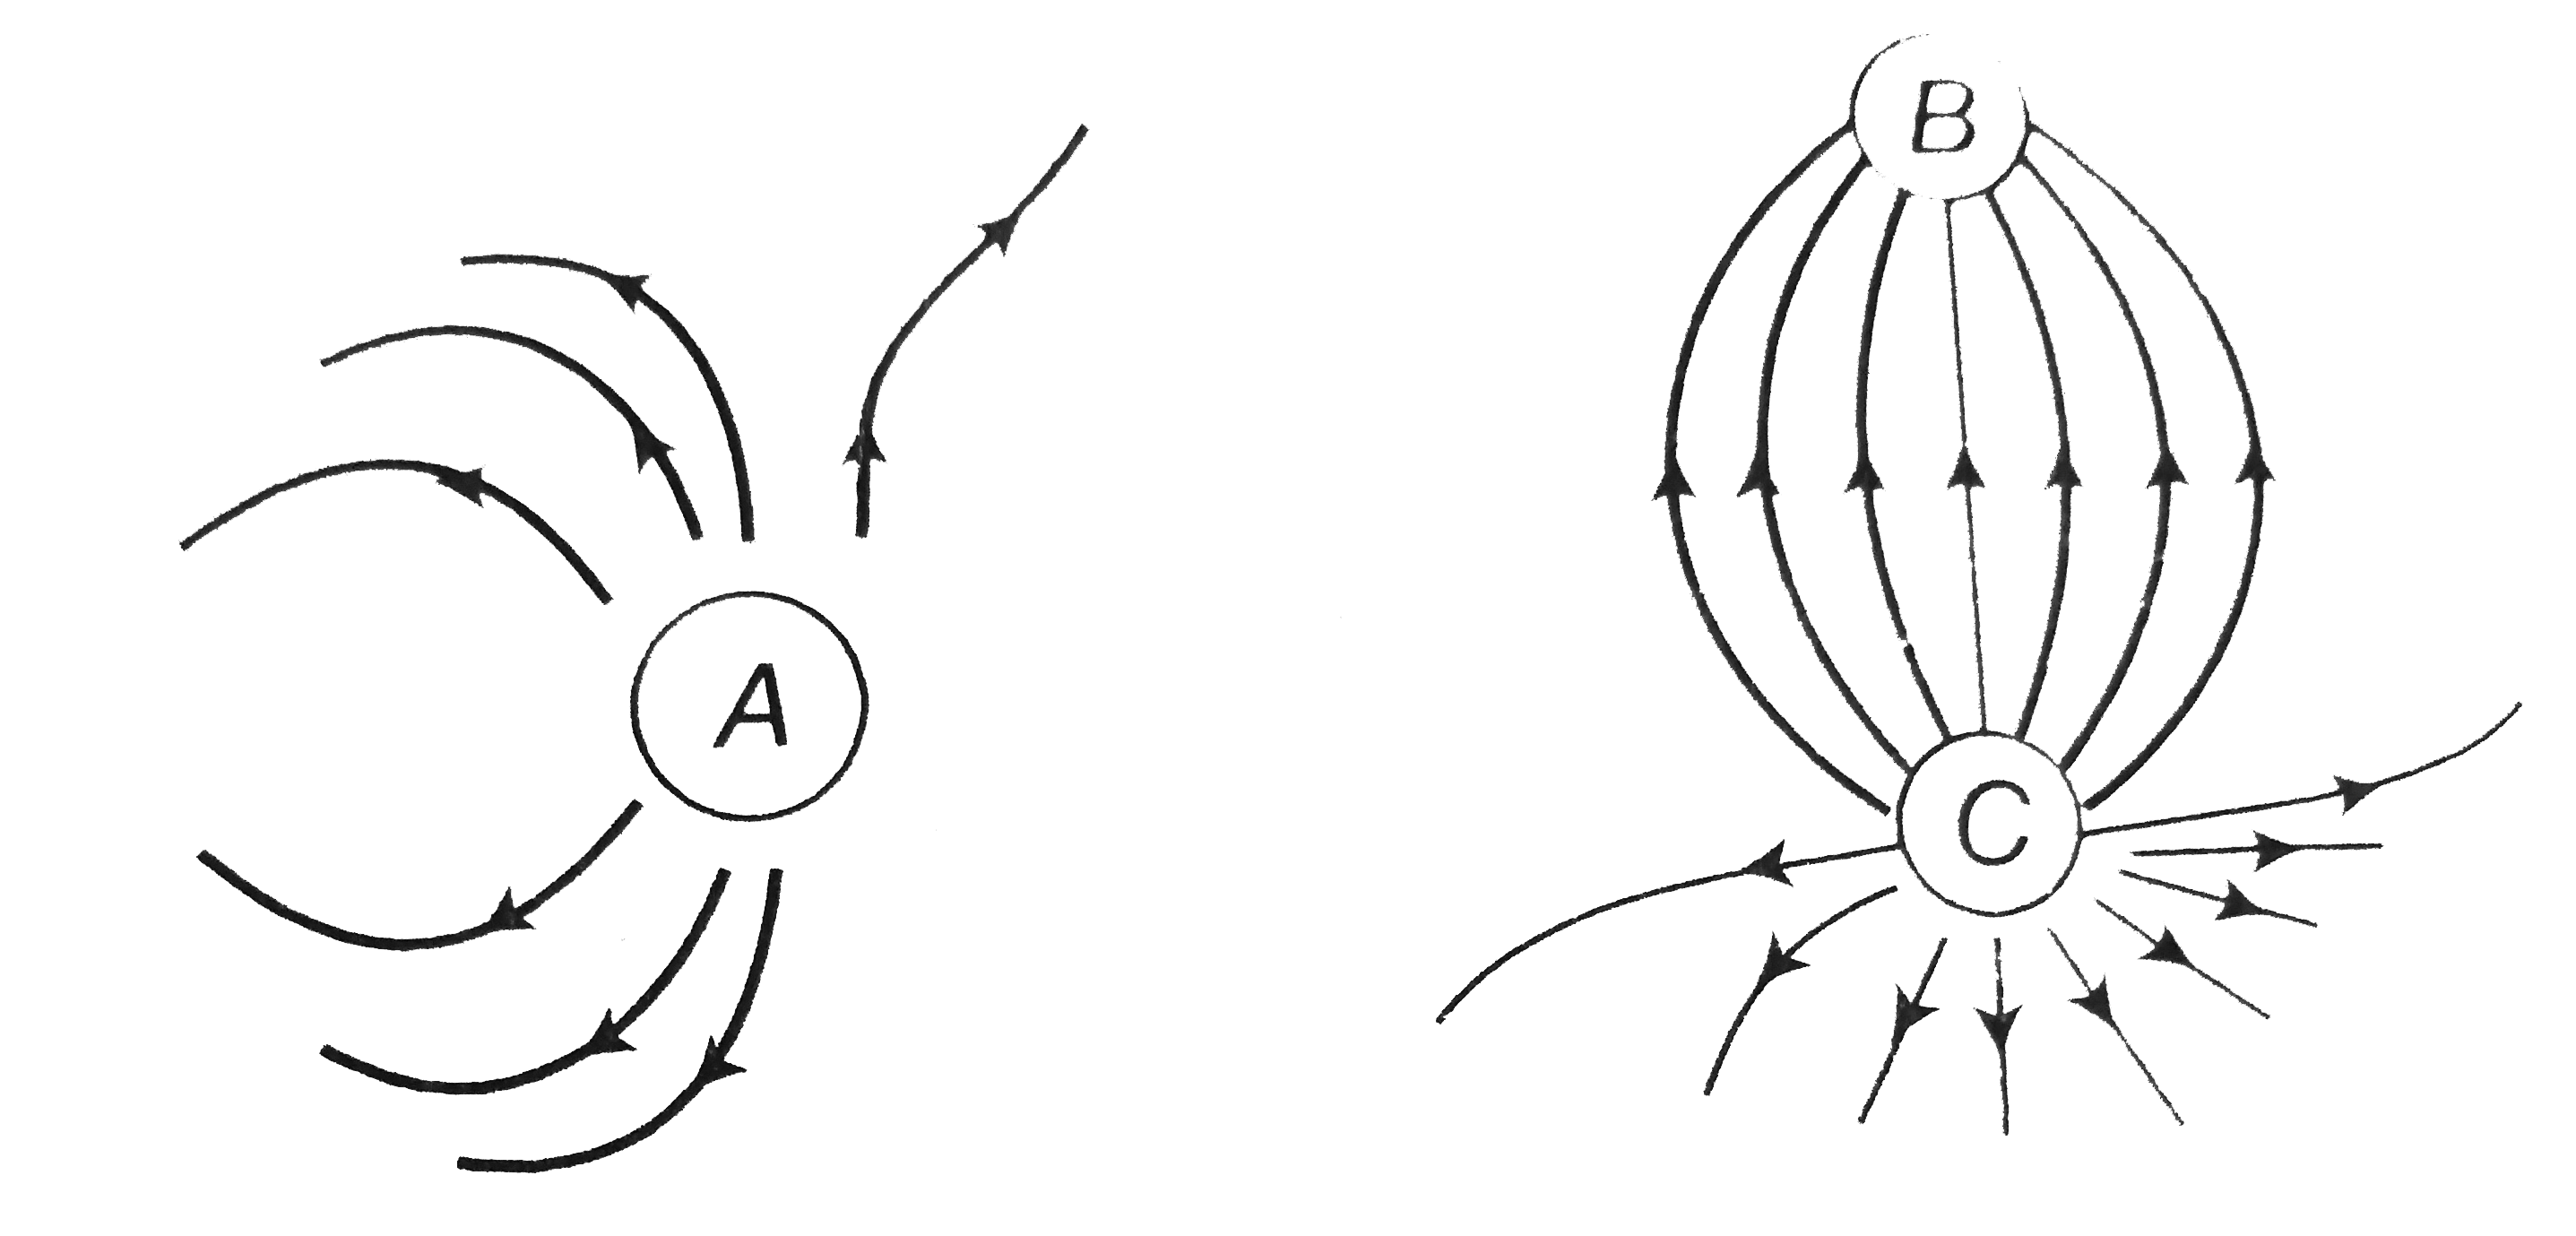
The following pictures depict electric field lines for various charge configurations.

(i) In figure (a) identify the signs of two charges and find the ratio ∣∣∣q1q2∣∣∣
(ii) In figure (b) calculate the ratio of two positive charges and identify teh strength of the electric field at three points A, B and C
(iii) Figure (c) represents the electric field lines for three charges . If q2 =-20nC then calculate the values of q1 and q3 Solution in Tamil
(i) The electric field lines start at q2 and end at q1 . In figure (a) q2 is positive and q1 is negative . The number of lines starting from q2 is 18 and number of the lines ending at q1 is 6. So q2 has greater magnitud. The ratio of ∣∣∣q1q2∣∣∣=N1N2=68=13 . It implies that |q2|=3|q1|.
(ii) In figure (b) , the number of field lines emanating from both positive charges are equal (N=18). So the charges are equal . At point A the electric field line are denser compared to the lines at point B. So the electric at point A is greater in magnitude compared to the field at point B . Further no electric field line passes through C which implies that the resultant electric field at C due to these two charges is zero .
(iii) In the figure (c) the electric field lines start at q1 and q3 and end at q2 and end at q2 , This implies that q1 and q3 are positive charges. The ratio of the number of field lines is ∣∣∣q1q2∣∣∣=816=∣∣∣q3q2∣∣∣=12 implying that q1 and q3 are half of the magnitude of q2 . So q1=q3=+10n C .
Topper's Solved these Questions
- ELECTROSTATICS BOOK - FULL MARKSCHAPTER - ELECTROSTATICS EXERCISE - Textual Evaluation Solved (Multiple choice questions : )
15 Videos
- ELECTROSTATICS BOOK - FULL MARKSCHAPTER - ELECTROSTATICS EXERCISE - Textual Evaluation Solved (II. Short Answer Questions : )
21 Videos
- DUAL NATURE OF RADIATION AND MATTERBOOK - FULL MARKSCHAPTER - DUAL NATURE OF RADIATION AND MATTEREXERCISE - ADDITIONAL QUESTIONS -( ADDITIONAL NUMERICAL PROBLEMS : )
10 Videos
- MAGNETISM AND MAGNETIC EFFECTS OF ELECTRIC CURRENT BOOK - FULL MARKSCHAPTER - MAGNETISM AND MAGNETIC EFFECTS OF ELECTRIC CURRENT EXERCISE - ADDITIONAL QUESTIONS SOLVED - NUMERICAL PROBLEMS :
4 Videos
Similar Questions
Two identical point charges'of magnitude -q are fixed as shown in the figure below. A third charge +q is placed midway between the two charges at the point P. Suppose this charge is displaced a small distance from the point P in the directions indicated by the arrows, in which direction(s) will +q be stable with respect to the displacement?

View SolutionWhat is meant by quantisation of charges ?
View SolutionIf a light of wavelength 4950 Å is viewed as a continuous flow of photons, what is the energy of each photon in eV ? (Given h=6.6×10⁻³⁴Js, c =3×10⁸ms−1)
View SolutionThe radius of the first orbit of hydrogen atom is 0.5 Å. The electron moves is an orbit with a uniform speed of 2.2×10⁶ms−1. What is the magnetic field produced at the centre of the uncleus due to the mation of this electron ? Use μ0=4π×10−7Hm−1 and electric charge =1.6×10⁻¹⁹ C
View SolutionFigure shows some of the electric field lines due to three point charges q_, q_2 and q_3 of equal magnitude. What are the signs of each of the three charges?
View SolutionThe given figure gives electric line of force due to two charges q_(1) and q_(2) . What are the signs of the two charges ?
View SolutionFigure shows the electric field lines around three point charges A,B and C. Which of the following charges are positive?
View SolutionTwo point charges Q1 and Q2 are positioned at points I and 2. The field intensity to the right of the charge Q2 on the line that passes through the two charges varies according to a law that is represented in the figure. The field intensity is assumed to be positive if its direction coincides with the positive direction on the x-axis. The distance between the charges is l.
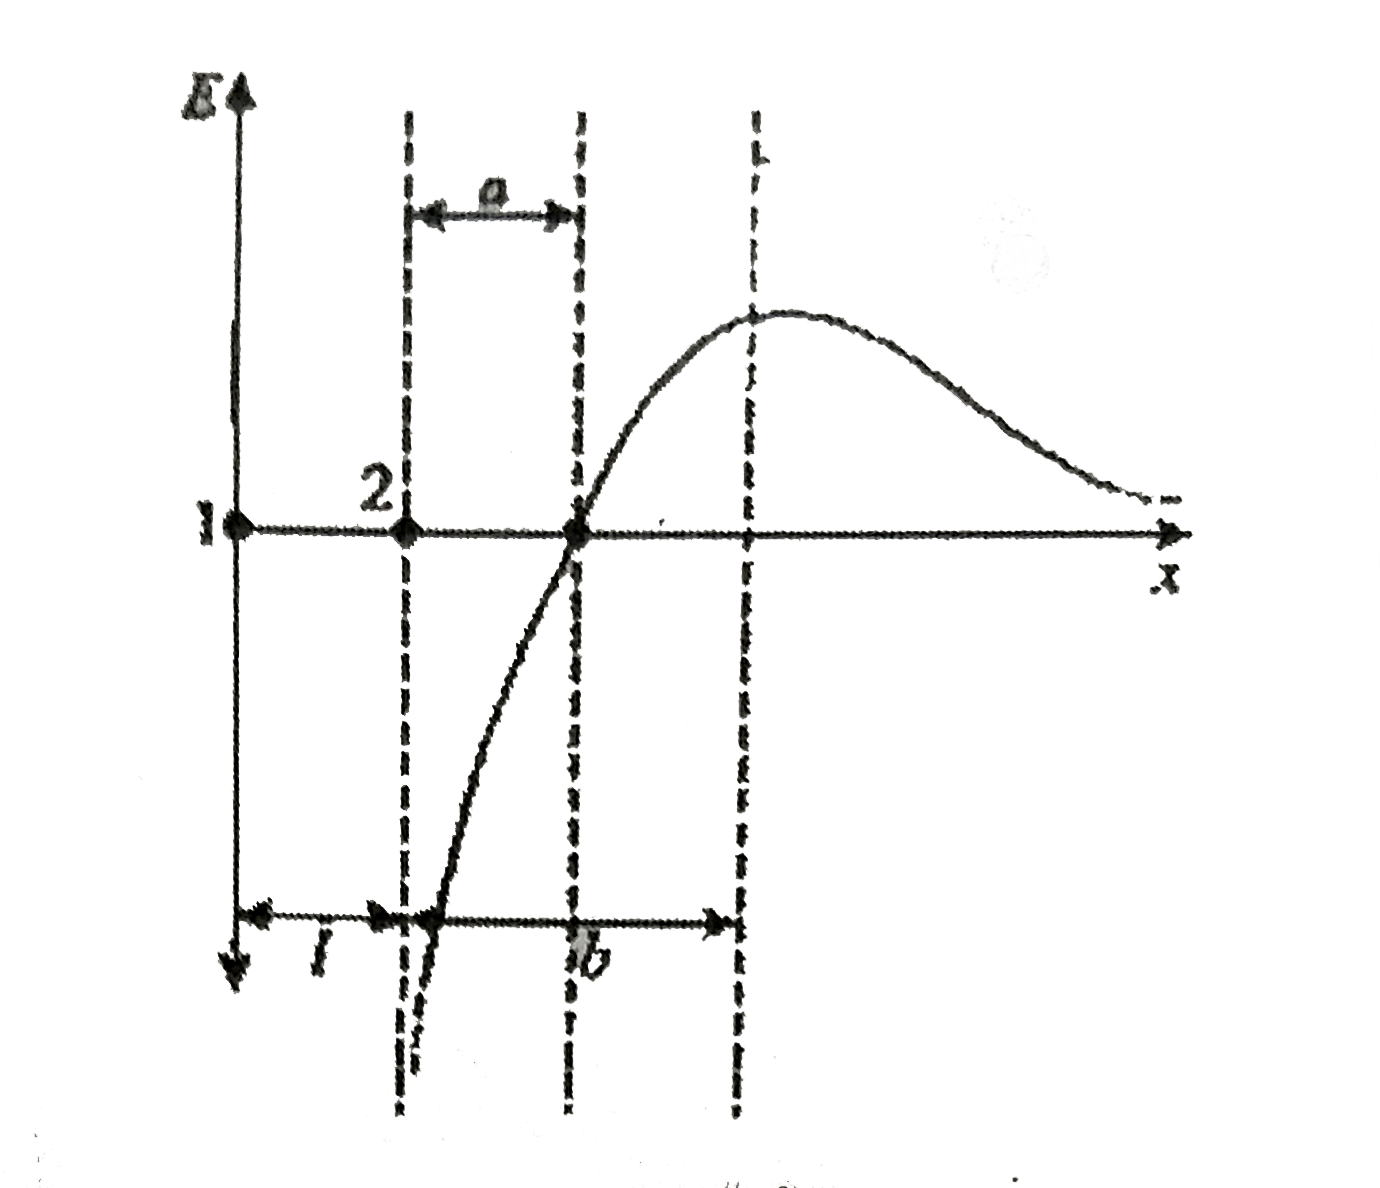
(a) Find the sign of each charge
(b) Find the ratio of the absolute values of the charges ∣∣∣Q1Q2∣∣∣
(c) Find the value of b where the field intensity is maximum
[(a) Q2 is negative and Q1 is positive (b) (l+aa)2, (c) l(l+aa)2/3−1⎤⎥ ⎥ ⎥⎦
View SolutionWhat is the ratio of the charges |(q_(1))/(q_(2))| for the following electric field line pattern ?
View Solutionचित्र 2.58 में बिन्दु आवेश q1 और q2 की वैद्युत क्षेत्र रेखाएँ दिखाई गई है। q1 और q2 के क्या-क्या चिह्न हैं? यदि रेखाएँ आवेश के अनुपात में खींची गईं हों, तो अनुपात q1/q2 क्या है?
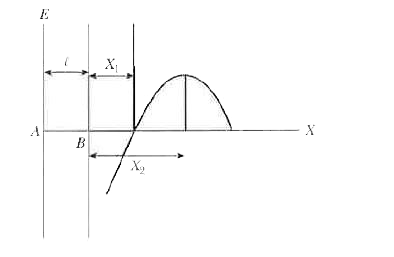
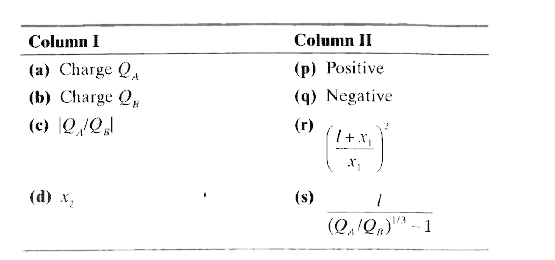
View SolutionTwo points like charges QA and QB are positioned at points a and B (see figure). The electric field strength to the right of charge QB on the line that passes through the two charges varies according to a law that is represented schematically in Figure below accompaanying the problem without employing a definite scale. Assume electric field to be positive if its direct ion coincides with (the positive direction on the x-axis. THe distance between the charges is l.
View SolutionFigure shows the electric field lines around three point charges A,B and C. Which of the following charges are positive?

View SolutionFigure shows some of the electric field lines due to three point charges q,q2 and q3 of equal magnitude. What are the signs of each of the three charges?

View SolutionThe given figure gives electric line of force due to two charges q1 and q2. What are the signs of the two charges ?
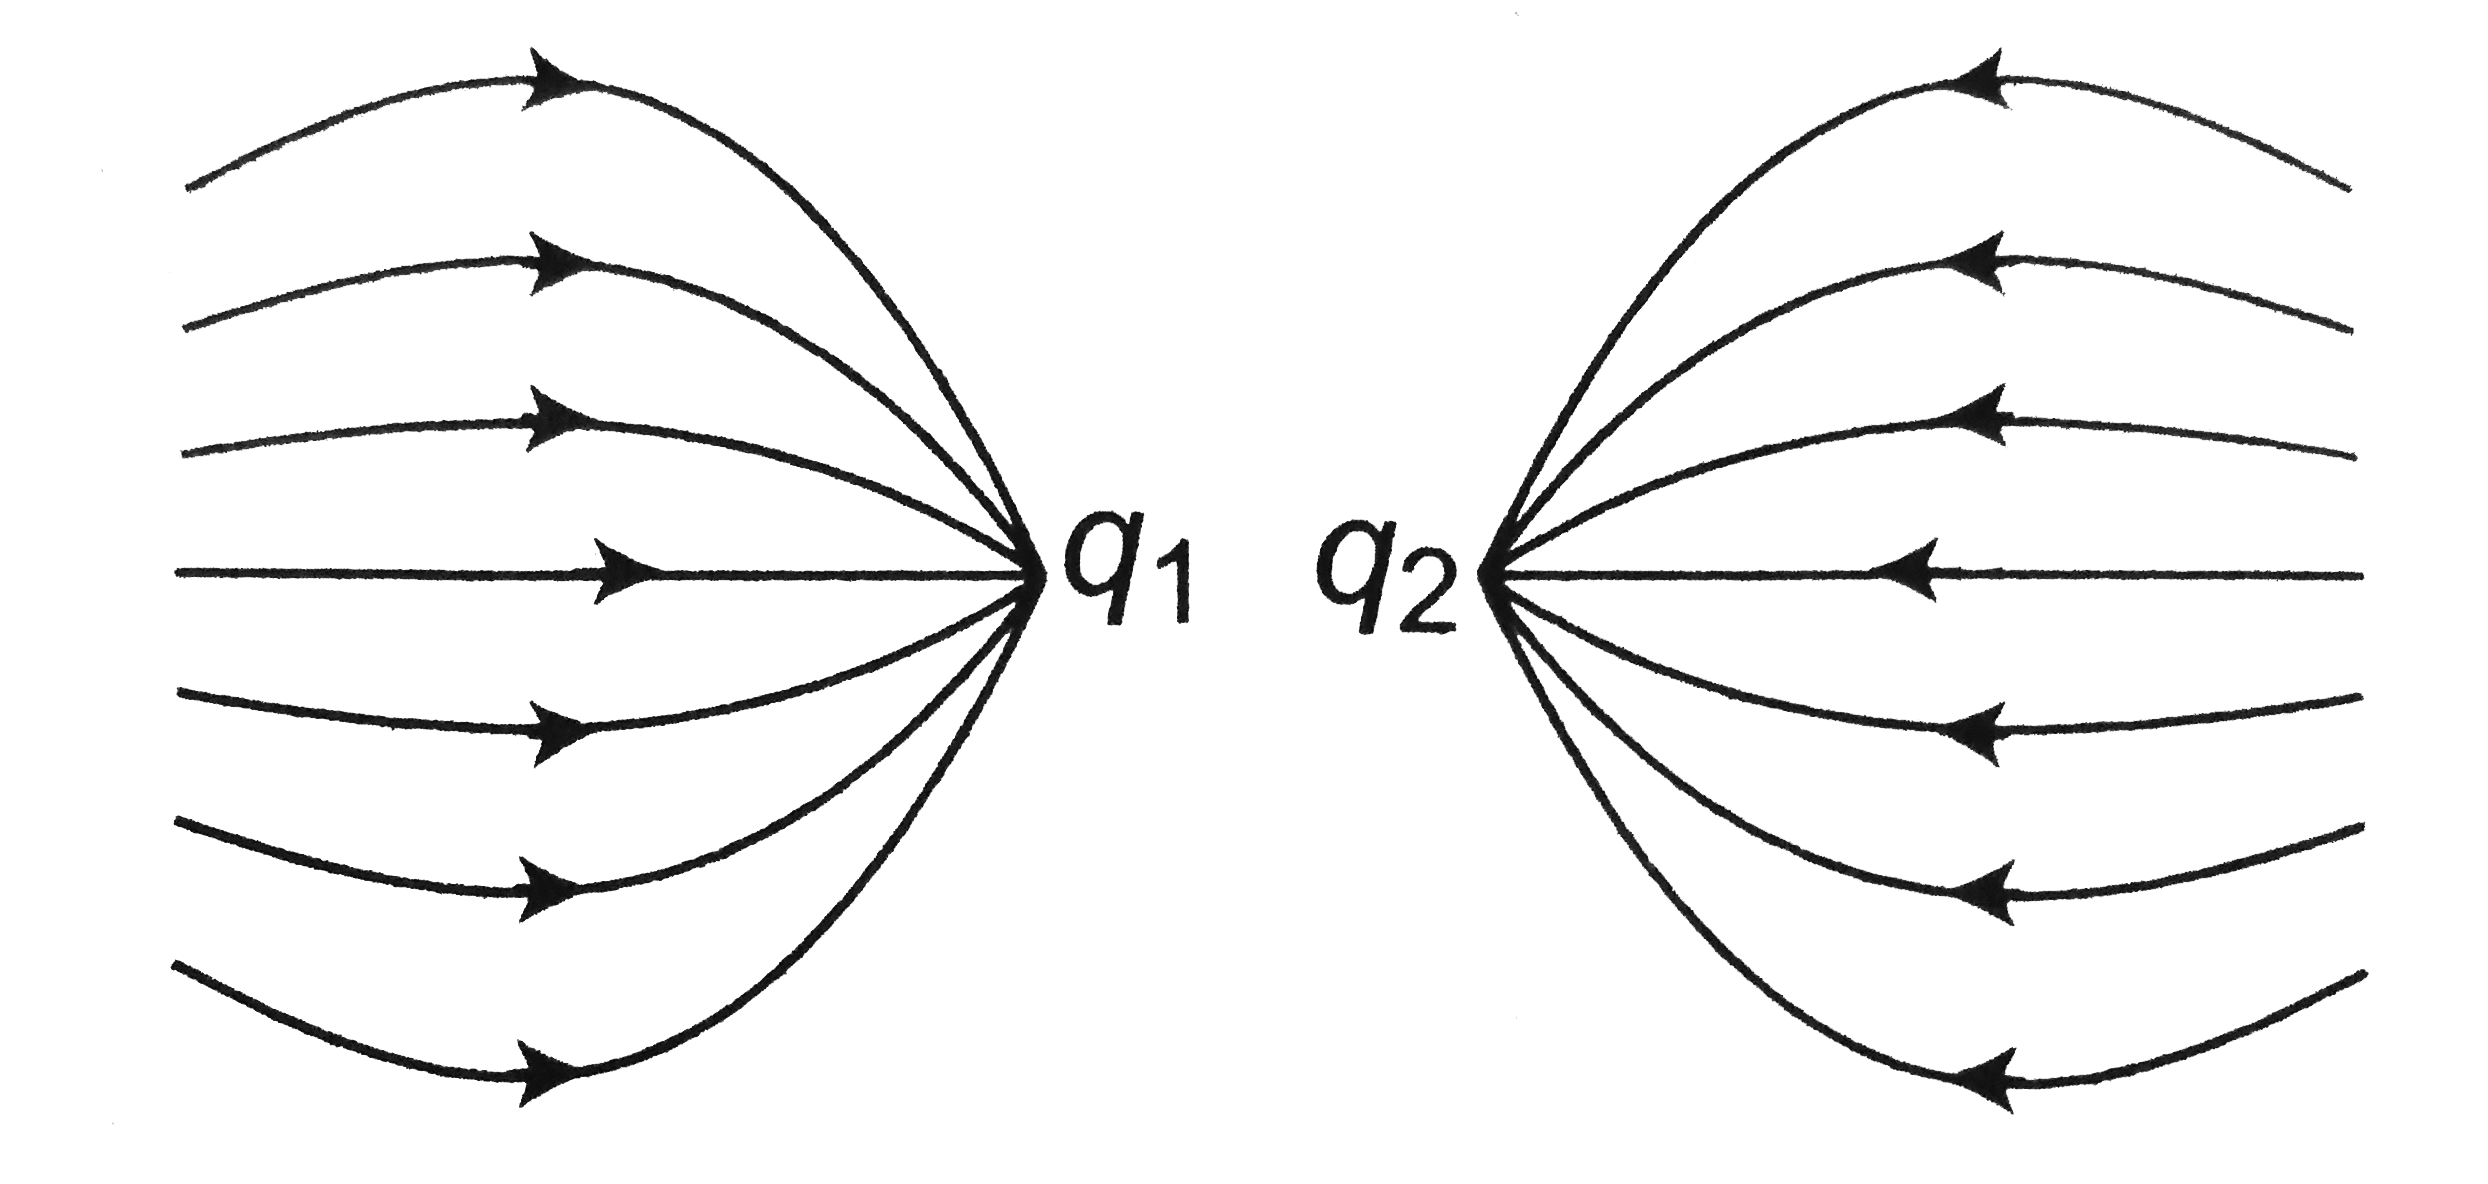
View SolutionThe figure shown is a plot of electric field lines due to two charges Q1 and Q2 . The sign of charges is

View Solution
