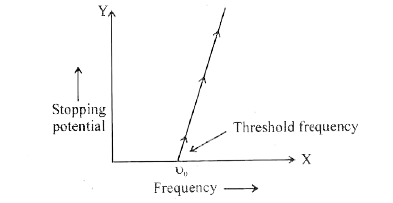
a. Draw the graph showing the variation of potential with frequency of incident radiation.
b. What does the slope of the graph represent?
c. From the slope how will you find the value of 'h' ? Solution in Tamil
a. 
b. Slope of the graph gives
c. Knowing the slope from the graph and the value of .e., we can find the value of h.
Topper's Solved these Questions
- DUAL NATURE OF RADIATION AND MATTER BOOK - NEW JOYTHI PUBLICATIONCHAPTER - DUAL NATURE OF RADIATION AND MATTER EXERCISE - CONTINUOUS EVALUATION (ASSIGNMENT)
4 Videos
- DUAL NATURE OF RADIATION AND MATTER BOOK - NEW JOYTHI PUBLICATIONCHAPTER - DUAL NATURE OF RADIATION AND MATTER EXERCISE - PREVIOUS YEAR QUESTIONS
4 Videos
- DUAL NATURE OF RADIATION AND MATTER BOOK - NEW JOYTHI PUBLICATIONCHAPTER - DUAL NATURE OF RADIATION AND MATTER EXERCISE - PRACTICE PROBLEMS FOR SELF ASSESSMENT
5 Videos
- CURRENT ELECTRICITYBOOK - NEW JOYTHI PUBLICATIONCHAPTER - CURRENT ELECTRICITYEXERCISE - COMPETITIVE EXAM CORNER
37 Videos
- ELECTRIC CHARGES AND FIELDS BOOK - NEW JOYTHI PUBLICATIONCHAPTER - ELECTRIC CHARGES AND FIELDS EXERCISE - Competitive Exam Corner
20 Videos
Similar Questions
Discuss the various modes of emission of electron.
View SolutionAlbert Einstein, the great physist proposed a clear picture to explain photoelectric effect.
a. Explain Einstein's photo electric equation.
b. Name the quanta of light.
View SolutionWhat is the energy of an α particle that has been accelerated through 50,000 V ?
View SolutionAn electric bulb rated 500 W at 100 V is used in a circuit having a 200 V supply. The resistance R that must be put in series with the bulb, so that the bulb draws 500 W is
View SolutionTwo charged spherical conductors of radii R1andR2 are connected by a wire. Then the ratio of surface charge densitites of the spheres σ1/σ2 is
View SolutionDraw a graph showing the variation of stopping potential with frequency of the incident radiation. What does the slope of the line with frequency axis indicate? What information can be obtained from the values of intercept on the potential axis?
View SolutionDraw a graph showing the variation of stopping potential with frequency of the incident on a metal plate. How can the value of Planck's constant be determined from this graph?
View Solutionप्रकाशवैधुत प्रभाव में आपतित प्रकाश की आवृत्ति और उत्सर्जित इलेक्ट्रॉनों की अधिकतम गतिज ऊर्जा के बीच ग्राफ खींचिए । ग्राफ की प्रवणता (झुकाव ) क्या निरूपित करती है ?
View Solutionआइन्सटीन के प्रकाशवैधुत समीकरण की सहायता से निरोधी विभव तथा आपतित प्रकाश की आवृत्ति में ग्राफ बनाइए । ग्राफ में देहली आवृत्ति प्रदर्शित कीजिए तथा ग्राफ की ढाल का सूत्र लिखिए
View Solutionदेहली आवृतियों vA>vB के दो प्रकाश सुग्राही पदार्थों A और B के आपतित विकिरणों की आवृत्ति के साथ निरोधी विभव के विचरण को दर्शाने के लिए ग्राफ खींचिए ।
क्या ग्राफ की प्रवणता उपयोग किये गये पदार्थ की प्रकृति पर निर्भर करती है ? व्याख्या कीजिए ।
View SolutionDraw I-V graph for a conductor. What does the slope represent ?
View SolutionDraw and explain the graph showing the variation of stopping potential with frequency of incident radiation in relation to photoelectric effect.
View SolutionDefine photoelectric effect. Draw a graph to show the variation of stopping potential with frequency of incident radiation on a metal plate.
View SolutionThe slope of the graph drawn between stopping potential and frequency of incident radiation will be
View SolutionDraw a graph showing the variation of stopping potential with frequency of incident raditions in relation to photoelectric effect. Deduce an expression for the slope of this graph using Einstein's photoelectric equation.
View Solution
