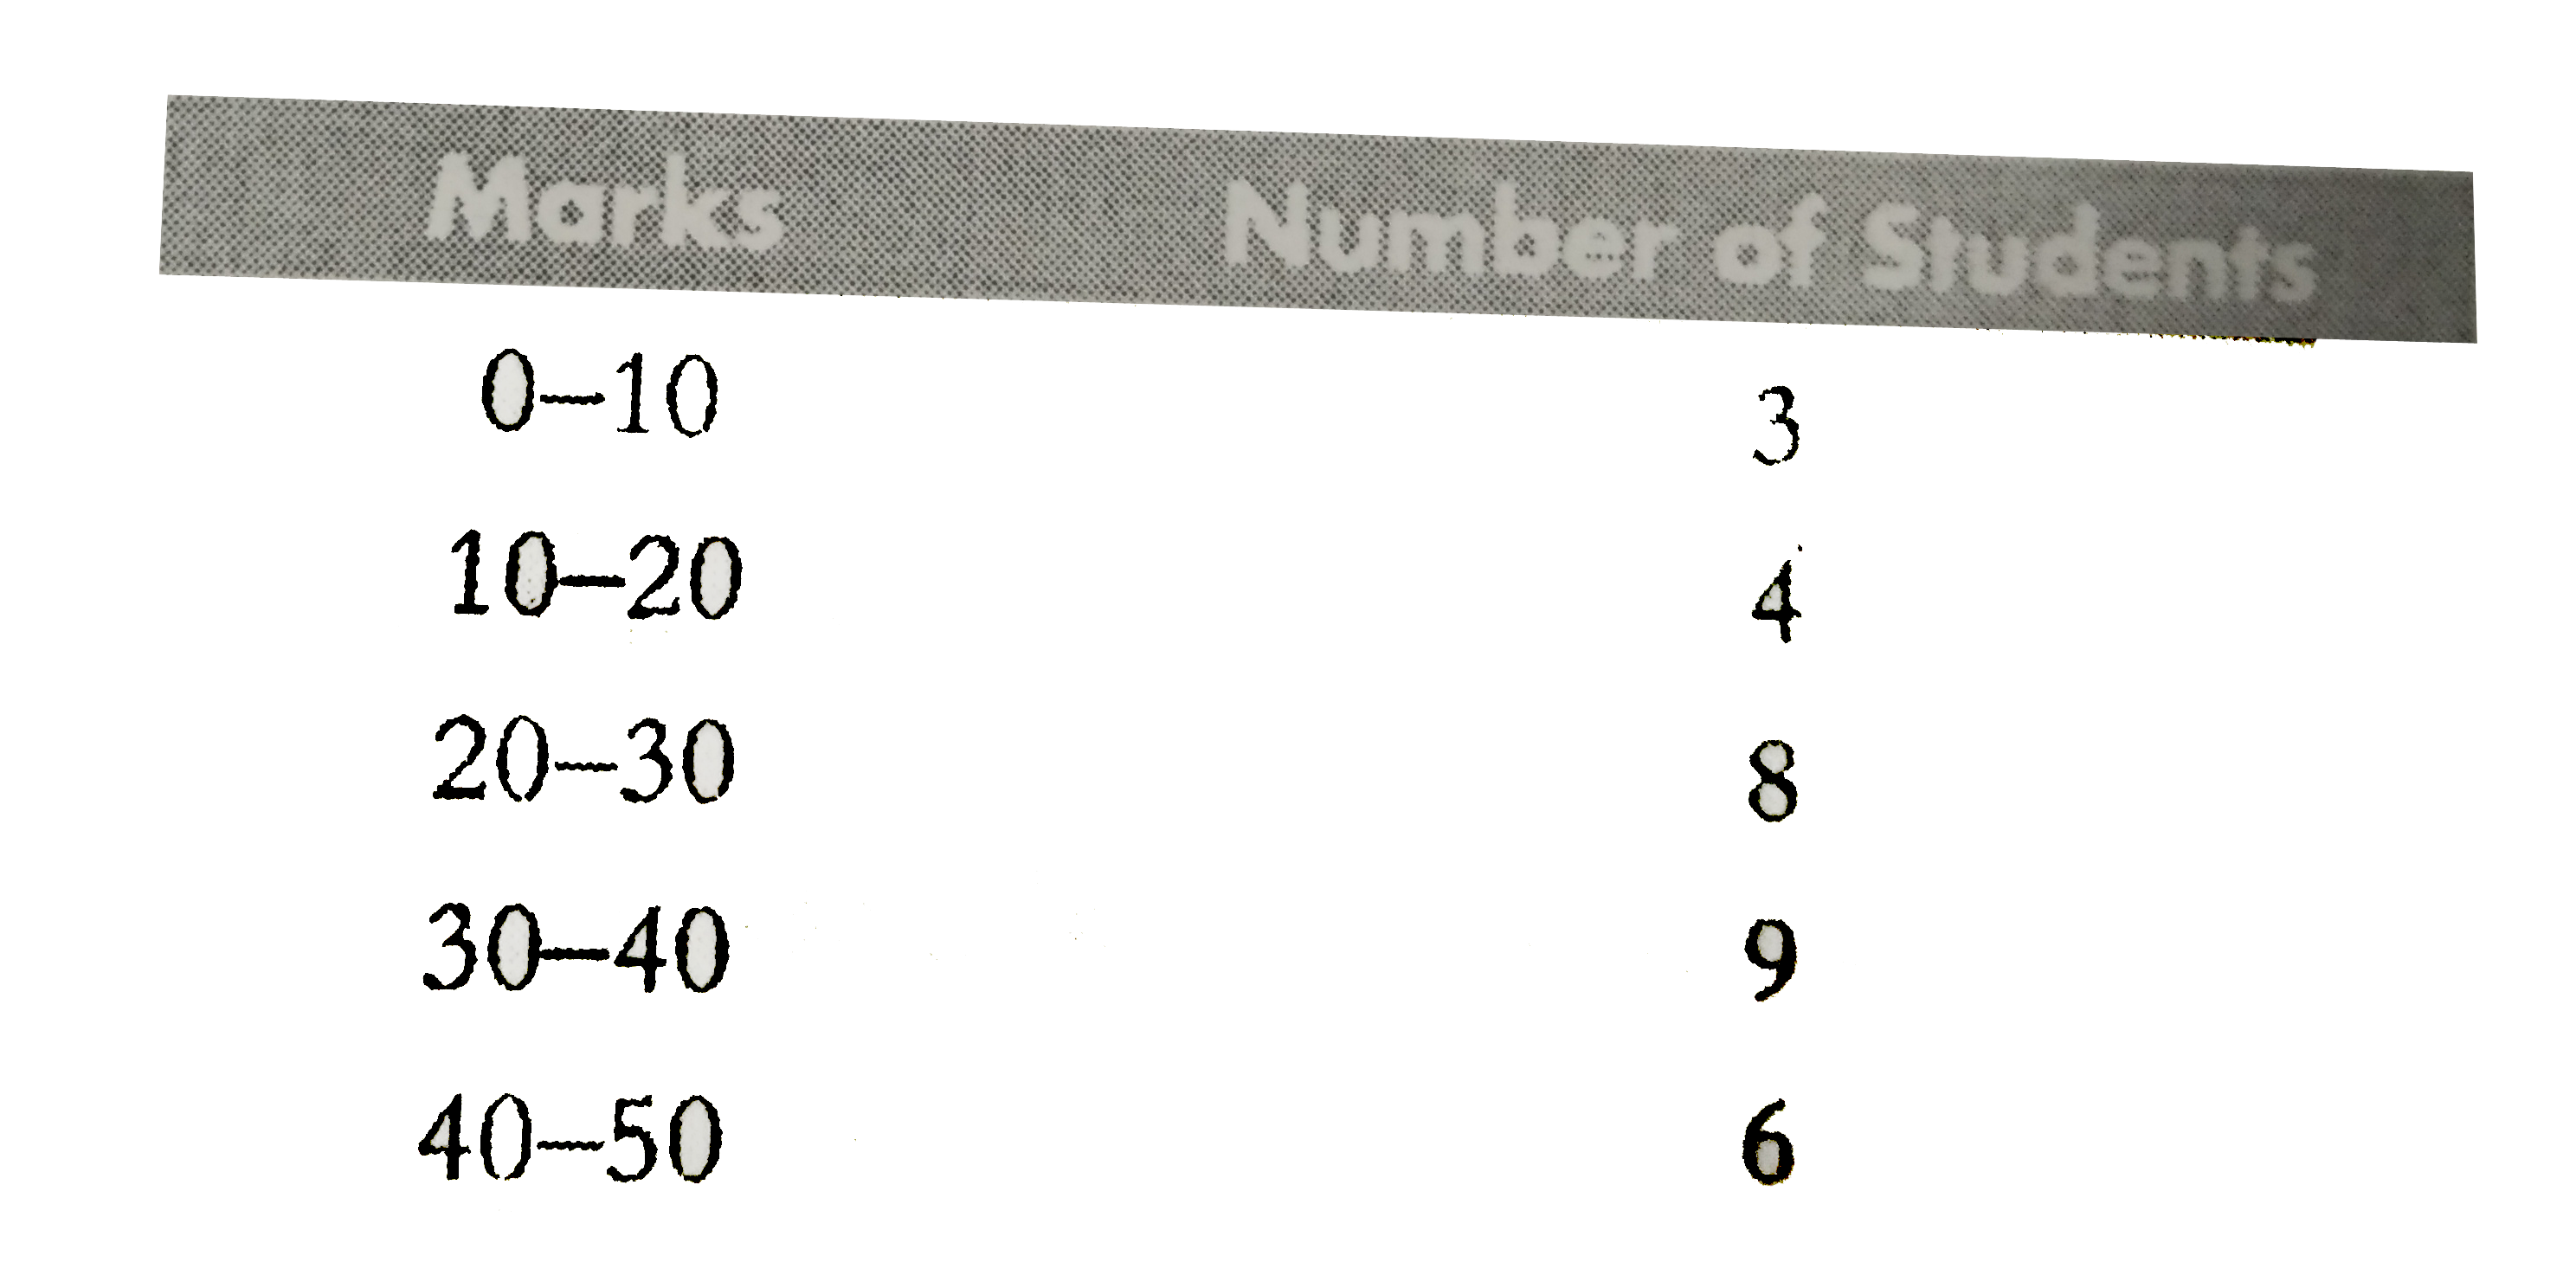
Construct a histogram for the following frequency distribution :

Video Solution
Text Solution
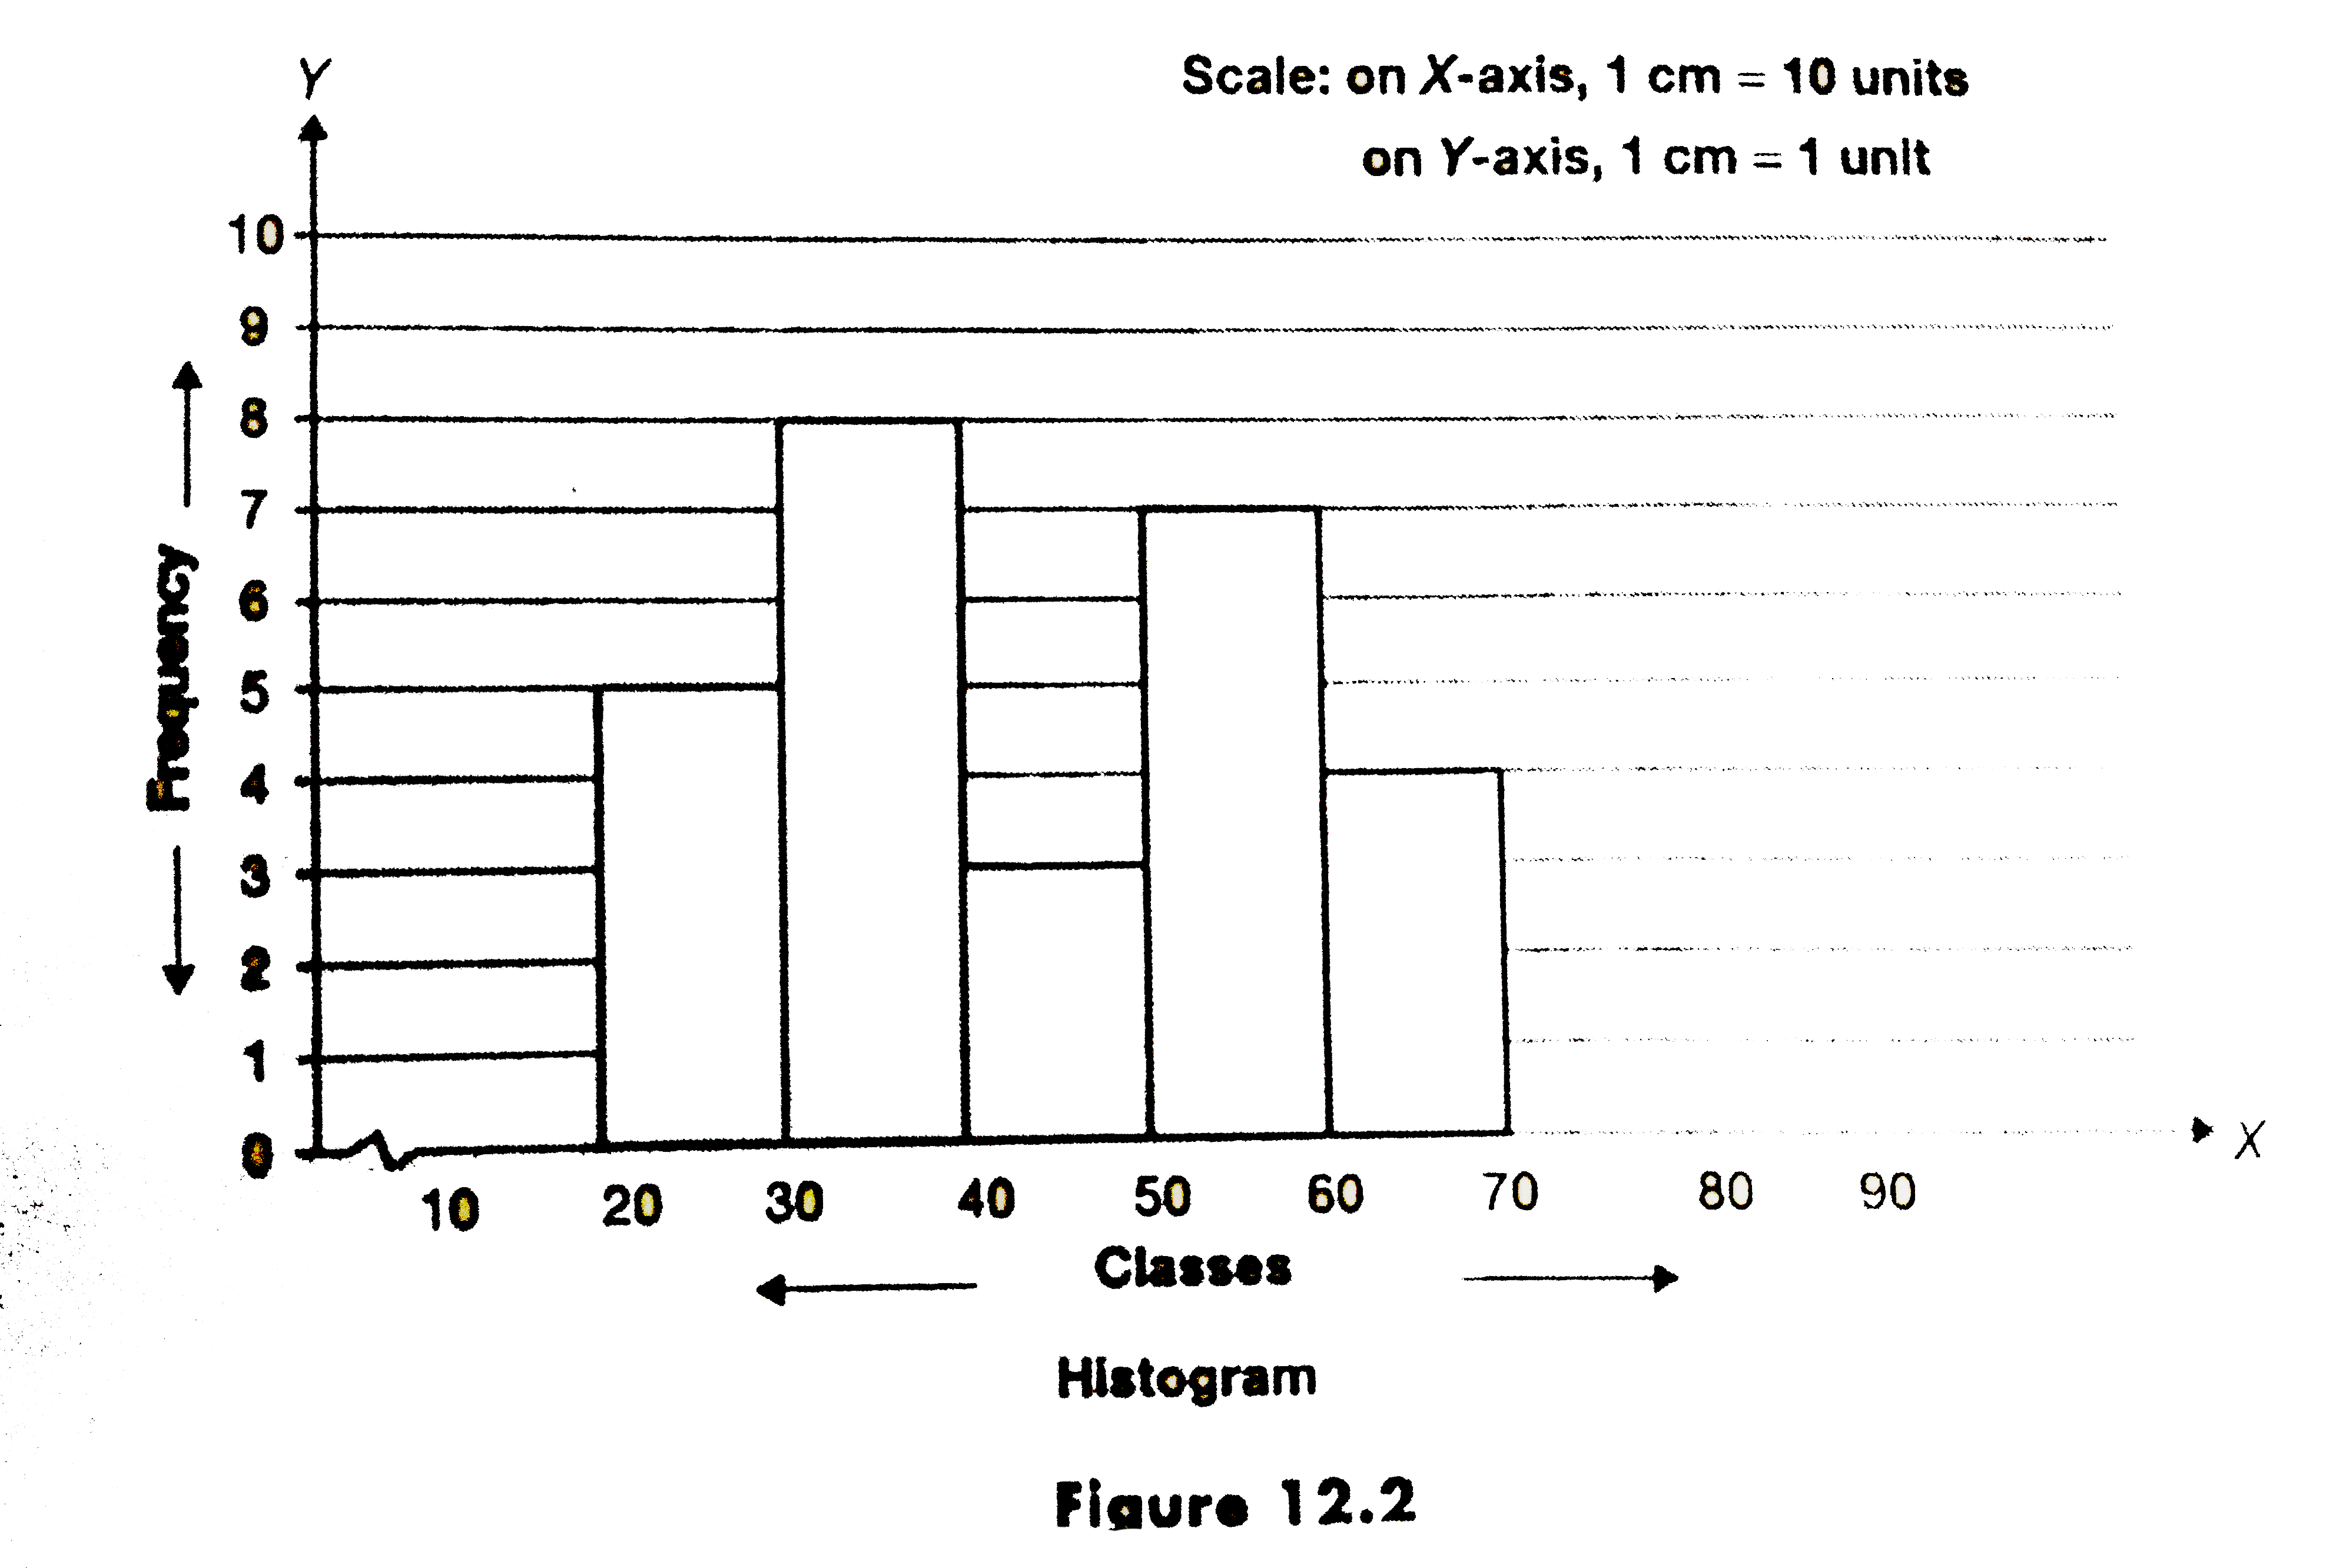
Here the class intervals are continuous .
The following histogram is drawn according to the method described above :

|
Topper's Solved these Questions
- STATISTICS BOOK - PEARSON IIT JEE FOUNDATIONCHAPTER - STATISTICS EXERCISE - Very short answer type questions
30 Videos
- STATISTICS BOOK - PEARSON IIT JEE FOUNDATIONCHAPTER - STATISTICS EXERCISE - Short Answer Type Questions
13 Videos
- SHARES AND DIVIDENDSBOOK - PEARSON IIT JEE FOUNDATIONCHAPTER - SHARES AND DIVIDENDSEXERCISE - Level 3
15 Videos
- TAXATION BOOK - PEARSON IIT JEE FOUNDATIONCHAPTER - TAXATION EXERCISE - LEVEL 3
10 Videos
Similar Questions
Knowledge Check
To draw a histogram to represent the following frequency distribution.
Class Interval 5−1010−1515−2525−4545−75
Frequency 6 12 10 8 15
The adjusted frequency for the class 25−45 isA6B5C3D2
Draw the Histogram for the following frequency distribution.

View SolutionDraw a histogram of the following frequency distribution and use it to calculate the mode
View SolutionConstruct a histogram from the following data :

View SolutionConstruct a histogram for the frequency distribution below:
Class Interval10−2020−3030−4040−5050−60Frequency63847
View SolutionConstruct a histogram for the following distribution:

View SolutionDraw the histogram for the following distribution :

View SolutionFind the mean of the followings frequency distribution :

View Solution


