Who observed that 'within a region, species richess icreased with increasing explored area but only upto a limit'
Paul Ehrlich
David Tilman
Alexander von Humboldt
Edward Wilson
The correct Answer is:C
German naturalist and geographer Alexander voan Humboldt while exploring the wilderness of south American Jungle observe that within a regions species richness increases with increasing explored area, but only up to a limit.
Topper's Solved these Questions
- BOOK - A2ZCHAPTER - BIODIVERSITY AND CONSERVATIONEXERCISE - Secion A Section A: Topicwise Questions (topic 3: :loss Of Biodiversity32videos
BIODIVERSITY AND CONSERVATION
- BOOK - A2ZCHAPTER - BIODIVERSITY AND CONSERVATIONEXERCISE - Secion A Section A: Topicwise Questions (topic 4: Biodiversity Conservation) Why Should We Canserve36videos
BIODIVERSITY AND CONSERVATION
- BOOK - A2ZCHAPTER - BIODIVERSITY AND CONSERVATIONEXERCISE - Section D Chapter-end Test50videos
BIODIVERSITY AND CONSERVATION
- BOOK - A2ZCHAPTER - BIOTECHNOLOGY AND ITS APPLICATION EXERCISE - Section C : PREVIOUS YEARS' EXAMINATIOIN QUESTIONS (Assertion and Reason Type Questions)4videos
BIOTECHNOLOGY AND ITS APPLICATION
Similar Questions
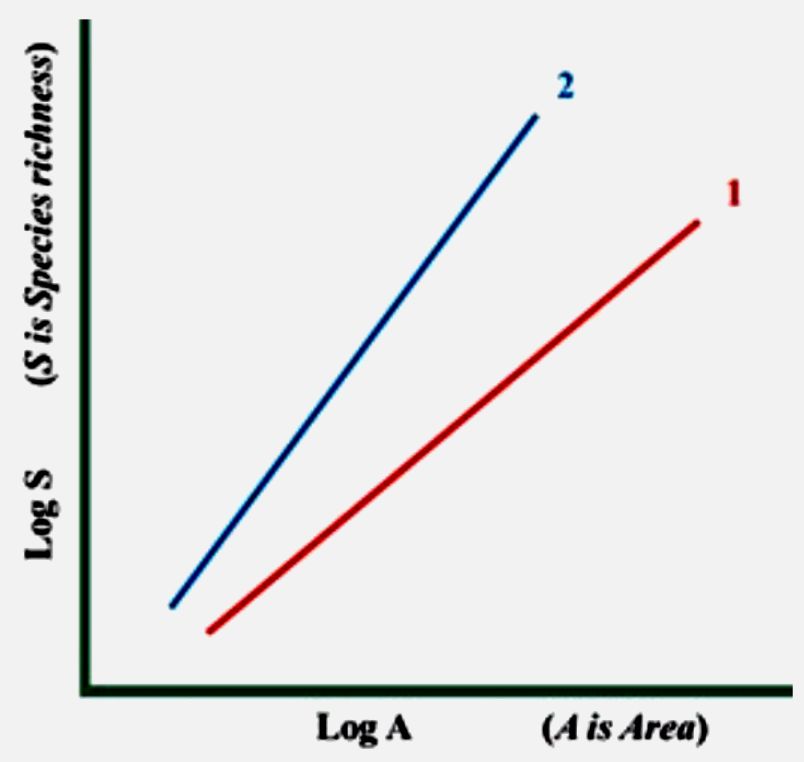
Observe the graph of area versus species richness and select the options that explain lines 1 and 2.
 View Solution
Alexander von Humboldt is associated with
(a.) species - area relationship
(b.) log S = log C + z logA
(C.) Within a region , species richness increases with the increasing limited explored area.
(d.) Increased diversity contributes to higher productivity.
(e.) Species diversity increases with the loss of keystone species.View Solution
Knowledge Check
- Question 1 - Select One
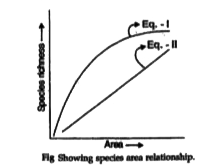
The great German naturalist and geographer Alexander von Humboldt observed that within a region species richness increased with increasing explored area, but only up to a limit. In fact, relation between species richness and area for a wide variety of taxa (angiosperm plants, birds, bats, freshwater fi ishes) turns out to be a rectangular hyperbola. Now find out correct equations shown in the graph.
 AI - S−CAZ II -LogS=logC+ZlogABI - LogS=logC+ZlogA, II - S−CAZCI - S−CAZ+logC, II - LogS=logC+ZlogADI - S−CAZ+logA, II - LogS=logC+ZlogA
 - Question 2 - Select One
Which of the statement are in accordance with the observation of geographer Alexander von Humboldt ?
I. Within a region species, richness increases with increasing explored area but within a limit.
II. The relation between species richness and area is a rectangular hyperbole.
III. The richness of species decreases with the increasing explored area.
IV. There is no relation between the explored area and species richness .AI and II onlyBI , III and IVCII and IVDII and III - Question 3 - Select One
Who observed that 'within a region, species richess icreased with increasing explored area but only upto a limit'
AEdward WilsonBAlexandor Von HumboldtCRobert contanzaDE. Hackel
Assertion : All our major food crops are derived from domesticated varieties.
Reason : Better management practices and increases in acreage can increases yield, but only to a limited extent.View SolutionAssertion Upto elastic limit of a stress-strain curve, the steel wire tends to regain its original shape when stress is removed.
Reason Within elastic limit, the wire follows Hooke's law.View SolutionThe region or part of root that increases the sruface area for water absorption is
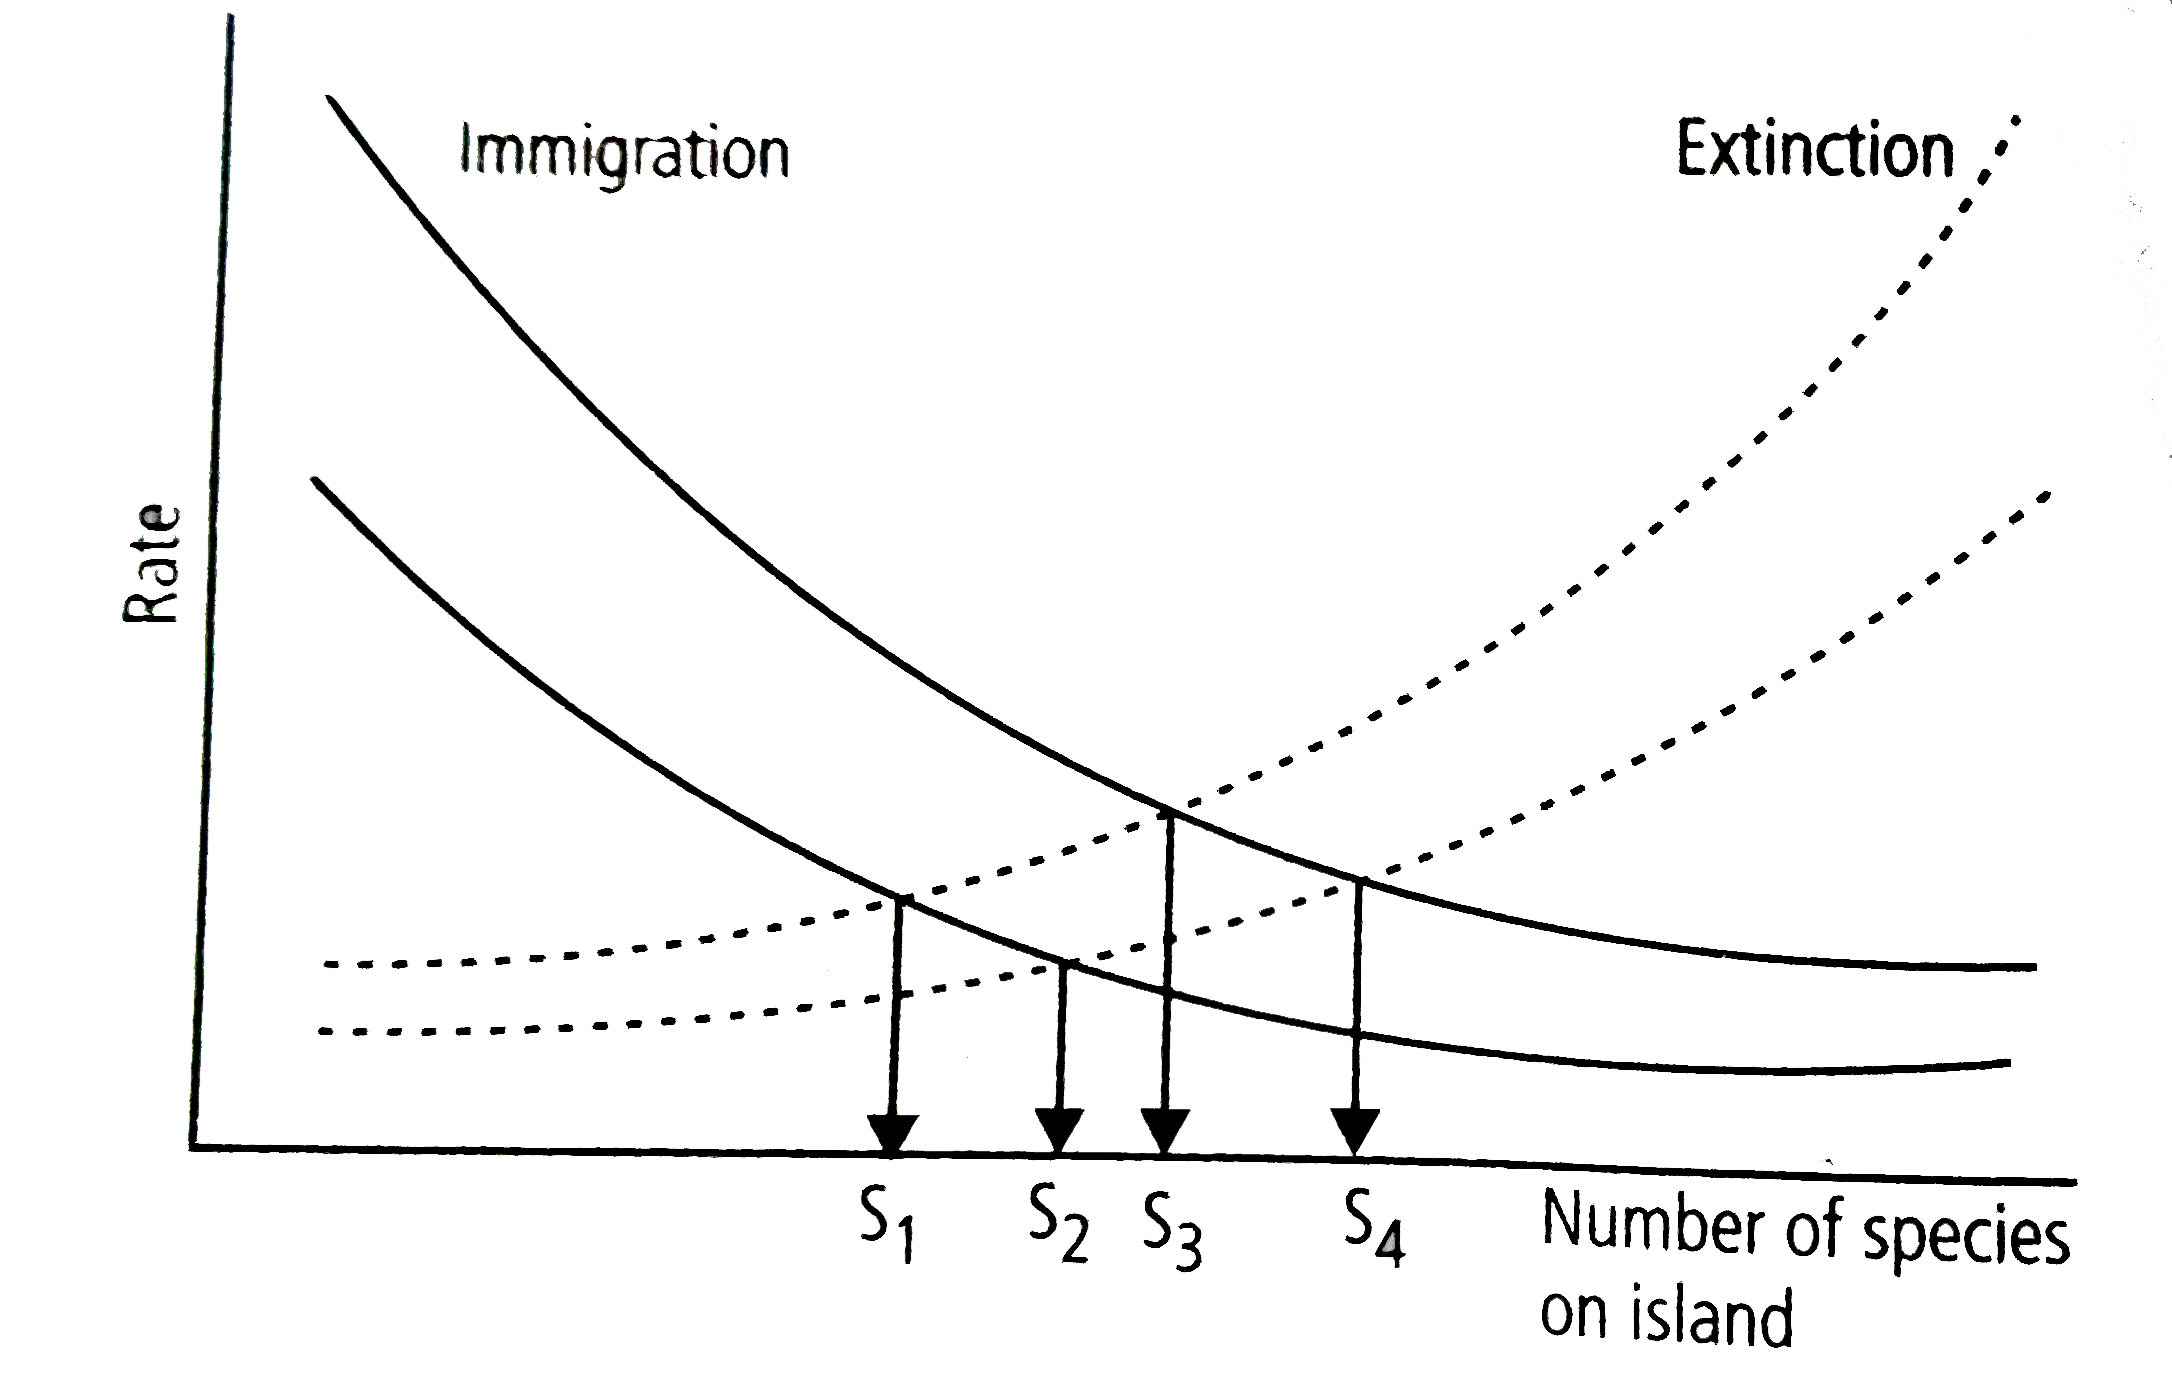
View SolutionIsland biogeography theory states that the number of species on an island is determined by immigration rates of new species to the island and extinction rates of species on the island. Immigration rates to an island decline as its distance from the mainland increases adn extinction rates decreases with increasing island size. when the immigration and extinction rates on an island are equal, the number of species on the island reaches equilibrium.

Which of the following gives the correct combination of distance (near and far) and area (small and large of islands where species (S1−S4) occur ?View SolutionThe magnetic field within cylindrical region whose cross - section is indicated starts increasing at a constant rate α tesla/sec . The graph showing the variation of induced field with distance r from the axis of cylinder is :
 View Solution

