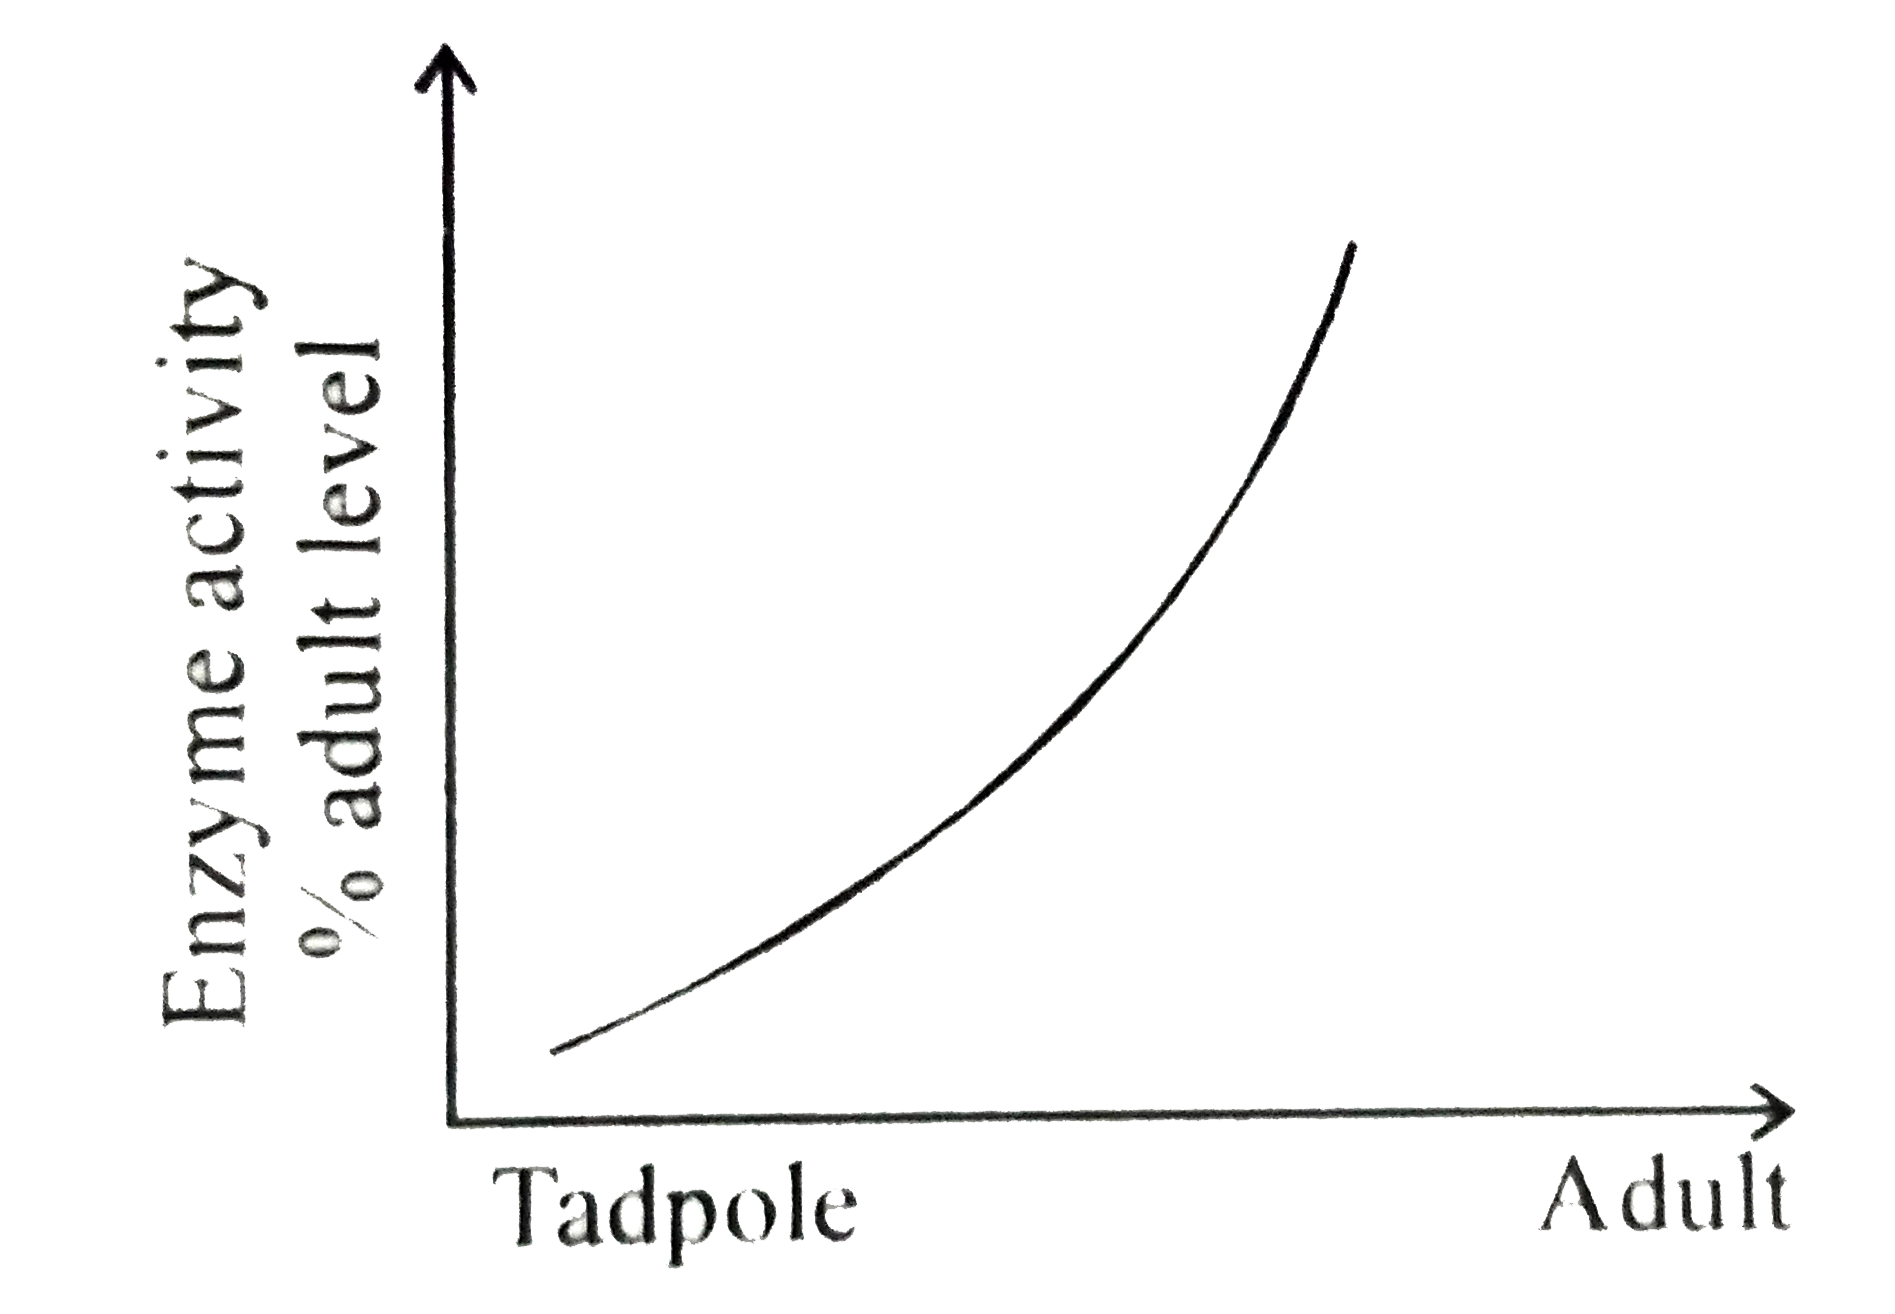
Graph depicts the concentration of enzymes involved in urea synthesis in a developing tadpole. It indicates a transition from :

Aminotelism to uricotelism
Ammonotelism to ureotelism
Uricotelism to ureotelism
Ureotelism to reocotelism
The correct Answer is:2
Step by step video, text & image solution for Graph depicts the concentration of enzymes involved in urea synthesis in a developing tadpole. It indicates a transition from : by Biology experts to help you in doubts & scoring excellent marks in Class 12 exams.
Similar Questions
Knowledge Check
- Question 1 - Select One
Presence of gills in the tadpole of from indicates that
Afishes were amphibions in the pastBfishes evolved from frog-like ancestorsCfrogs will have gills in futureDfrogs evolved from gilled ancestors - Question 2 - Select One
Other than DNA polymerase, which of the following enzymes involved in DNA synthesis ?
ATopoisomeraseBHelicaseCRNA primaseDall of these. - Question 3 - Select One
IAA is derived from or which of the following is involved in the synthesis of a plant hormone IAA ?
ATryptophanBTyrosineCPhenylalanineDNone of these
Indicators involved in Human Development Index (HDI)
View Solutionwhich of the following cell organells is involved in the synthesis of the cell organelle that contains hydrolytic enzymes?
View SolutionThe basic procedure involved in the synthesis of recombinanat DNA molecule is depicted below. The mistake in the procedure is
 View Solution
Determine the element from the following description.
(I) Activate enzyme of photosynthesis and respiration
(II) Involved in the synthesis of DNA and RNA
(III) Help to maintain structure of ribosomeView SolutionThe graph between displacement and time in a motion along straight line is depicted below. Which interval indicates that no force is acting on the particle?
 View Solution


