Two capacitors C1andC2 have the same separation between the plates but the plate area of C2 is twice that of C1. The given graph shows the variation of q with V. Which of the two lines in the graph represents C1 and why?
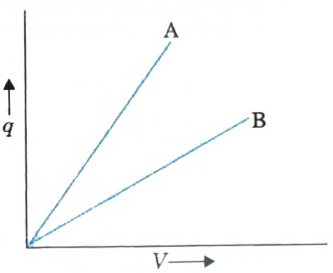
C=ε0Ad, as area of plates of C2 is double than that of C1
∴C2>C1,C∝q
∴ The line A represents C2, and line B represents C1.
Topper's Solved these Questions
- ELECTROSTATIC POTENTIAL AND CAPACITANCE Book:MODERN PUBLICATIONChapter:ELECTROSTATIC POTENTIAL AND CAPACITANCE Exercise:Revision Exercises (Long Answer Questions)
Explore 13 Videos
- ELECTROSTATIC POTENTIAL AND CAPACITANCE Book:MODERN PUBLICATIONChapter:ELECTROSTATIC POTENTIAL AND CAPACITANCE Exercise:Revision Exercises (Numerical Problems)
Explore 25 Videos
- ELECTROSTATIC POTENTIAL AND CAPACITANCE Book:MODERN PUBLICATIONChapter:ELECTROSTATIC POTENTIAL AND CAPACITANCE Exercise:Revision Exercises (Fill in the Blanks)
Explore 11 Videos
- ELECTROMAGNETIC WAVESBook:MODERN PUBLICATIONChapter:ELECTROMAGNETIC WAVESExercise:CHAPTER PRACTICE TEST
Explore 14 Videos
- MAGNETISM AND MATTERBook:MODERN PUBLICATIONChapter:MAGNETISM AND MATTERExercise:CHAPTER PRACTICE TEST FOR BOARD EXAMINATION
Explore 16 Videos
Similar Questions
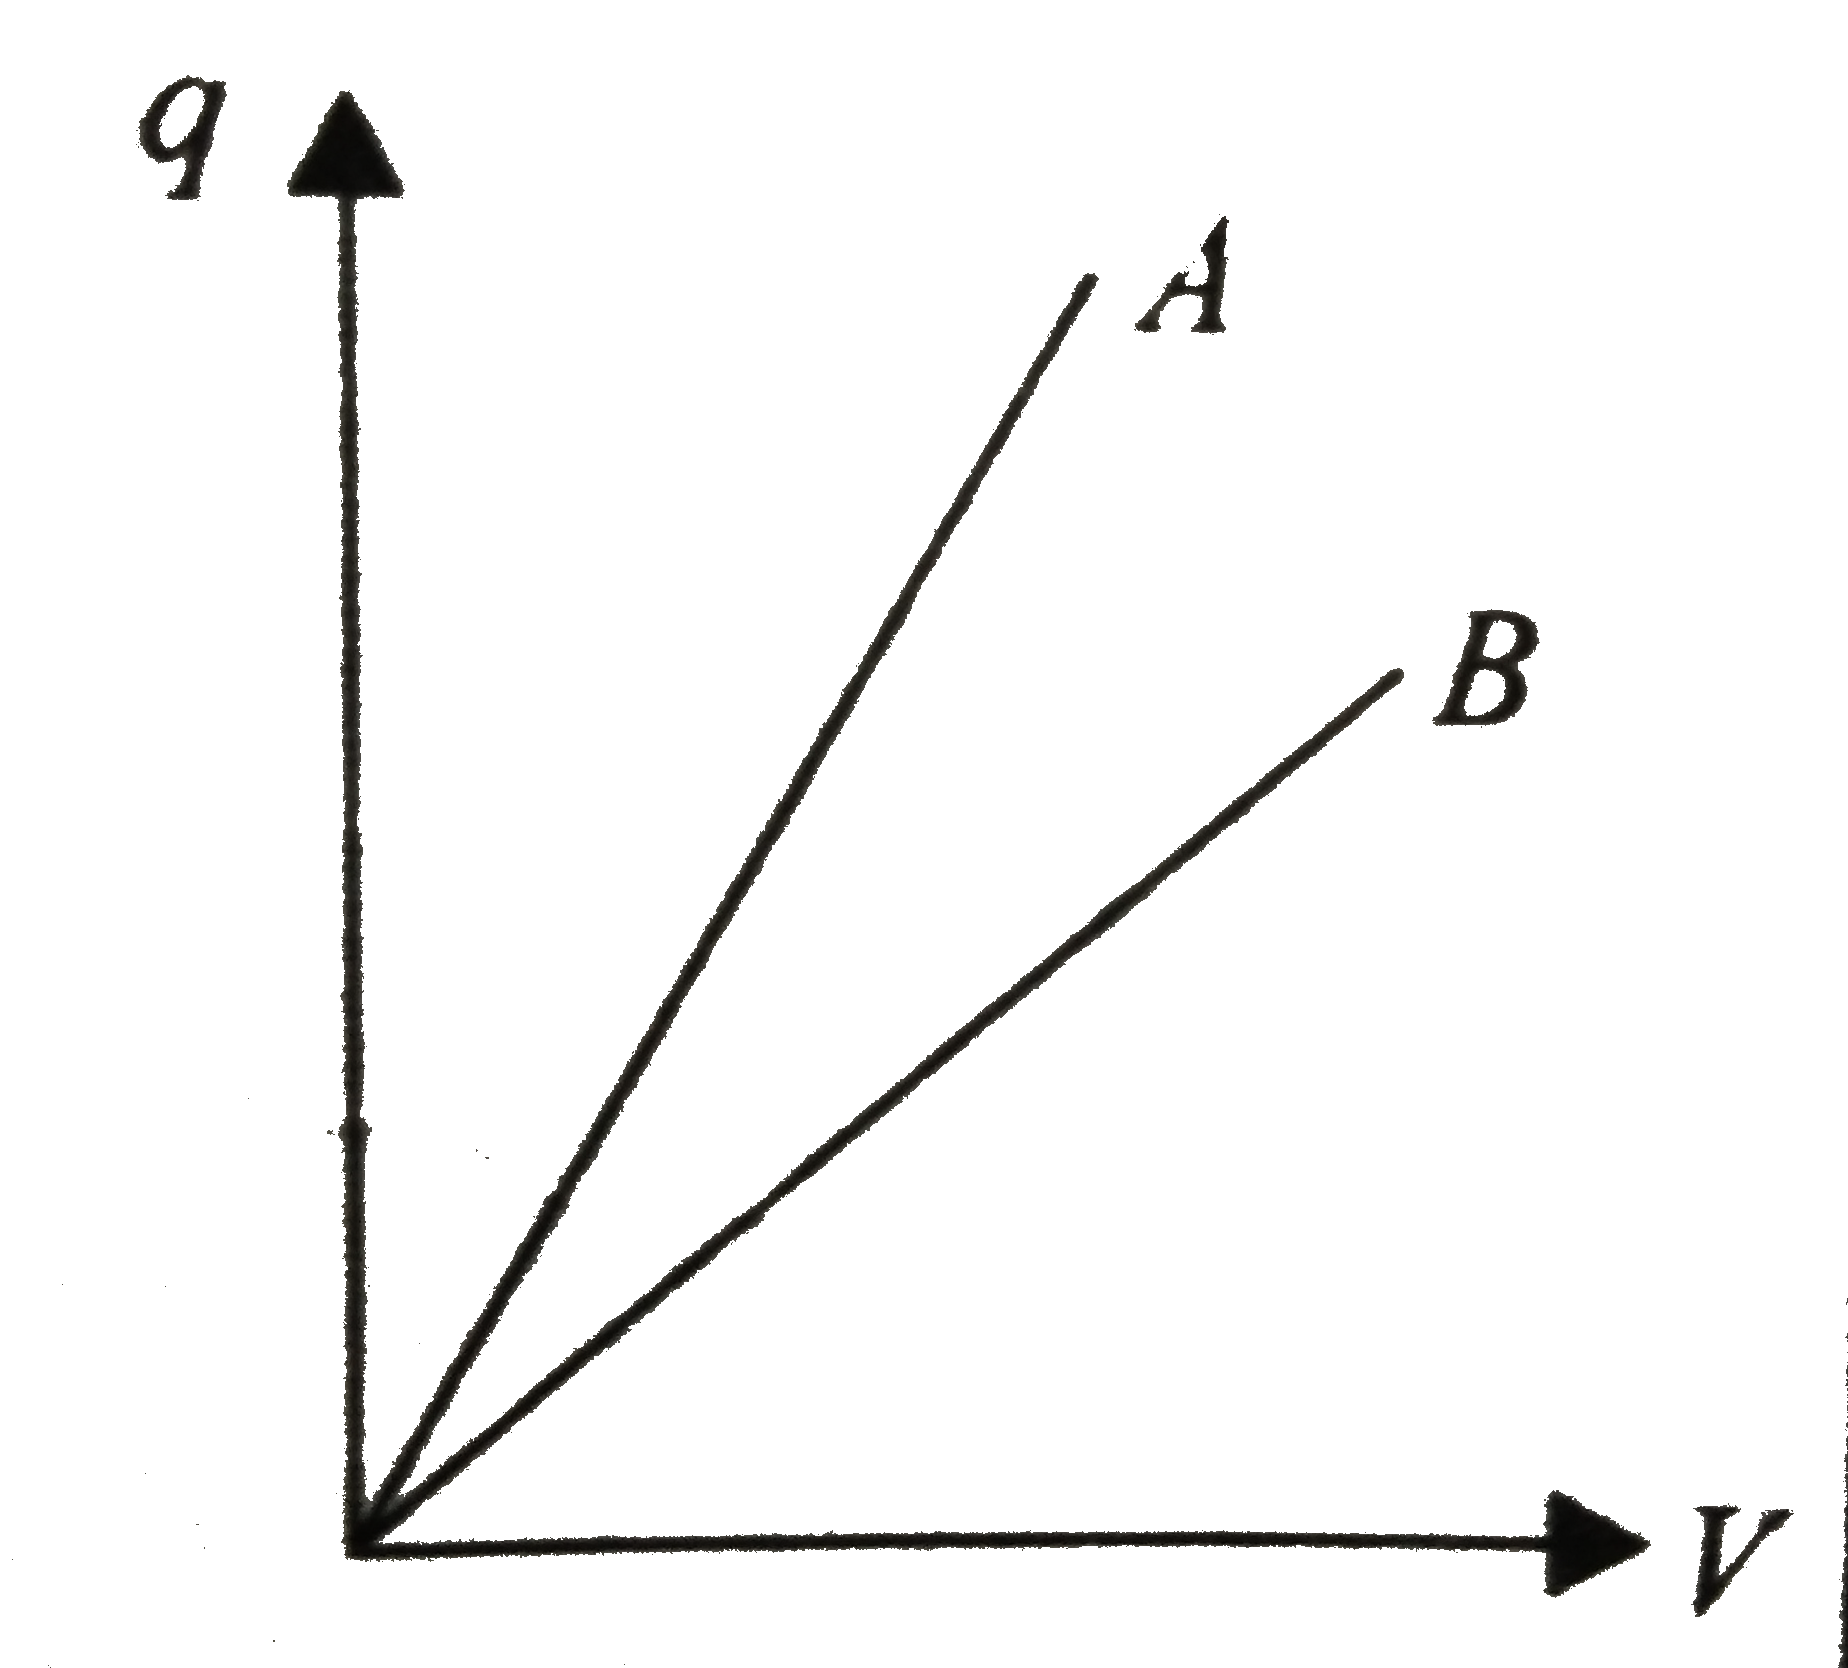
Shows these variation of charge q for two capacitors C1 and C2 The two capacitors have the same plate separation. But the plate area of C2 is double than that of C1. Which of the lines in the figure corresponds to C1 and C2 and why?
 .
.
View SolutionThe given graph in Fig. shows the variation of charge q versus potential difference for two capacitors C1andC2. The two capacitors have same plate sepration, but the plate area of C2 is double that of C1.
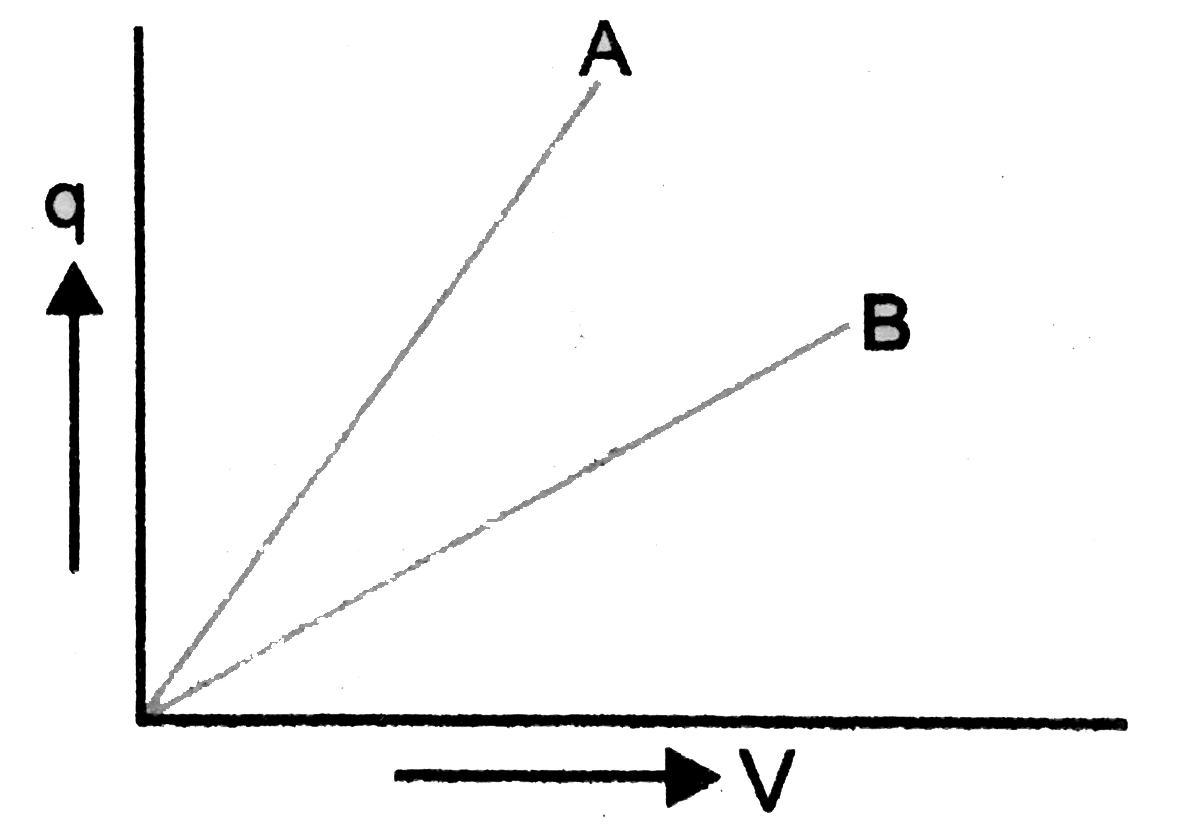
Which of the lines in the graph correspond to C1andC2 and why ?
View Solution
Knowledge Check
Two capacitors C1 and C2 are charged to same potential V, but with opposite polarity as shown in the figure. The switches S1 and S2 are then closed
 APotential difference across two capacitors are same and is given by (C1−C2)VC1+C2BPotential difference across two capacitors are same and is given by (C1+C2C1−C2)VCRatio of final energy to initial energy of the system is given by (C1−C2)2(C1+C2)2DRatio of final energy to initial energy of the system is given by (C1)2(C1+C2)2
Two capacitors C1andC2 are charged to the same potential V, but with opposite polarity as shown in the figure. The switch S1andS2 are then closed.
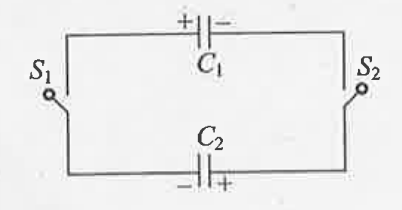 APDs across. Two capacitors are the same and is given by (C1−C2)V(C1+C2)BPDs across two capacitors are the same and is given by C1V(C1+C2)CRatio of final energy to initial energy of the system is ((C1−C2)(C1+C2))2DRatio of final energy to initial energy of the system is ((C1)(C1+C2)2)
Two capacitors C1 and C2 are connected in a circuit as shown in figure. The potential difference (VA−VB) is
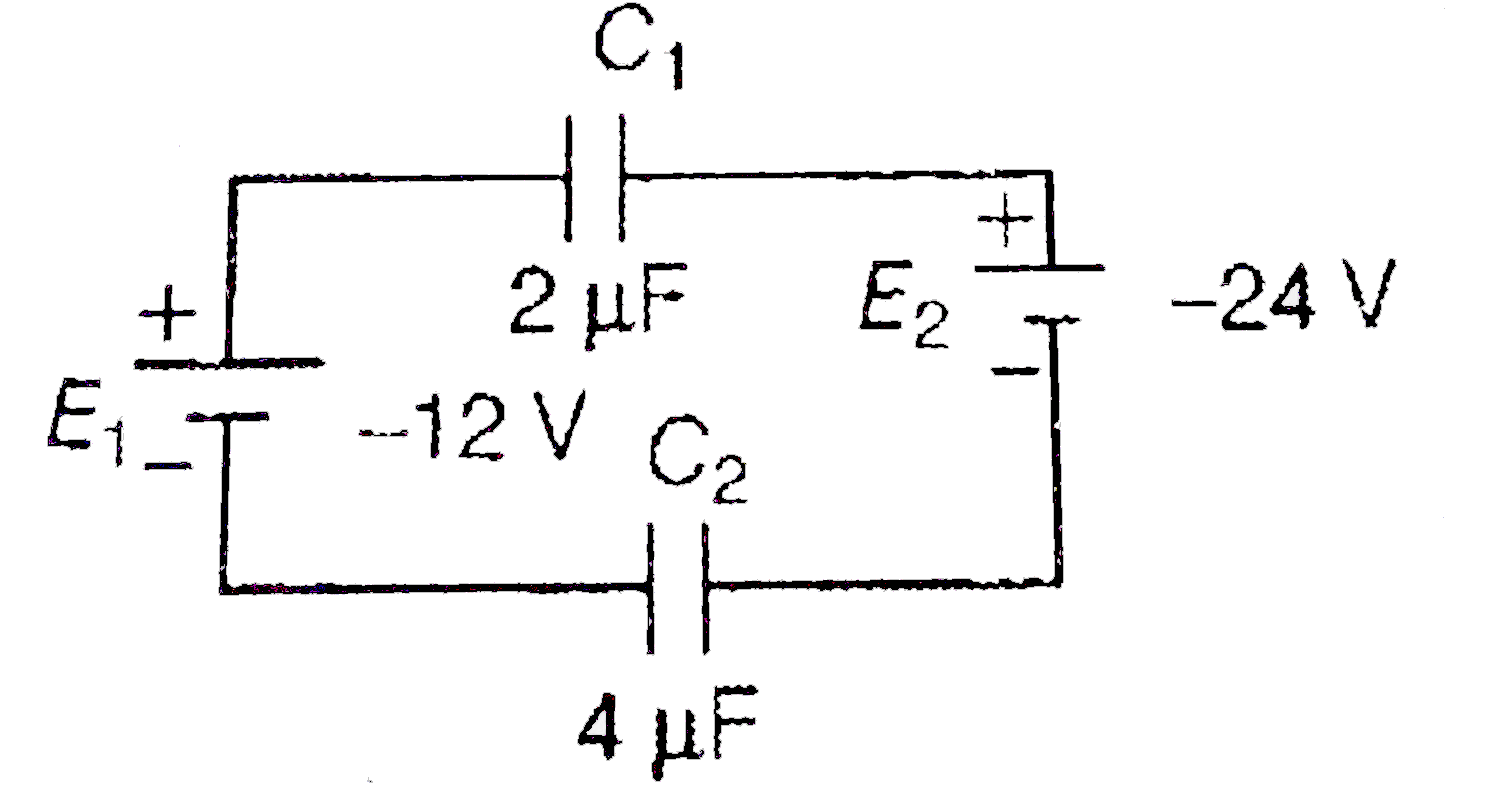 A8VB−8VC12VD12V
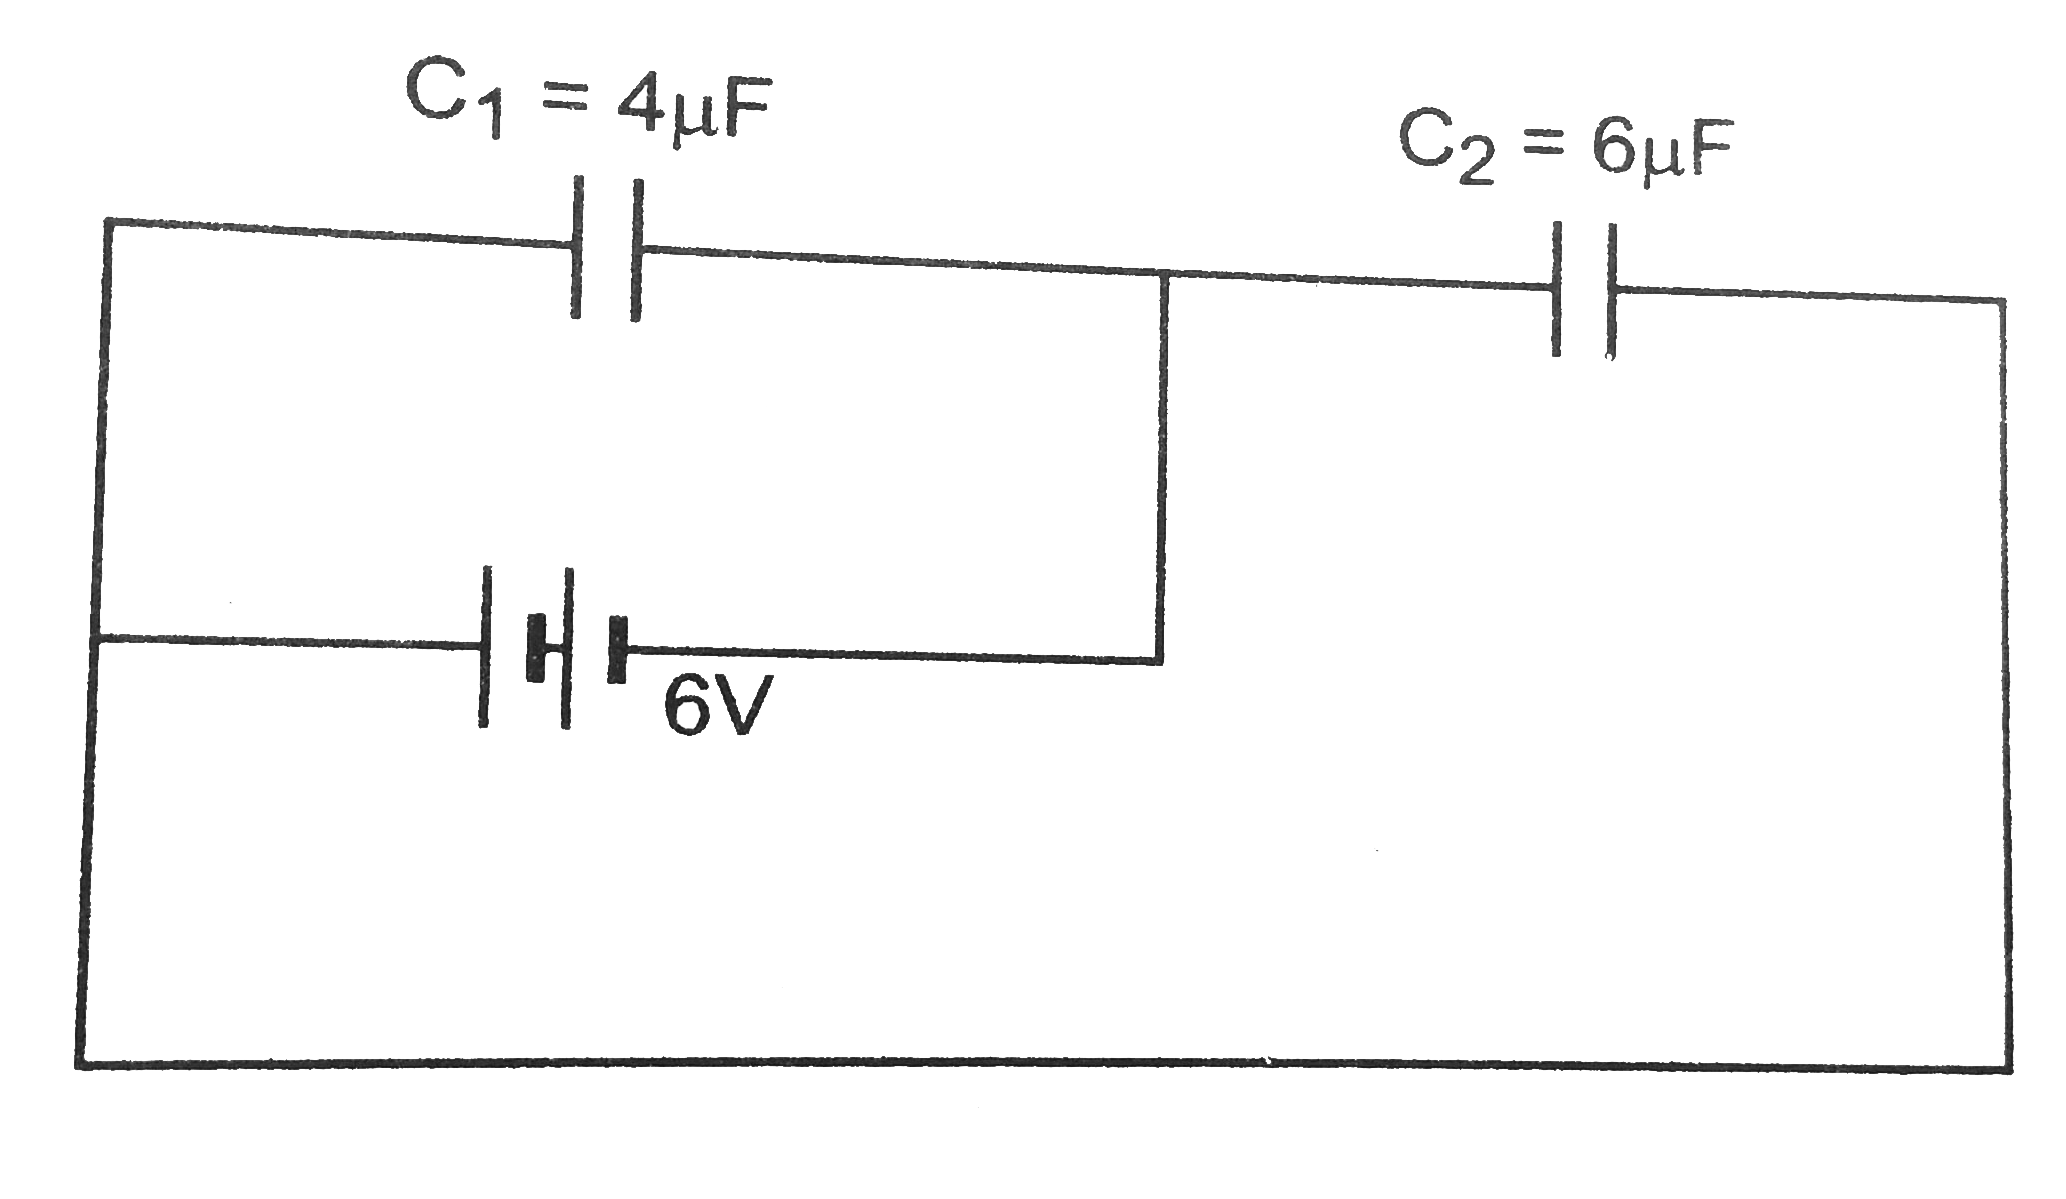
Two capacitors C1 and C2 are connected to a battery of 6V as shown in Fig. Find the charge on each capacitor.
View SolutionTwo capacitors of capacity C1andC2 are connected in series. The combined capacity C is given by
View SolutionAn air parallel plate capacitor has capacity C. When the area and distance between the plates is doubled, the capacitance is C1, then C1C is -
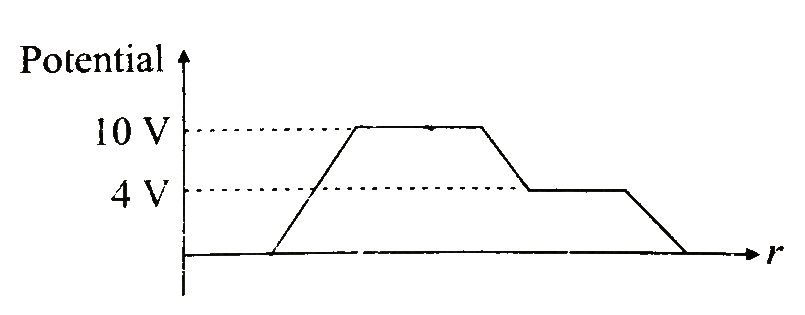
View SolutionFigure shows two capacitors C1andC2 connected with 10 V battery and terminal A and B are earthed. The graphs shows the variation of potential as one moves from left to right. Then the ratio C1/C2 is
View SolutionTwo capacitors C1 and C2 in a circuite are joined as shown. If VA=V1,VB=V2, the potemntial of point P is

View Solution

