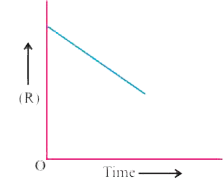
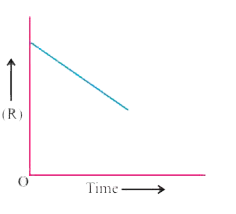
For chemical reaction R→P the variation in the concentration (R ) vs .Time (t) plot given as
(i) predict the order of the reaction
(ii) what is he slope of the curve?
To solve the problem, we need to analyze the given information about the chemical reaction R→P and the concentration vs. time plot.
1. Understanding the Plot:
The plot of concentration of reactant R versus time t is provided. We need to determine the order of the reaction based on the characteristics of this plot.
2. Identifying the Order of Reaction:
- If the plot of concentration (R) vs. time t is a straight line, it indicates that the reaction is a zero-order reaction. This is because, for zero-order reactions, the concentration decreases linearly with time.
- The general integrated rate law for a zero-order reaction is given by:
(R)=(R)0−kt
where (R)0 is the initial concentration, k is the rate constant, and t is time.
3. Determining the Slope:
- The slope of the line in the plot of (R) vs. t can be derived from the equation of a straight line y=mx+c.
- Here, y corresponds to (R), x corresponds to t, and c is the intercept which represents the initial concentration (R)0.
- From the equation (R)=(R)0−kt, we can see that the slope m is equal to −k.
- Therefore, the slope of the curve is −k.
Final Answers:
(i) The order of the reaction is zero-order.
(ii) The slope of the curve is −k.
---
The plot of concentration of reactant R versus time t is provided. We need to determine the order of the reaction based on the characteristics of this plot.
- If the plot of concentration (R) vs. time t is a straight line, it indicates that the reaction is a zero-order reaction. This is because, for zero-order reactions, the concentration decreases linearly with time.
- The general integrated rate law for a zero-order reaction is given by:
(R)=(R)0−kt
where (R)0 is the initial concentration, k is the rate constant, and t is time.
- The slope of the line in the plot of (R) vs. t can be derived from the equation of a straight line y=mx+c.
- Here, y corresponds to (R), x corresponds to t, and c is the intercept which represents the initial concentration (R)0.
- From the equation (R)=(R)0−kt, we can see that the slope m is equal to −k.
- Therefore, the slope of the curve is −k.
(i) The order of the reaction is zero-order.
(ii) The slope of the curve is −k.
Topper's Solved these Questions
- XII BOARDSBook:XII BOARDS PREVIOUS YEARChapter:XII BOARDSExercise:Outside Delhi : SET-II
Explore 13 Videos
- XII BOARDSBook:XII BOARDS PREVIOUS YEARChapter:XII BOARDSExercise:Outside Delhi : SET-III
Explore 14 Videos
- XII BOARDSBook:XII BOARDS PREVIOUS YEARChapter:XII BOARDSExercise:C.B.S.E. CLASS - XII
Explore 30 Videos
- SAMPLE PAPER 2019Book:XII BOARDS PREVIOUS YEARChapter:SAMPLE PAPER 2019Exercise:SECTION: D
Explore 1 Video
Similar Questions
Knowledge Check
For the reaction A+B→C+D The variation of the concentration of the products is given by the curve
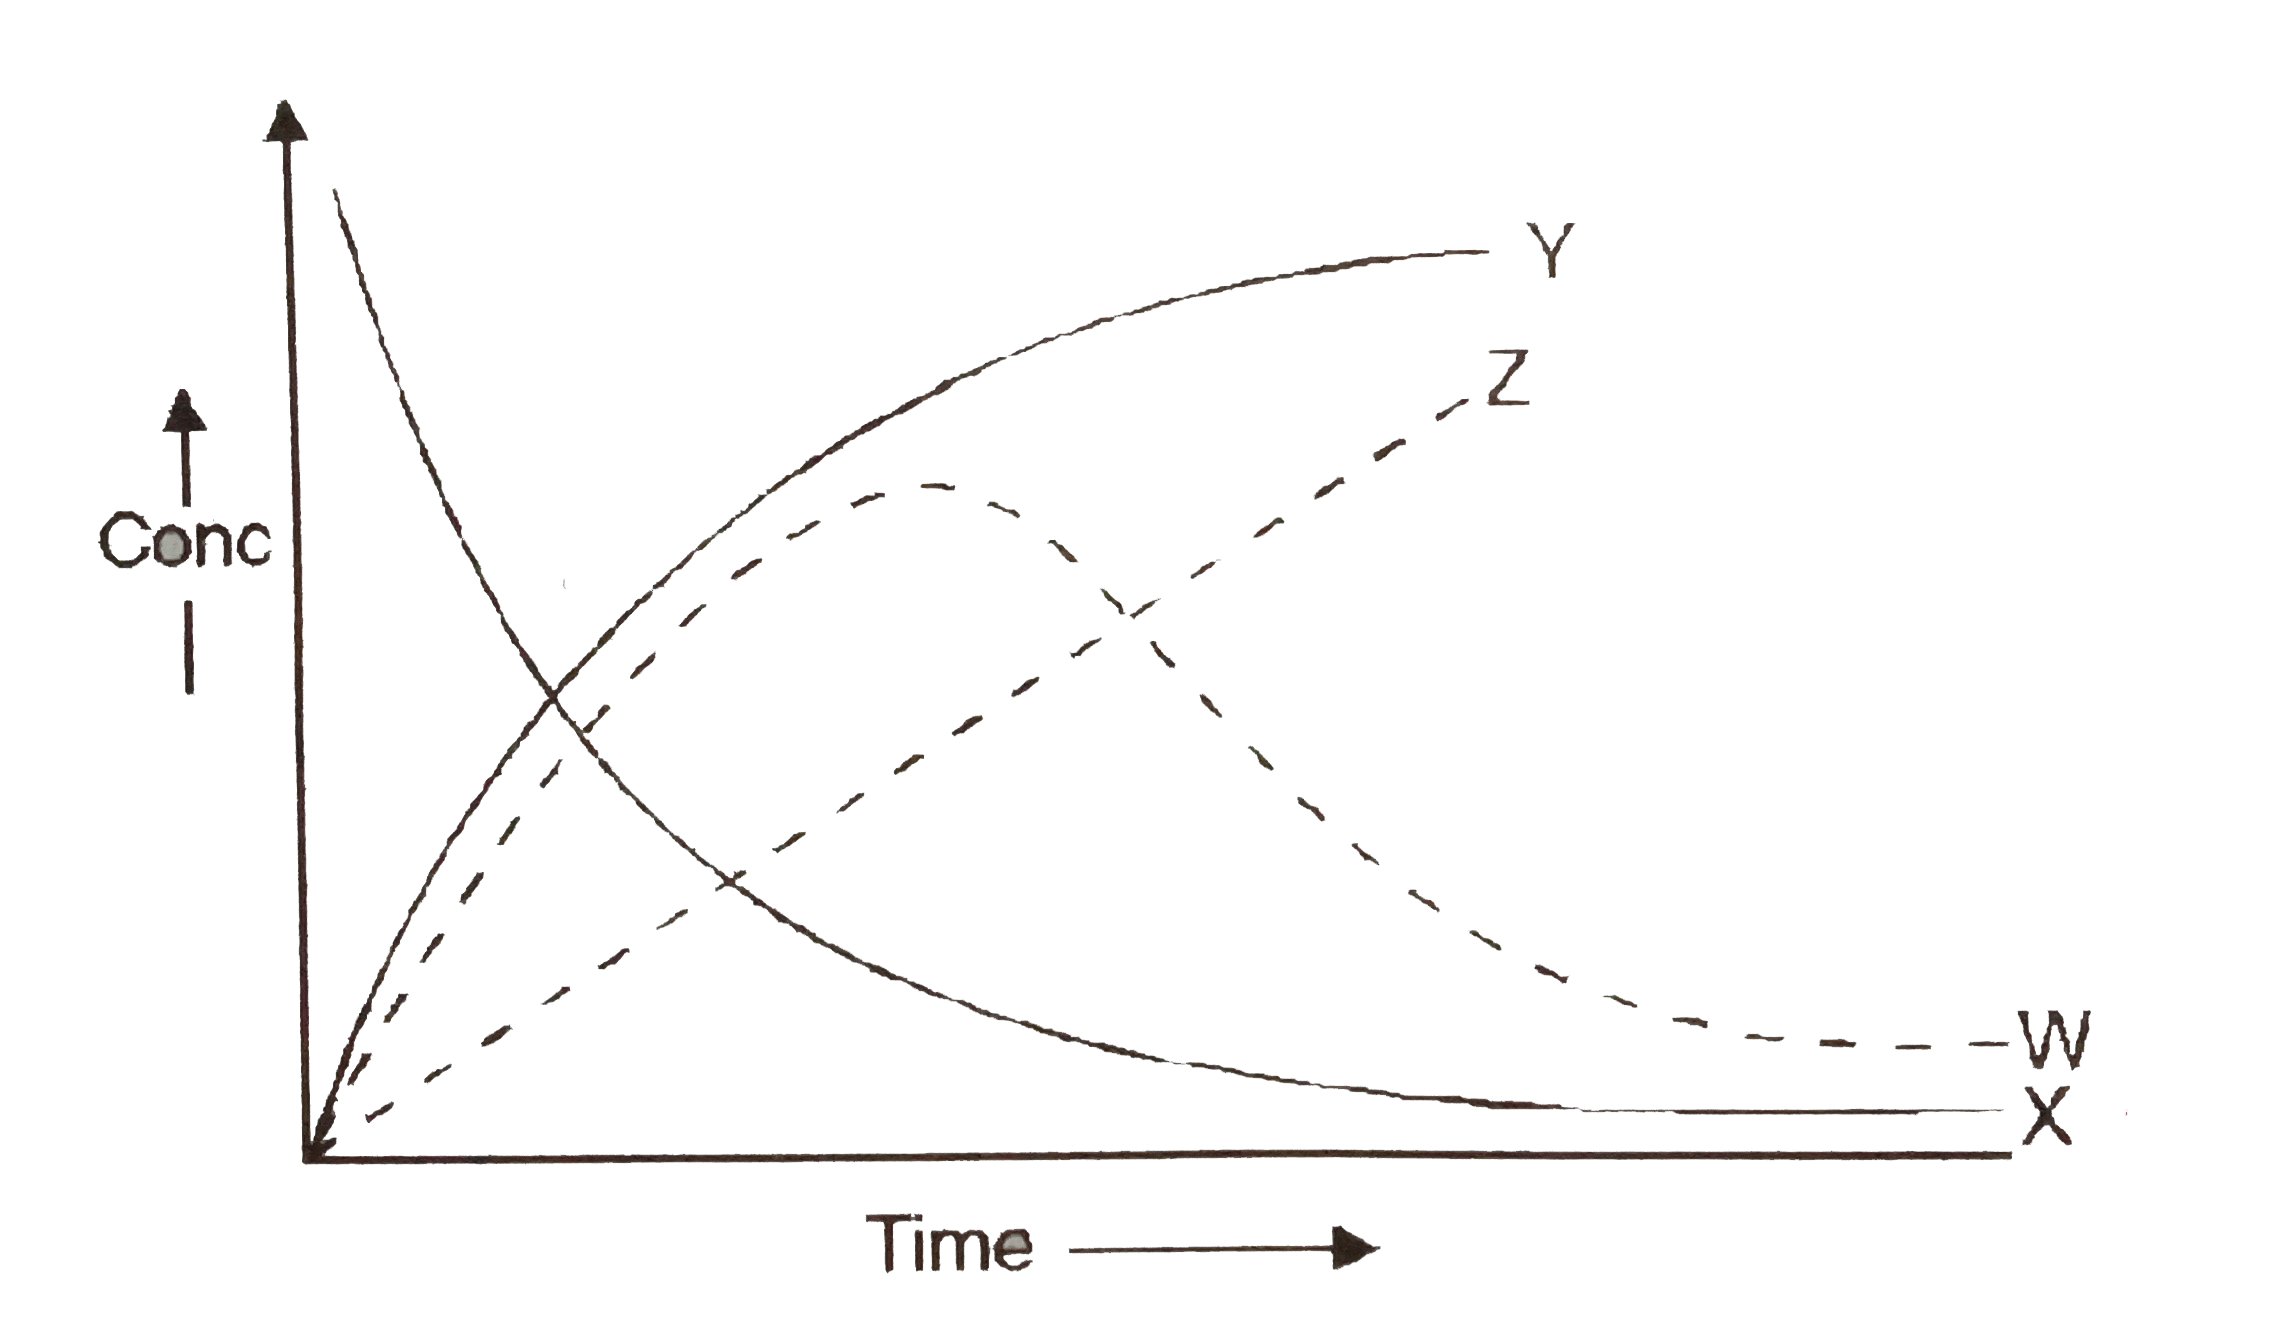 AXBYCWDZ
For a chemical reaction R → P, the variation in the concentration (R) vs time (t) plot is given :
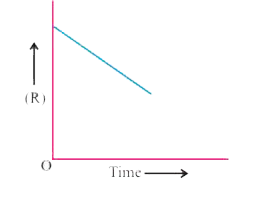
Write down its rate law.
View Solution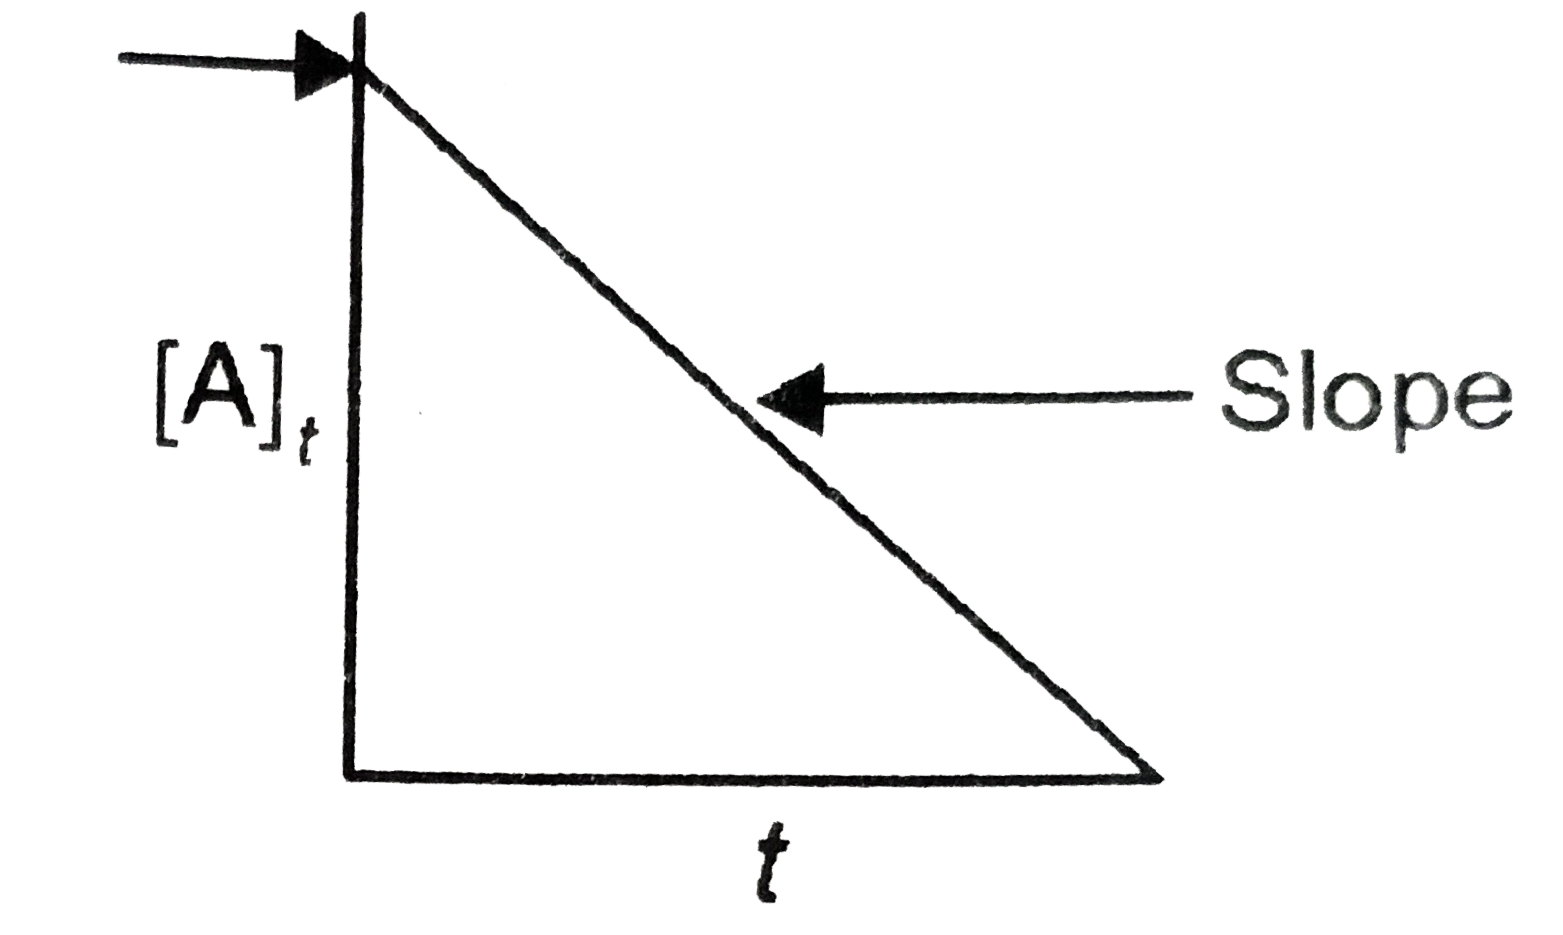
For a certain chemical reaction variation in concentration [A] vs. time (s) plot is given below :
(i) Predict the order of the given reaction ?
(ii) What does the slope of the time and intercept indicate ?
(iii) What is the unit of rate constant k?
View SolutionFor a chemical reaction, variation in concentration [A] vs time (s) plot in given below:
i) Predict the order of the reaction.
ii) What does the slope of the line and intercept indicate ?
iii) What is the unit of rate constant(k)?
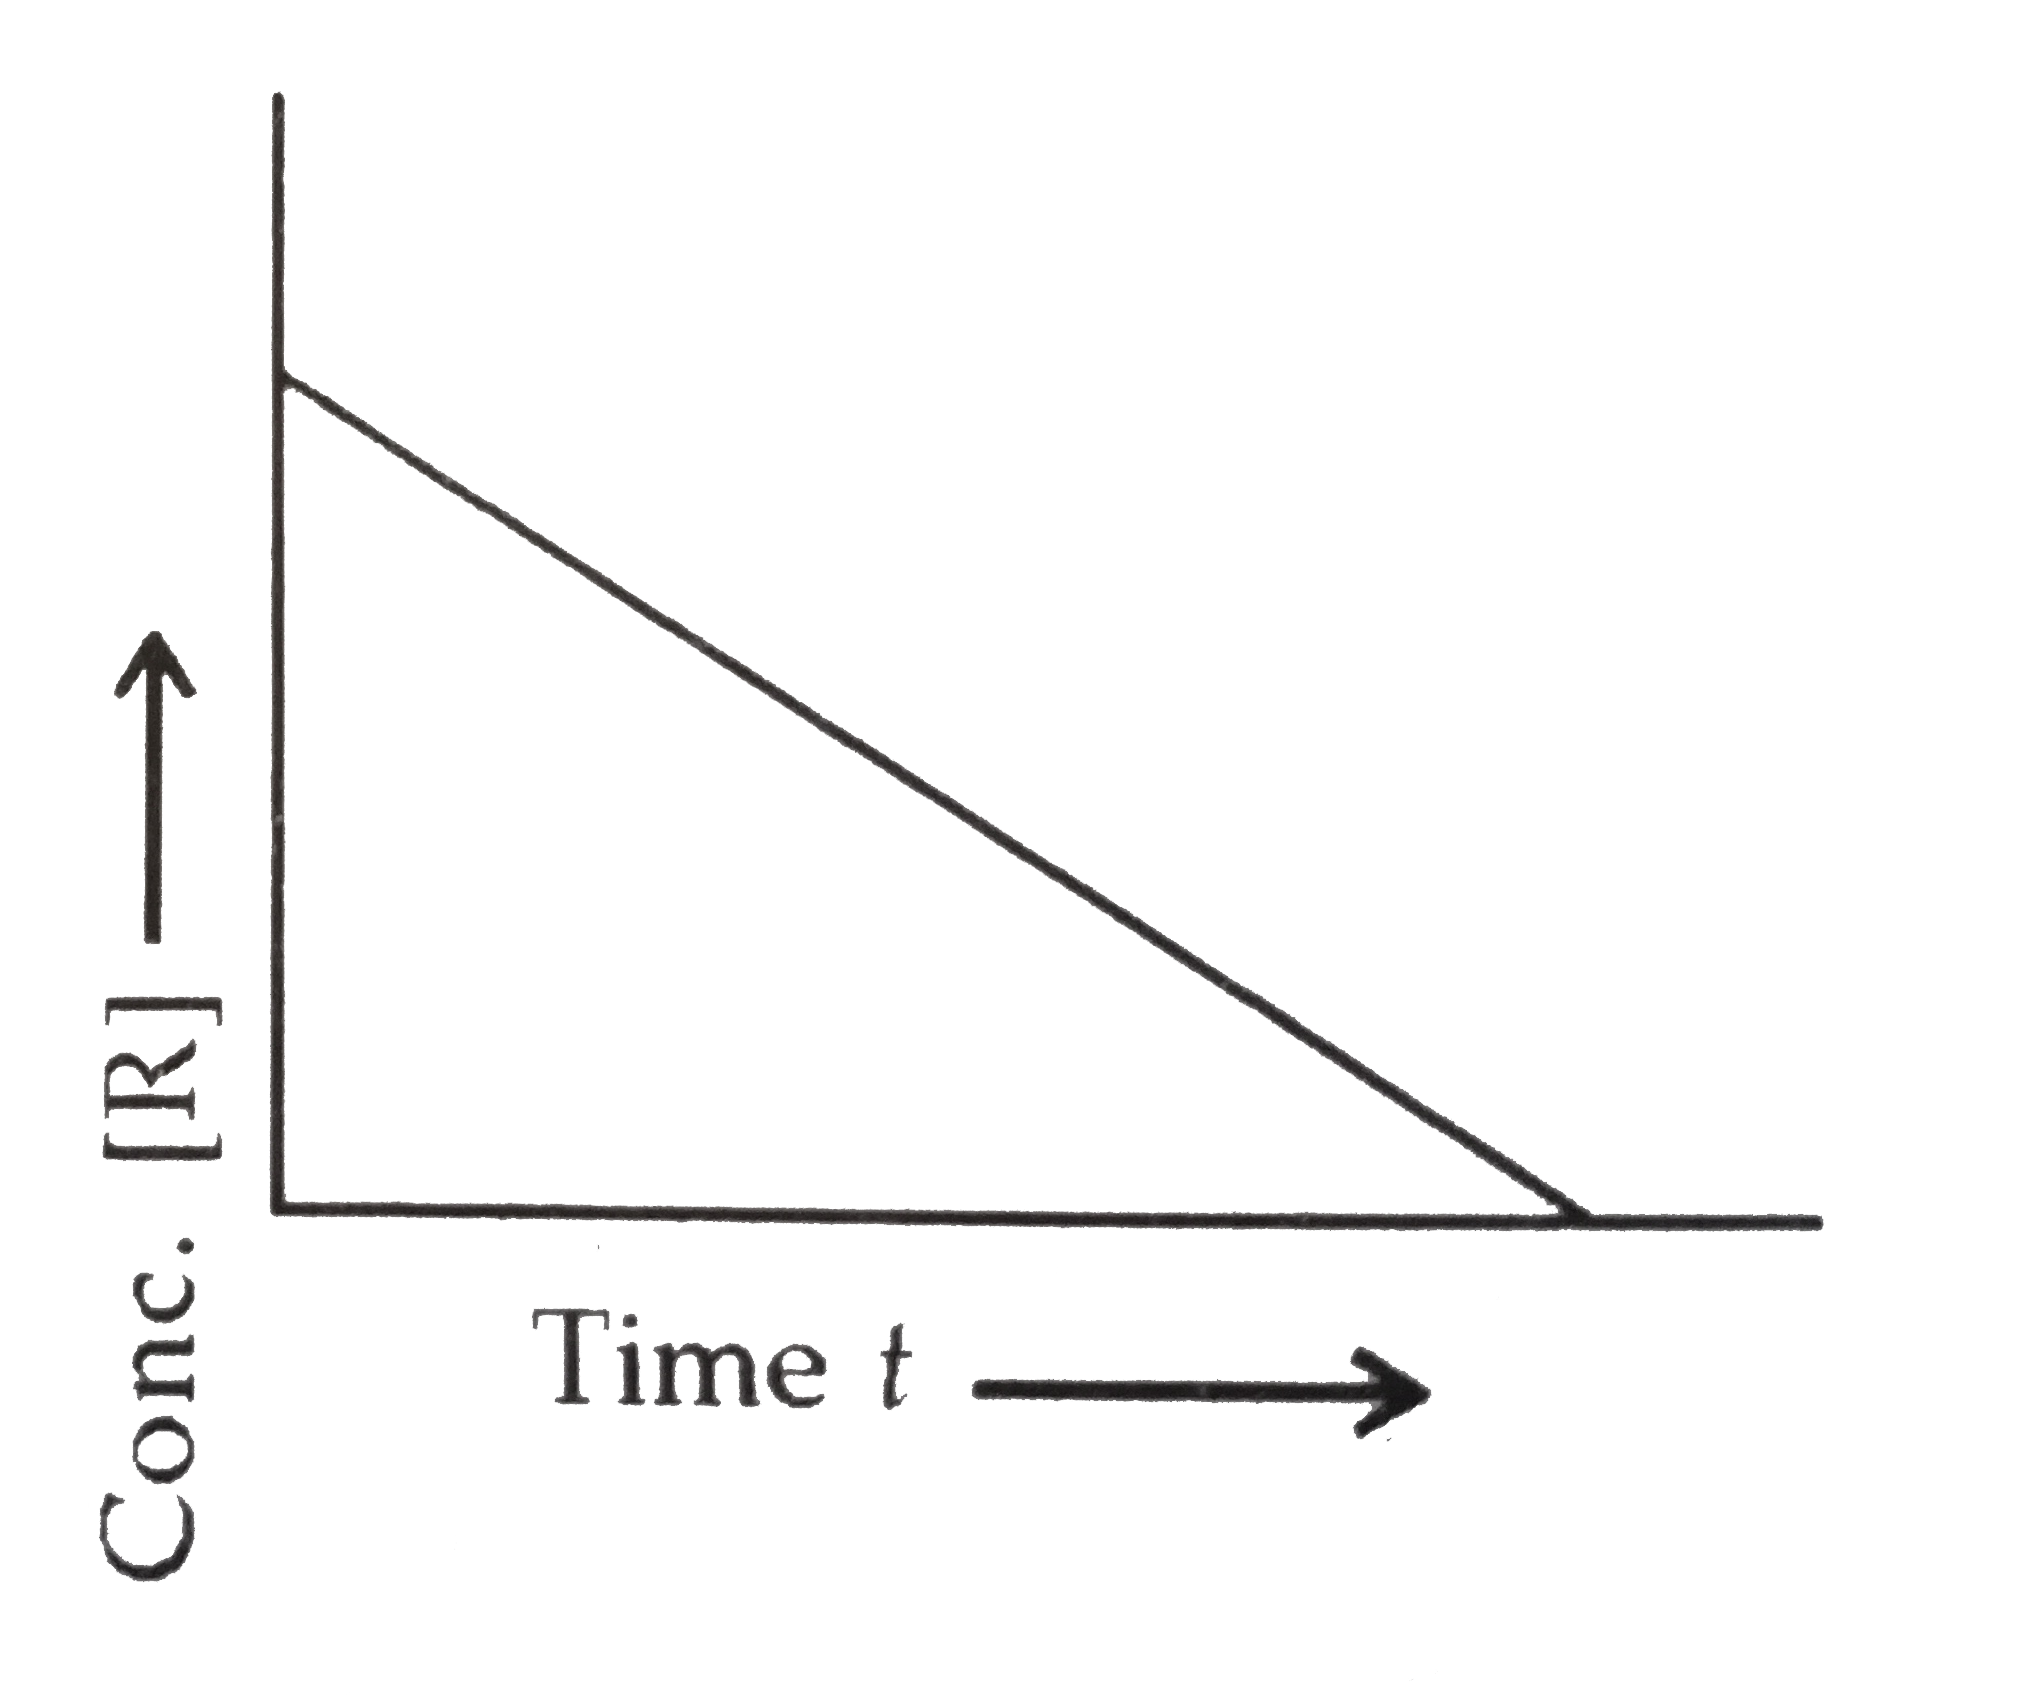
View SolutionFor a chemical reactin R → P, variation of concentration of R vs time plot is given below : For this reaction :
(i) Predict the order of reaction.
(ii) What is the unit of rate constant (k) ?
View SolutionFor a chemical reaction, variation in concentration , in [R] vs time (min) plot is shown:
i) What is the order of the reaction?
ii) What are units of rate constant, k for reaction?

View SolutionFor a chemical reactio , variation in the concentration [R] Vs time (s) plot is given:
For this chemical reaction, write/draw:
i) What is the order of the reaction?
ii) What are the units of the rate constant (k)?
iii) Give the relationship between k and t1/2 (half life period)
iv) What does the slope of the above line indicate?
v) Draw the plot log [R]0R Vs time (s).

View SolutionConsider the reaction R→P for which the change in concentration of R with time is shown by the following graph:
( i) Predict the order of reaction .
( iii) What does the slope of the curve indicate ?
( b) The rate of reaction quadruples when temperature chages from 293 K of 313 K .Calculate Ea assuming that it does not chage with time [R=8.314JK−1mol−1]
View Solution


