निचे दिए हुआ बंटन एक कक्षा के 30 विधार्थियों के भार दर्शा रहा हैं । विधार्थियों का मध्यक भार ज्ञात कीजिए:

The correct Answer is:56.67
Step by step video, text & image solution for निचे दिए हुआ बंटन एक कक्षा के 30 विधार्थियों के भार दर्शा रहा हैं । विधार्थियों का मध्यक भार ज्ञात कीजिए: by Maths experts to help you in doubts & scoring excellent marks in Class 10 exams.
Updated on:21/07/2023Topper's Solved these Questions
- सांख्यिकी BOOK - MBD HINDI-HARYANA BOARDCHAPTER - सांख्यिकी EXERCISE - प्रश्नावली 14.4
3 Videos
- सांख्यिकी BOOK - MBD HINDI-HARYANA BOARDCHAPTER - सांख्यिकी EXERCISE - अभ्यास के लिए प्रश्न
42 Videos
- सांख्यिकी BOOK - MBD HINDI-HARYANA BOARDCHAPTER - सांख्यिकी EXERCISE - प्रश्नावली 14.2
6 Videos
- समांतर श्रेढ़ीBOOK - MBD HINDI-HARYANA BOARDCHAPTER - समांतर श्रेढ़ीEXERCISE - लघु उत्तरात्मक प्रश्न
15 Videos
Similar Questions
निम्नलिखित बंटन किसी फैक्ट्री के 50 श्रमिकों की दैनिक आय दर्शाता हैं:
 उपरोक्त बंटन को एक कम प्रकार के संचयी बारंबारता बंटन में बदलिए और उसका तोरण खीचिए।
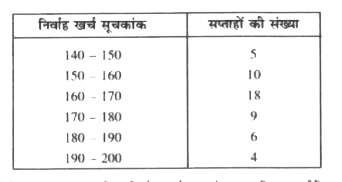
View Solutionवर्ष 1980-81 के लिए किसी नगर के साप्ताहिक निर्वाह खर्च सूचनांक निम्नानुसार हैं:

उपयुक्त विधि द्वारा माध्य साप्ताहिक निर्वाह खर्च सूचकांक का परिकलन कीजिए।
View Solutionनिम्नलिखित सारणी किसी अस्पताल में एक विशेष वर्ग में भर्ती हुए रोगियों की आयु को दर्शाती हैं:

उपरोक्त आँकड़ों के बहुलुक और माध्य ज्ञात कीजिए
View Solutionऐसे प्रथम 40 घन पूर्णांकों का योग ज्ञात कीजिए, जो 6 से विभाज्य हो |
View SolutionHow many lines of symmetry does the above figure have ?
View SolutionWhich of the following are correct chain isomers of butane ? (i)
View SolutionDetermine the point of symmetry of a regular hexagon.
View SolutionDtermine the images of the following figure about the given line :
View SolutionMatch the following Column A to Column B

View SolutionMatch the following Column A to Column B

View SolutionMatch the following Column A to Column B

View SolutionFind the area of the figure given below.

View SolutionThe area of the shaded part in the figure given below is ______.

View SolutionThe inequation represented by the graph given below is :
View SolutionThe inequation that best describes the graph given below is _________
View SolutionThe inequation that best describes the following graph is _________
View Solution
