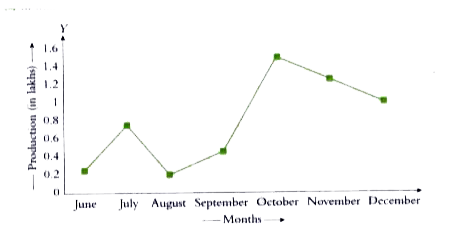
The line graph given below shows the production of a particular model of bike [roduced in different months. Read the line graph and answer the following questions :
(a) In which month is the production maximum ?
(b) In which month is the production least ?
(c) In which two successive months has the production increased ?
(d) In which two successive months has the production decreased ?
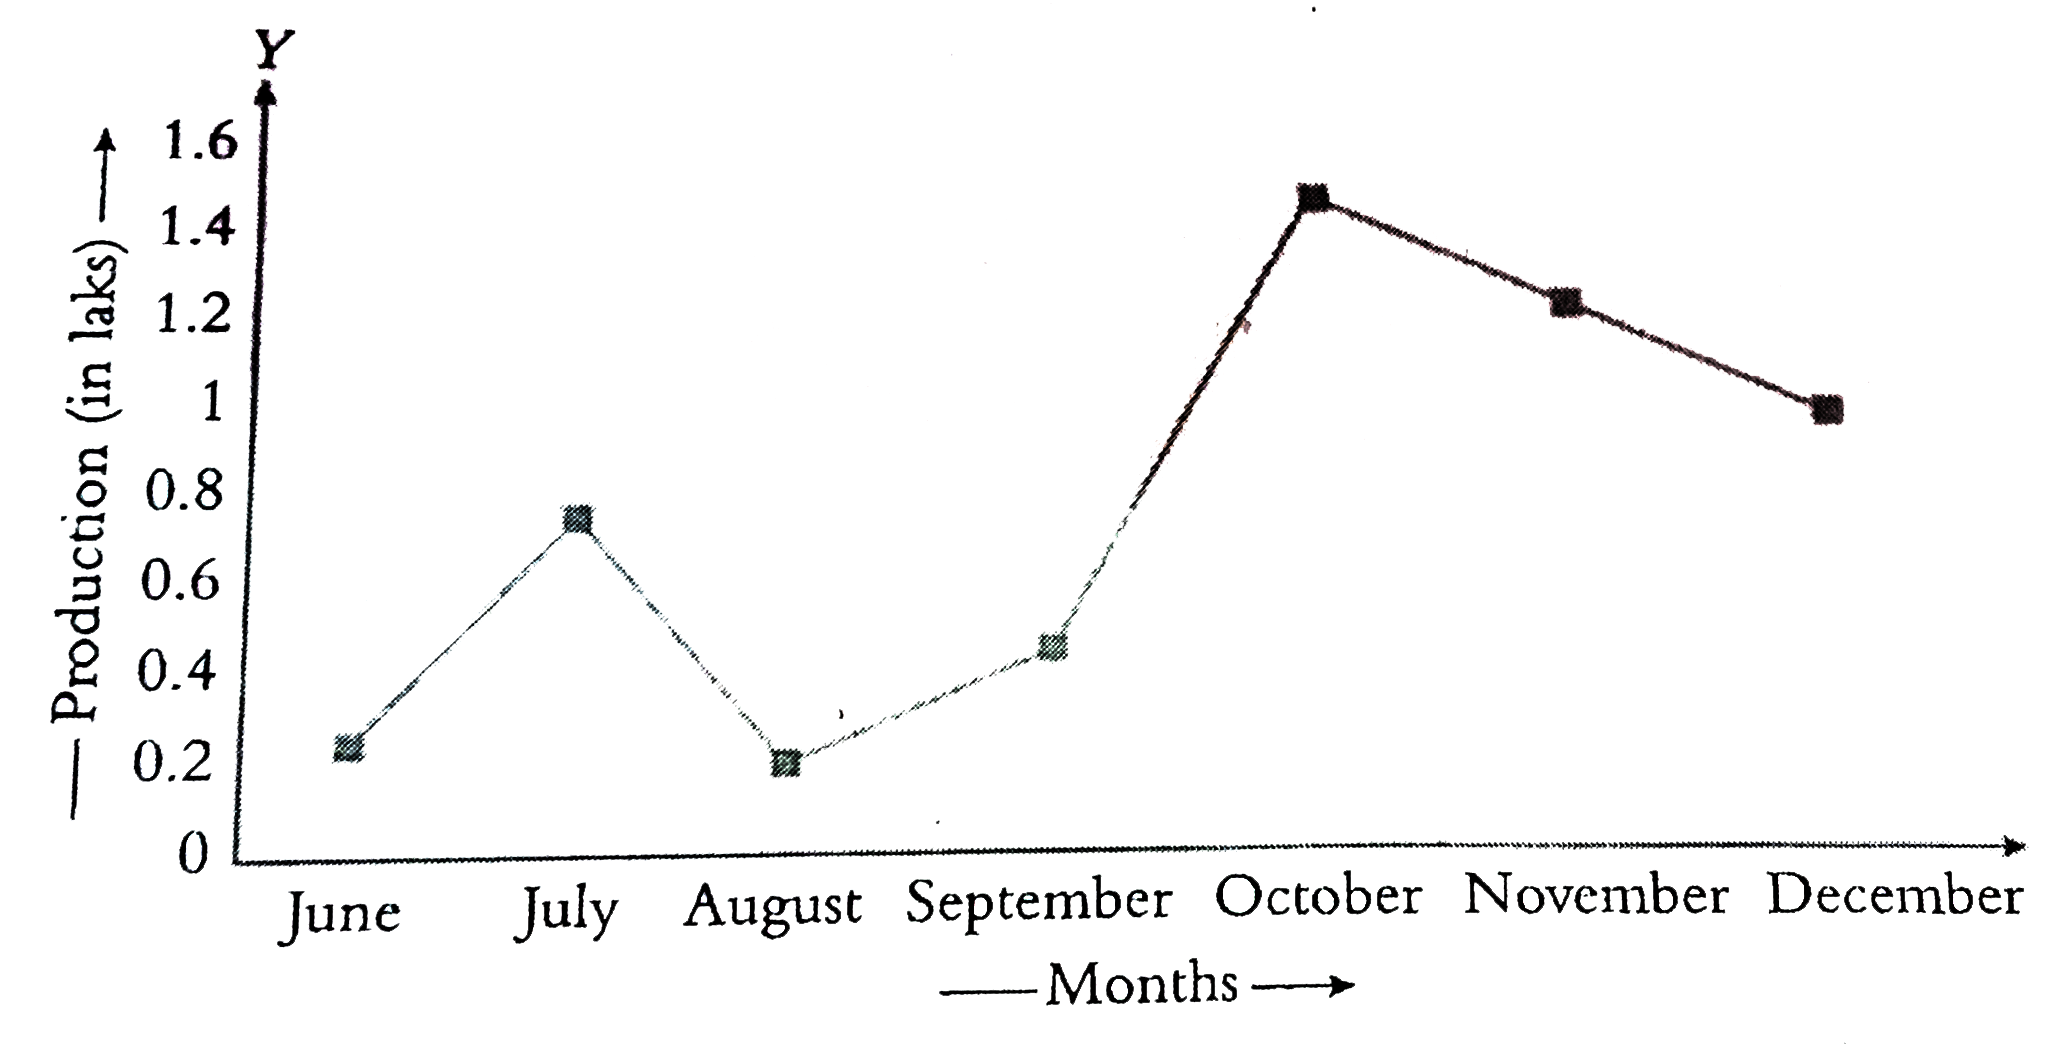
(a) In the month of October
(b) August
(c) September and October
(d) November and December
Topper's Solved these Questions
- STATISTICSBOOK - PEARSON IIT JEE FOUNDATIONCHAPTER - STATISTICSEXERCISE - Very Short Answer Type
37 Videos
- STATISTICSBOOK - PEARSON IIT JEE FOUNDATIONCHAPTER - STATISTICSEXERCISE - Short Answer Type
21 Videos
- SIMPLE INTEREST AND COMPOUND INTEREST BOOK - PEARSON IIT JEE FOUNDATIONCHAPTER - SIMPLE INTEREST AND COMPOUND INTEREST EXERCISE - Level 3
9 Videos
Similar Questions
The line graph given below shows the production of a particular model of bike produced in different months. Read the line graph and answer the following questions:
In which month is the production least?
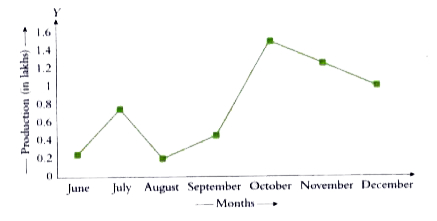
View SolutionThe line graph given below shows the production of a particular model of bike produced in different months. Read the line graph and answer the following questions:
In which month is the production maximum?
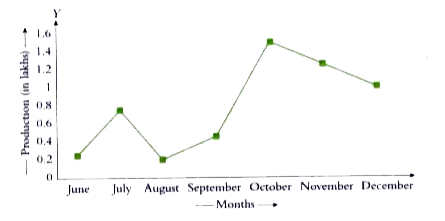
View Solution
Knowledge Check
Which month is the off month?
AFebruaryBMarchCMayDNone of theseThe bar graph shows the production of the different departments of a company. Study the diagram and answer the following questions.
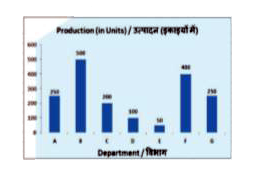
Which department has the second lowest production in units ?ACBDCEDAThe line graph shows the production of steel of a certain country. Study the diagram and answer the following questions.
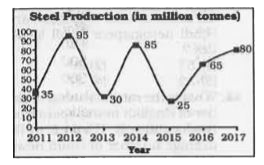
In which year was the steel production lesser than that of the previous year?A2013B2014C2012D2016
The line graph given below shows the production of a particular model of bike produced in different months. Read the line graph and answer the following questions:
In which two successive months has the production increased?
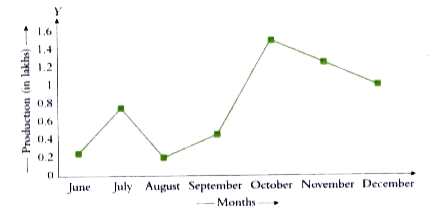
View SolutionThe line graph given below shows the production of a particular model of bike produced in different months. Read the line graph and answer the following questions:
In which two successive months has the production decreased?
View SolutionRead the graph and answer the following questions
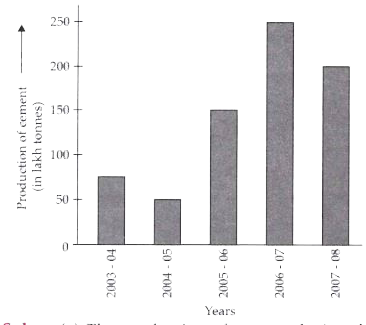
During which period, the production was minimum ?
View SolutionLook at the bar graph and answer the following questions.
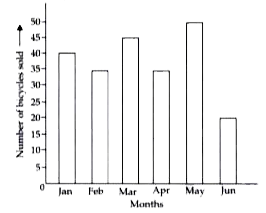
In which month 40 bicycles were sold?
View SolutionRead the following bar graph given in figure and answer the following questions.
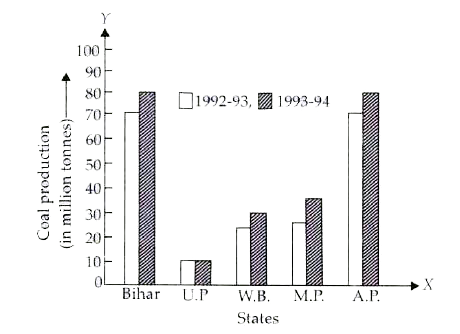
Which state has minimum production?
View Solution
