An insurance company selected 2000 drivers at random (i.e., without any preference of one driver over another) in a particular city to find a relationship between age and accidents. The data obtained are given in the following table:

Find the probabilities of the following events for a driver chosen at random from the
city:
(i) being 18-29 years of age and having exactly 3 accidents in one year.
(ii) being 30-50 years of age and having one or more accidents in a year.
(iii) having no accidents in one year
Here, the total number of drivers, N=2000
From the given table,
Number of drivers who are 18-29 years of age and having exactly 3 accidents, Ea=61
Number of drivers who are 30-50 years of age and having one or more accidents, Eb=125+60+22+18=225
Number of drivers having no accidents, Ec=440+505+360=1305
(i) Probability of a driver being 18-29 years of age and having exactly 3 accidents,P(Ea)=EaN=612000
(ii) Probability of a driver being 30-50 years of age and having one or more accidents, P(Eb)=EbN=2252000=980
(iii) Probability of a driver having no accidents, P(Ec)=EcN=13052000=261400
Similar Questions
An insurance company selected 2000 drivers at random (i.e., without any preference of one driver over another) in a particular city to find a relationship between age and accidents. The data obtained are given in the following table:

Find the probabilities of the following events for a driver chosen at random from the city:
(i) being 18-29 years of age and having exactly 3 accidents in one year.
(ii) being 30-50 years of age and having one or more accidents in a year.
(iii) having no accidents in one year
View SolutionAn insurance company selected 2000 drivers at random (i.e., without any preference of one driver over another) in a particular city to find a relationship between age and accidents . The data obtained are given in following table :
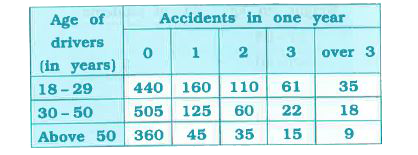
Find the probabilities of the following events for a driver chosen at random from the city.
being 18-29 years of age and having exactly 3 accidents in one year.
View SolutionAn insurance company selected 2000 drivers at random (i.e., without any preference of one driver over another) in a particular city to find a relationship between age and accidents . The data obtained are given in following table :
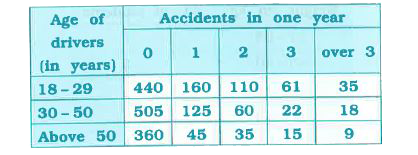
Find the probabilities of the following events for a driver chosen at random from the city.
being 30-50 years of age and having one or more accidents in a year.
View SolutionAn insurance company selected 2000 drivers at random (i.e., without any preference of one driver over another) in a particular city to find a relationship between age and accidents . The data obtained are given in following table :
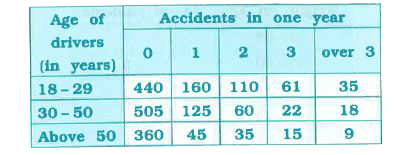
Find the probabilities of the following events for a driver chosen at random from the city.
having no accidents in one year
View SolutionAn insurance company selected 2000 drivers at random in particular city to find a relationship between age and accidents . The data obtained are given in the following table .
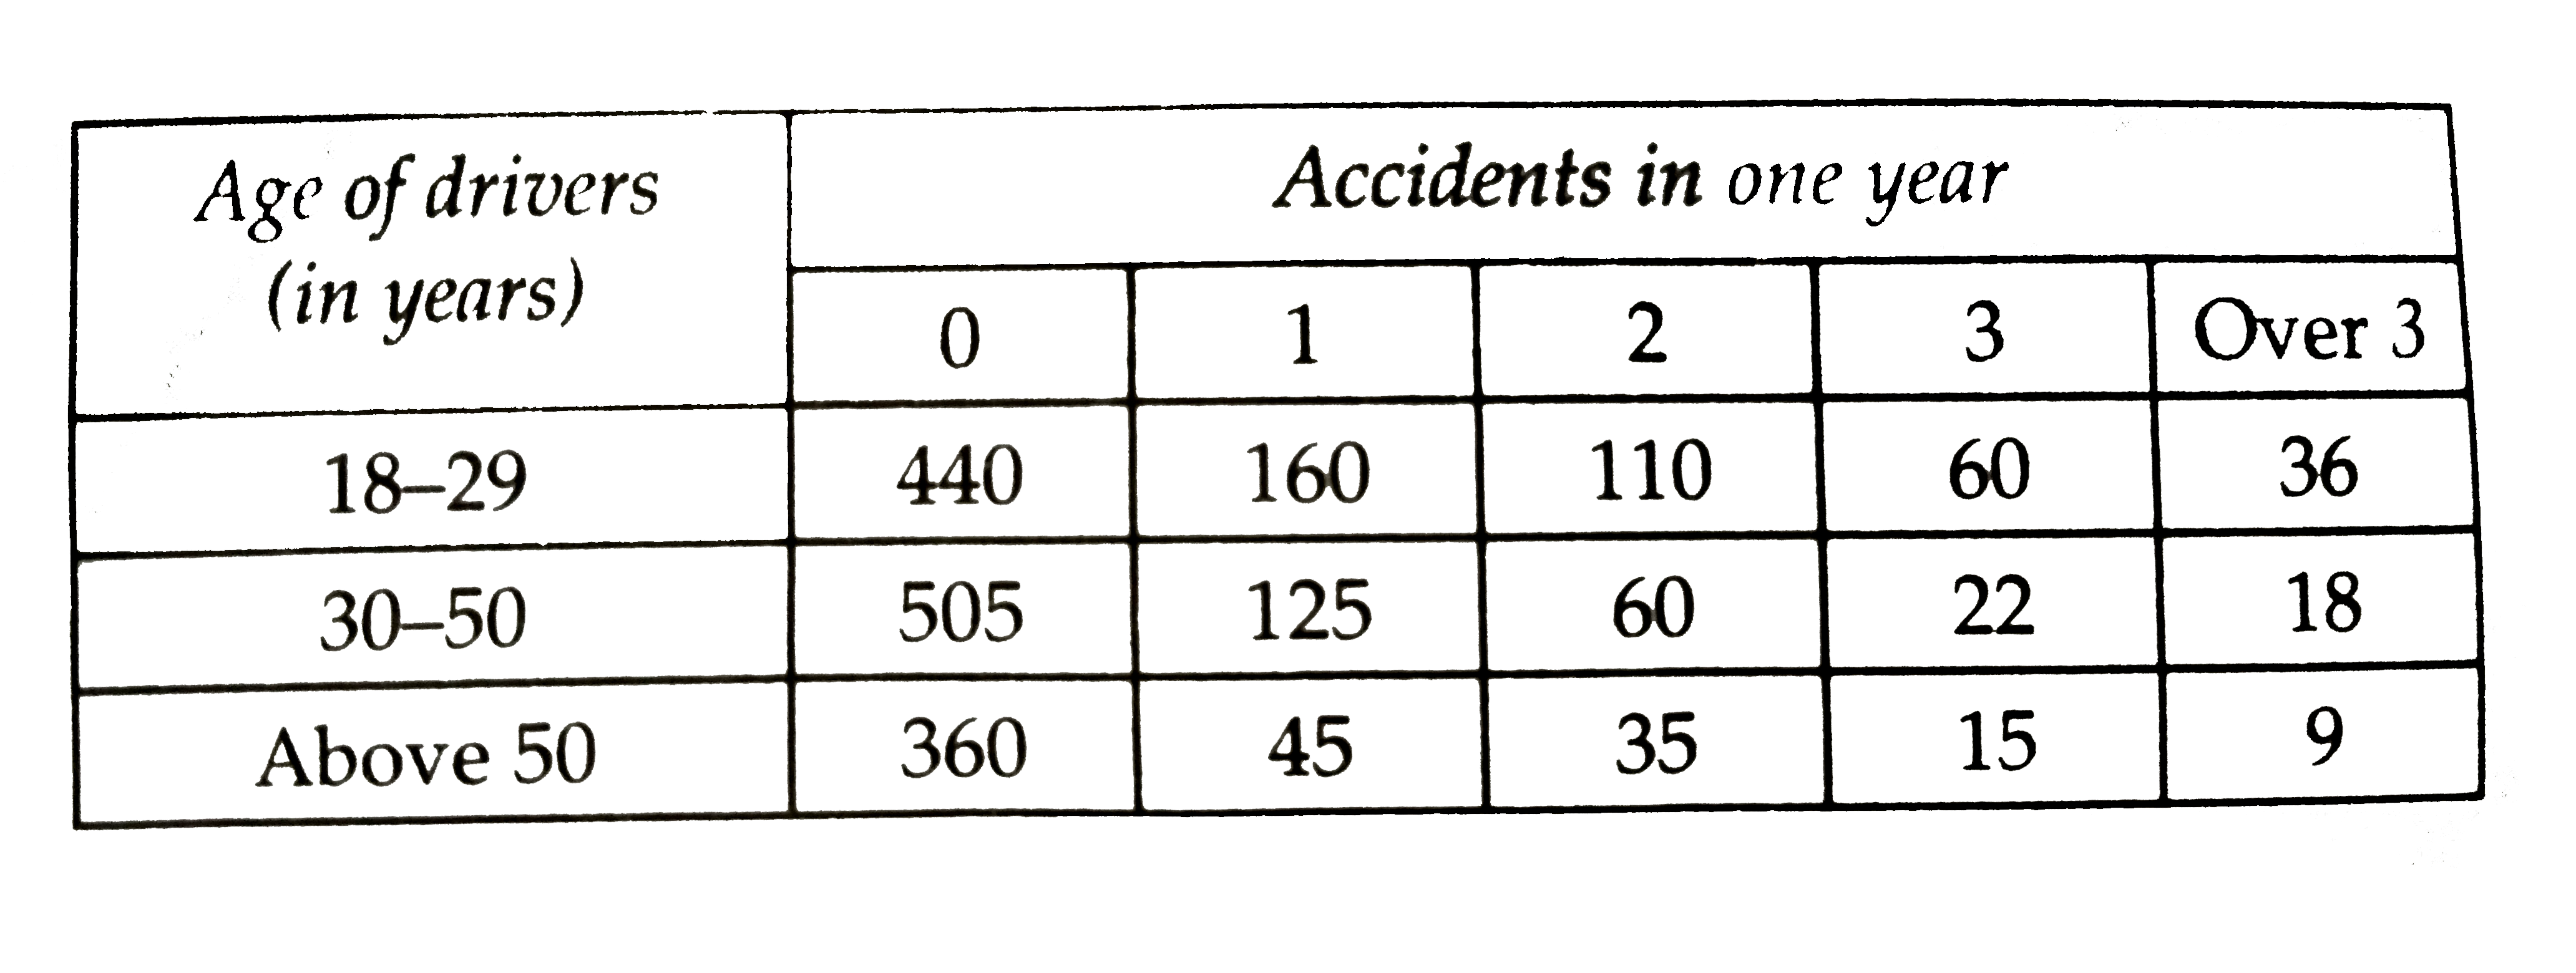
Find the probability of each of the following events for a driver chosen at random from the city :
(i) being 18−29 years of age and having exactly 3 accidents in one year .
(ii) being 30−50 years of age and having one or more accidents in one year
(iii) having no accident in one year .
View SolutionAn insurance company selected 2000 drivers at random in a particular city to find a relationship between age and accidents. The obtained are given in the following table: Age of Drivers (in years) Accidents in one year 0 1 2 3 over 3 18-29 30-50 above 50 440 505 360 160 125 45 110 60 35 61 22 15 35 18 9 Find the probability of the following events for a driver chosen at random from the life city: being 18-29 years of age and having exactly 3 accidents in one year. being 30-50 years of age and having one or more accidents in a year. having no accidents in one year.
View SolutionA selection committee of school selected 2000 girls for scholarship of different age. The data obtained are given in the following table:
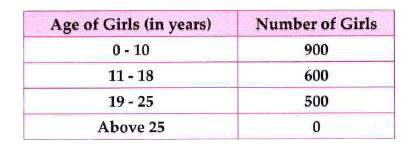
Find the probabilities of the girls selected for scholarship in following age group.
11 - 18
View SolutionA selection committee of school selected 2000 girls for scholarship of different age. The data obtained are given in the following table:
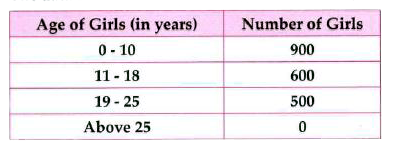
Find the probabilities of the girls selected for scholarship in following age group.
0 - 18
View Solution
A driver is chosen at random. The probability that he took 90 minutes or less is
View SolutionFind the probability that a leap year selected at random will contain 53 days.
View Solution
