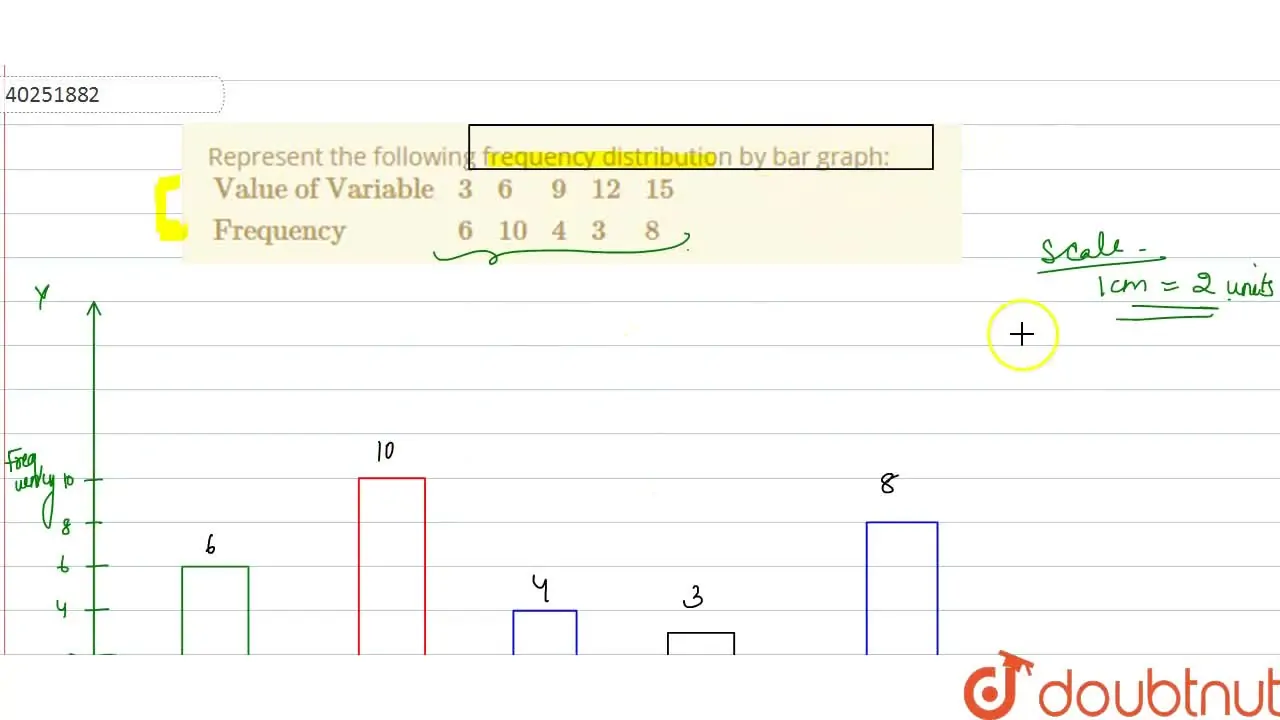
Represent the following frequency distribution by bar graph:
Value of Variable3691215Frequency610438
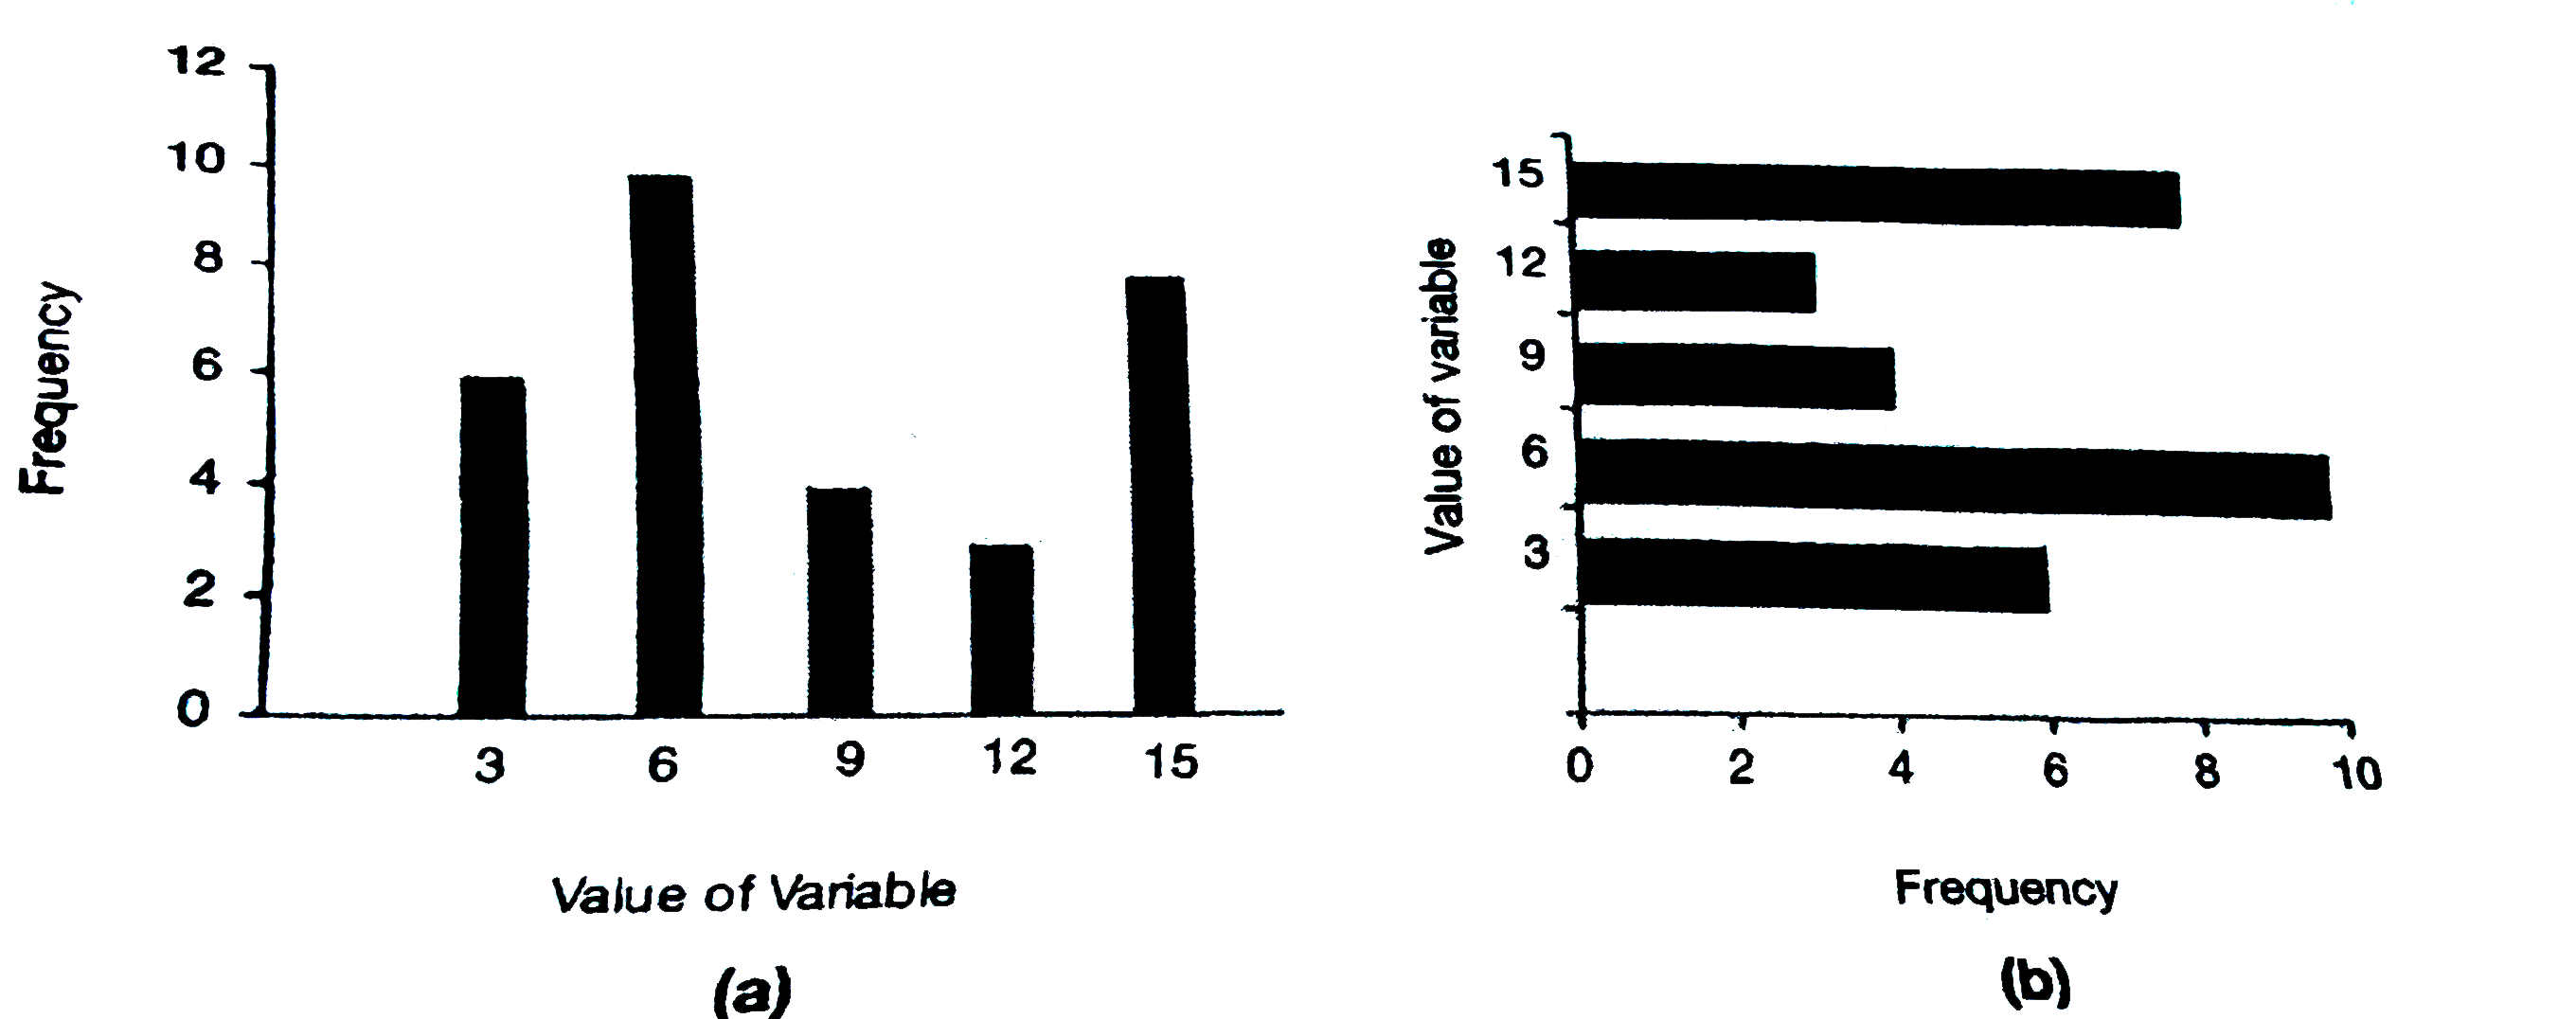
Either of the following bar graphs [Fig. 9.1(a) or Fig. 9.2(b)] may be used to represent the above frequency distribution. The first graph takes value of the variable along the X-axis and the frequency along the Y-axis, whereas the second one takes the frequency along the X-axis and the value of the variable on the Y-axis.
All the rectangles (bars) should be of same width and uniform spaces should be left between any two consecutive bars.

Related Playlists
- BOOK - PEARSON IIT JEE FOUNDATIONCHAPTER - STATISTICSEXERCISE - VERY SHORT ANSWER TYPE QUESTIONS30videos
STATISTICS
- BOOK - PEARSON IIT JEE FOUNDATIONCHAPTER - STATISTICSEXERCISE - SHORT ANSWER TYPE QUESTIONS14videos
STATISTICS
- BOOK - PEARSON IIT JEE FOUNDATIONCHAPTER - SIMPLE INTEREST AND COMPOUND INTEREST EXERCISE - CONCEPT APPLICATION1videos
SIMPLE INTEREST AND COMPOUND INTEREST
- BOOK - PEARSON IIT JEE FOUNDATIONCHAPTER - TRIGONOMETRY EXERCISE - Level 315videos
TRIGONOMETRY
Similar Questions
Represent the following frequency distribution by a bar graph :
 View Solution
Represent the following frequency distribution as a bar graph:
 View Solution
Represent the following frequency distribution as a bar graph :
¯¯¯¯¯¯¯¯¯¯¯¯¯¯¯¯¯¯¯¯¯¯¯¯¯¯¯¯¯¯¯¯¯¯¯¯¯¯¯¯¯¯¯¯¯¯¯¯¯¯¯¯¯¯¯¯¯¯¯¯¯¯¯¯¯¯¯¯¯¯¯¯¯¯¯¯Value of Variable (x) 1 3 4 6 7Frequency (F) 4 3 2 5 1––––––––––––––––––––––––––––––––––––––––––––––––––View SolutionThe upper limit of the median class of the following frequency distribution.
Class0−56−1112−1718−2324−29Frequency131015811View SolutionFind the mean of the following frequency distribution:
Class0−55−1010−1515−2020−2525−30Frequency122672View SolutionIf x<6 and 17.5 is the mode of the following frequency distribution.
Class-interval:0−55−1010−1515−2020−25Frequency:5236x
Then, x =View SolutionConsider the following frequency distribution :
Class :0−66−1212−1818−2424−30Frequency : ab1295
If mean =30922 and median = 14, then the value (a−b)2 is equal to __________ .View SolutionThe mode of the following distribution is
Class interval :1−56−1011−1516−2021−25Frequency :471086View SolutionFind the variance and standard deviation of the following frequency distribution: Variable (xi) , 2, 4, 6, 8, 10, 12, 14, 16 Frequency (fi) , 4, 4, 5, 15, 8, 5, 4, 5
View SolutionFind the mean deviation about the median of the following frequency distribution: Class:, 0-6, 6-12, 12-18, 18-24, 24-30 Frequency:, 8, 10, 12, 9, 5
View Solution


