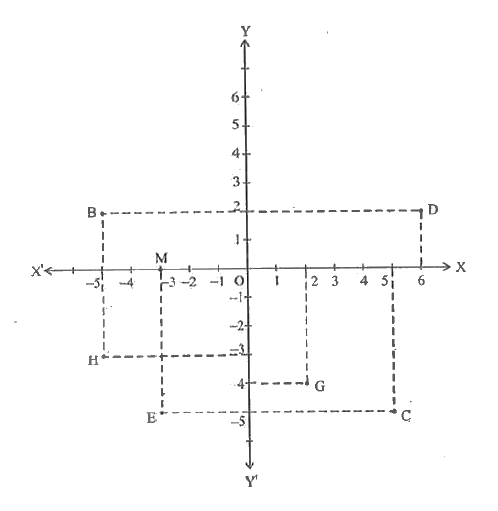
See Fig.and write the

The co-ordinates of the point M. Solution in Kannada
The correct Answer is:M(−3,0)
Step by step video, text & image solution for See Fig.and write the The co-ordinates of the point M. by Maths experts to help you in doubts & scoring excellent marks in Class 9 exams.
Updated on:21/07/2023Topper's Solved these Questions
- CO-ORDINATE GEOMETRY BOOK - SUBHASH PUBLICATIONCHAPTER - CO-ORDINATE GEOMETRY EXERCISE - EXERCISE 9.3
1 Videos
- CO-ORDINATE GEOMETRY BOOK - SUBHASH PUBLICATIONCHAPTER - CO-ORDINATE GEOMETRY EXERCISE - EXERCISE 9.3
1 Videos
- CIRCLESBOOK - SUBHASH PUBLICATIONCHAPTER - CIRCLESEXERCISE - EXERCISE 12.6
7 Videos
- HERON'S FORMULABOOK - SUBHASH PUBLICATIONCHAPTER - HERON'S FORMULAEXERCISE - EXERCISE 8.2
5 Videos
Similar Questions
In which quandrant or on which axis do each of the points (−2,4),(3,−1),(−1,0),(1,2)and(−3,−5) lie ? Verify you answer by locating them on the cartesian plane.
View SolutionIn which quandrant or on which axis do each of the points (−2,4),(3,−1),(−1,0),(1,2)and(−3,−5) lie ? Verify you answer by locating them on the cartesian plane.
View SolutionProve that the line of centres of two intersecting circles subtends equal angles at the two points of intersection.
View SolutionA park, in the shape of a quadrilateral ABCD, has C=90∘, AB = 9 m, BC = 12 m, CD = 5 m and AD = 8m.
How much area does it occupy?
View SolutionHow many lines of symmetry does the above figure have ?
View SolutionWhich of the following are correct chain isomers of butane ? (i)
View SolutionDetermine the point of symmetry of a regular hexagon.
View SolutionDtermine the images of the following figure about the given line :
View SolutionMatch the following Column A to Column B

View SolutionMatch the following Column A to Column B

View SolutionMatch the following Column A to Column B

View SolutionFind the area of the figure given below.

View SolutionThe area of the shaded part in the figure given below is ______.

View SolutionThe inequation represented by the graph given below is :
View SolutionThe inequation that best describes the graph given below is _________
View SolutionThe inequation that best describes the following graph is _________
View Solution
