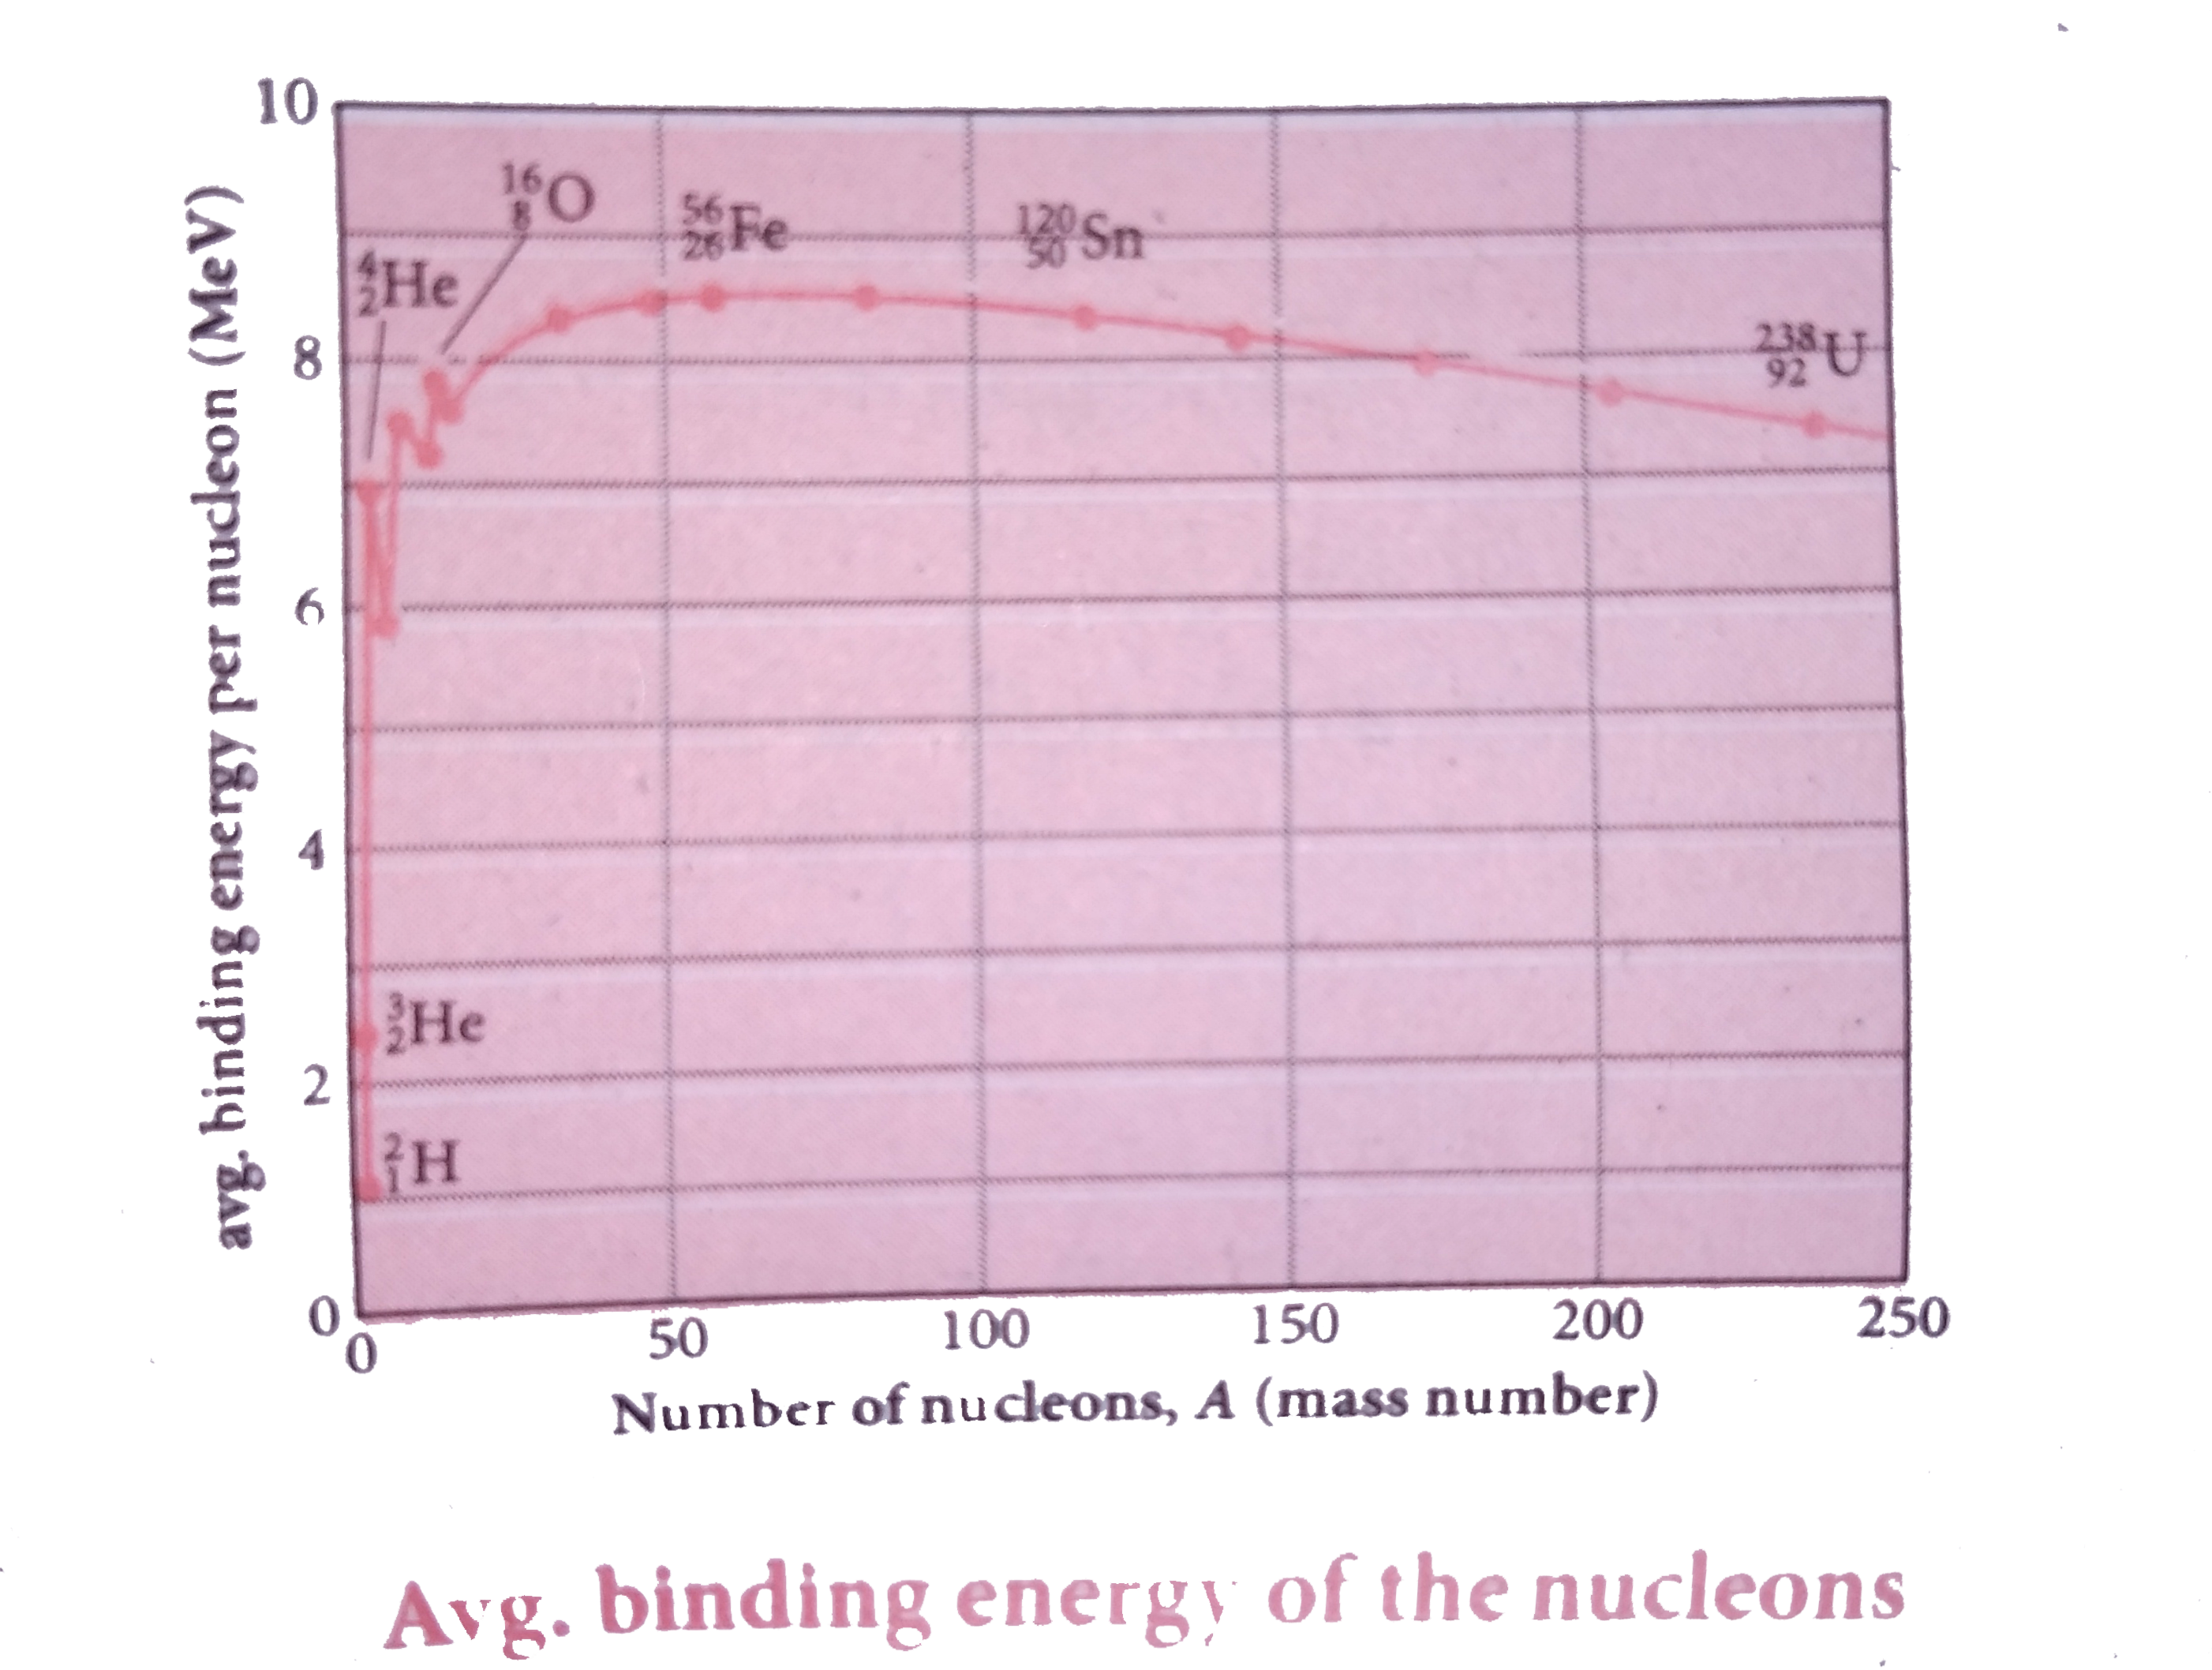
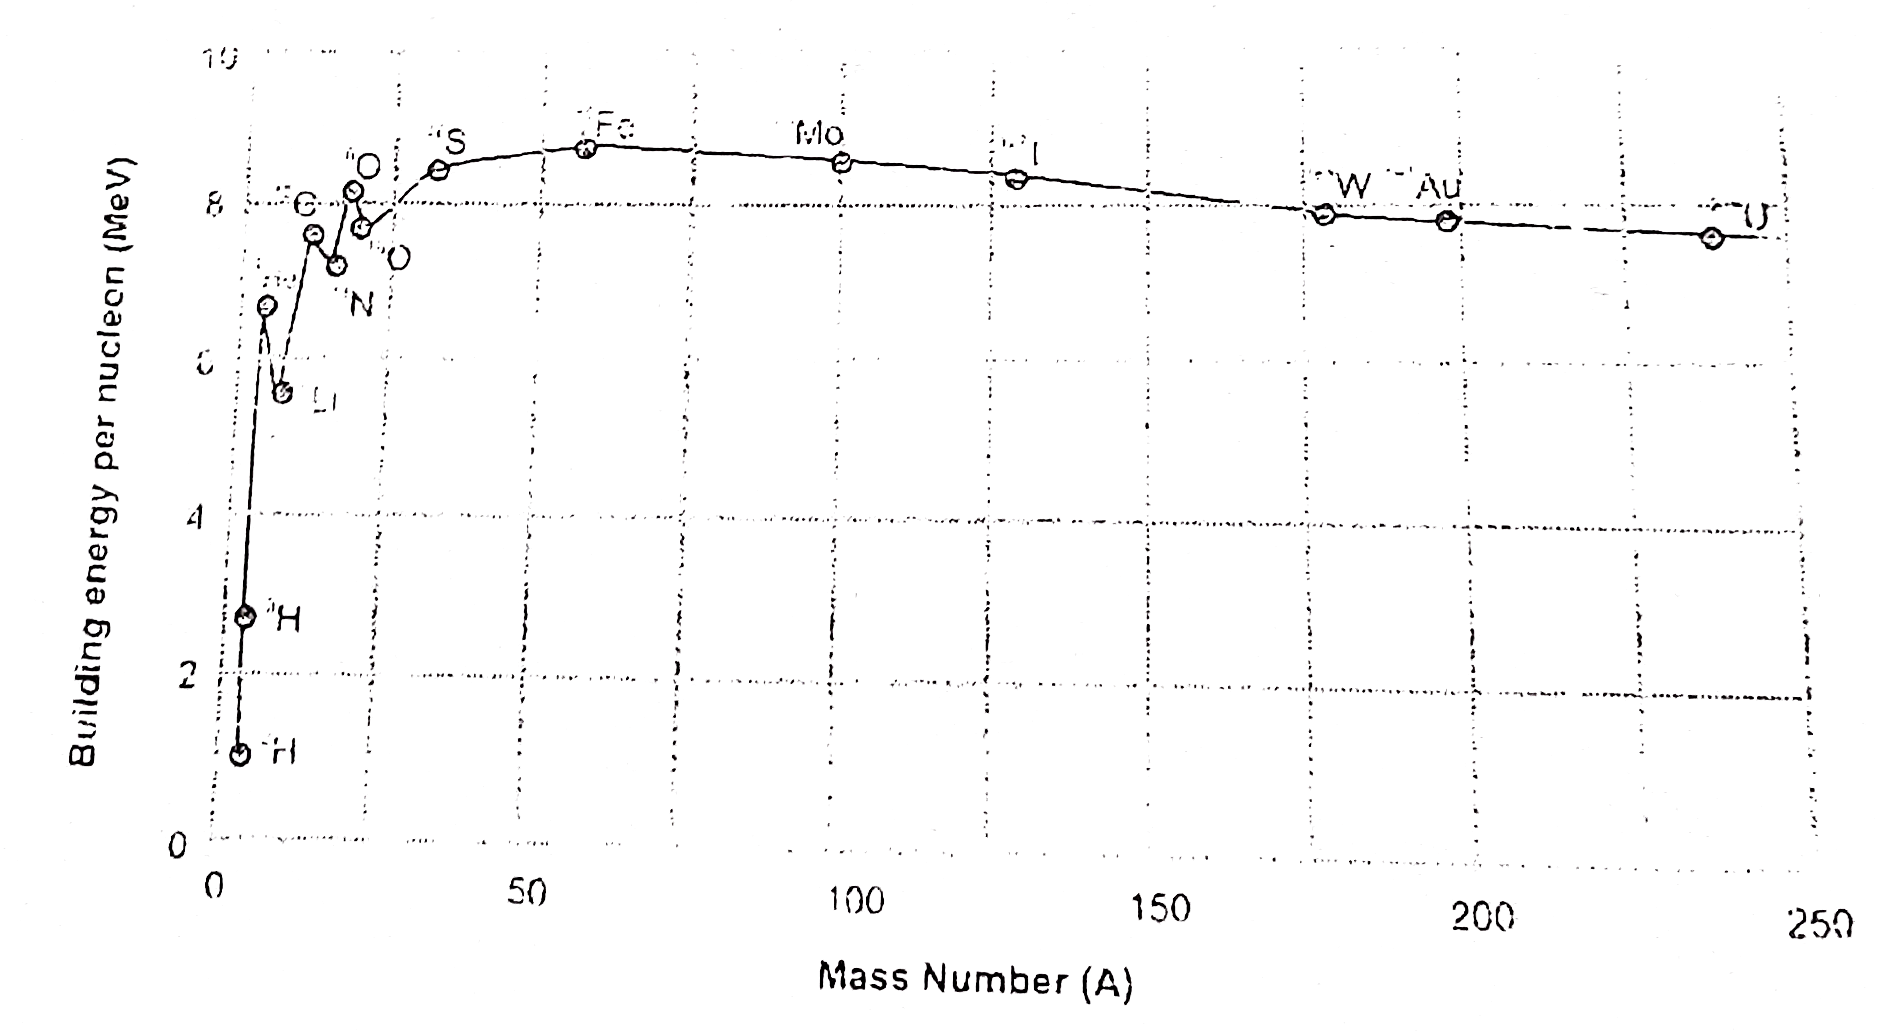
Explain the variation of average binding energy with the mass number by graph and discuss its features.Solution in Tamil
Important inferences from of the average binding energy curve:

(i) The value of ¯¯¯¯¯¯BE rises as the mass number increases until it reaches a maximum value of 8.8 MeV for A = 56 (iron) and then it slowly decreases.
(ii) The average binding energy per nucleon is about 8.5 MeV for nuclei having mass number between A = 40 and 120. These elements are comparatively more stable and not radioactive.
(iii) For higher mass numbers, the curve reduces slowly and ¯¯¯¯¯¯BE for uranium is about 7.6 MeV. They are unstable and radioactive.
If two light nuclei with A<28 combine with a nucleus with A<56, the binding energy per nucleon is more for final nucleus than initial nuclei. Thus, if the lighter elements combine to produce a nucleus of medium value A, a large amount of energy will be released. This is the basis of nuclear fusion and is the principle of the hydrogen bomb.
(iv) If a nucleus of heavy element is split (fission) into two or more nuclei of medium value A, the energy released would again be large. The atom bomb is based on this principle and huge energy of atom bombs comes from this fission when it is uncontrolled.
Similar Questions
Draw a graph showing the variation of binding energy per nucleon with mass number of different nuclei. State two inferences from this graph.
View SolutionDraw the graph showing the variation of binding energy per nucleon with mass number. Give the reason for the decrease of binding energy per nucleon for nuclei with high mass numbers.
View SolutionDraw the graph showing variation of binding energy per nucleon with mass number. Write the inferences drawn from the graph.
View SolutionBinding energy curve shows the variation of Binding energy per nucleon of nuclei with mass number. Binding energy per nucleon is maximum for mass number..
View SolutionThe energy required to separate all the nucleons inside a nucleus is called binding energy of the nucleus. Draw the graph showing the variation of binding energy per nucleon as a function of mass number
View SolutionDraw the graph showing thervariation of binding energy per nucleon with mass number. Give therason for the decrease of binding energy per nucleon for nuclei with high mass numbers.

The binding energy per nucleon for nuclei with high mass number is low due to the large coulomb repulsion between the protons inside these nuclei.
View SolutionDraw the curve showing the variation of binding energy per nucleon as a function of mass number A. Explain the stability of the nucleus from the curve.
View SolutionDraw the graph showing the variation of average binding energy per nucleon of a nucleus with its mass number. Explain nuclear fission and fusion on the basis of this graph.
View Solution
