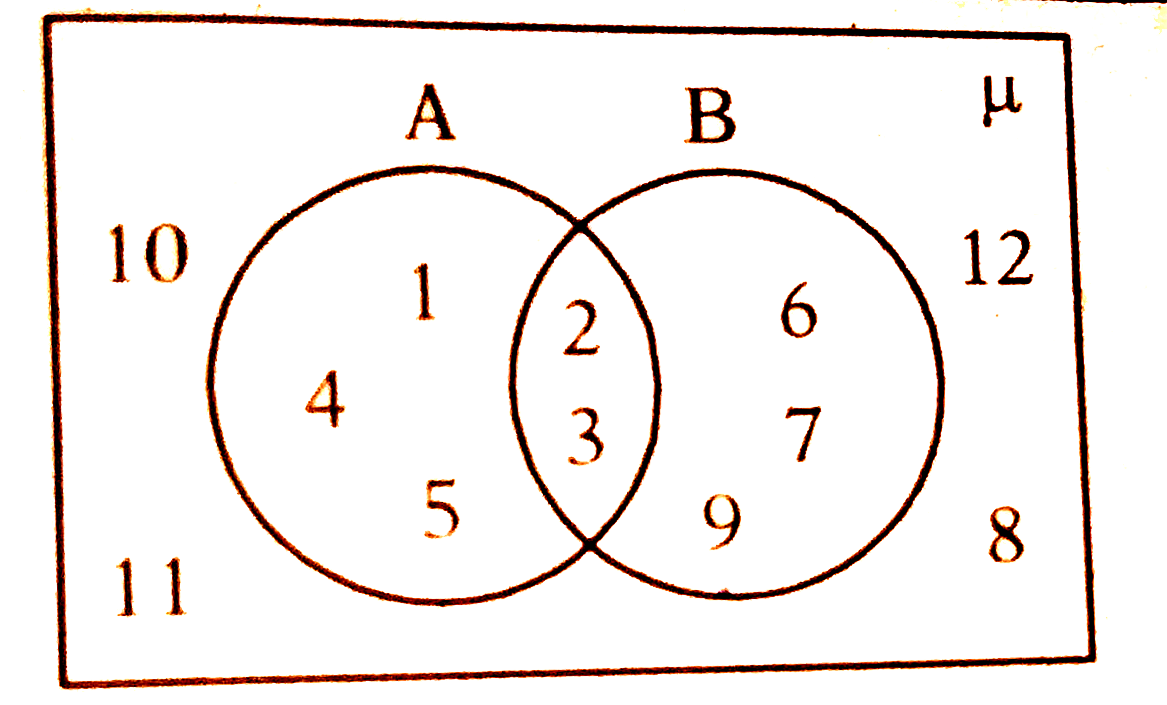
Using the Venn. Diagram verify
n(A∪B)=n(A)+n(B)−n(A∩B)
 Solution in Telugu
The correct Answer is:∴n(A∪B)=n(A)+n(B)−n(A∩B)
Step by step video, text & image solution for Using the Venn. Diagram verify n(AcupB)=n(A)+n(B)-n(A capB) by Maths experts to help you in doubts & scoring excellent marks in Class 10 exams.
Updated on:21/07/2023Topper's Solved these Questions
- SETS Book:VGS PUBLICATION-BRILLIANTChapter:SETS Exercise:OBSERVATION BITS TO SOLVE VARIOUS QUESTION GIVEN IN THE PUBLIC EXAMINATION
Explore 21 Videos
- SETS Book:VGS PUBLICATION-BRILLIANTChapter:SETS Exercise:CREATIVE BITS OF CCE MODEL EXAMINATION
Explore 116 Videos
- SETS Book:VGS PUBLICATION-BRILLIANTChapter:SETS Exercise:EXERCISE 2.4
Explore 12 Videos
- REAL NUMBERS (MULTIPLE CHOICE QUESTION)Book:VGS PUBLICATION-BRILLIANTChapter:REAL NUMBERS (MULTIPLE CHOICE QUESTION)Exercise:REAL NUMBERS (MULTIPLE CHOICE QUESTION)
Explore 22 Videos
- SIMILAR TRIANGLES Book:VGS PUBLICATION-BRILLIANTChapter:SIMILAR TRIANGLES Exercise:CREATIVE BITS FOR CCE MODEL EXAMINATION
Explore 90 Videos
Similar Questions
Set of human being that reside on moon is ………………..
View SolutionLet A={1,2,{1},{1,2},3,4}, then which of the following is true?
View SolutionState which of the following sets are empty and which are not?
The set of lines passing through a given point.
View Solution915=…………..
View SolutionFrom the figure ,∠DAC……….

View SolutionHow many lines of symmetry does the above figure have ?
View SolutionWhich of the following are correct chain isomers of butane ? (i)
View SolutionDetermine the point of symmetry of a regular hexagon.
View SolutionDtermine the images of the following figure about the given line :
View SolutionMatch the following Column A to Column B

View SolutionMatch the following Column A to Column B

View SolutionMatch the following Column A to Column B

View SolutionFind the area of the figure given below.

View SolutionThe inequation represented by the graph given below is :
View SolutionThe inequation that best describes the graph given below is _________
View SolutionThe inequation that best describes the following graph is _________
View Solution

