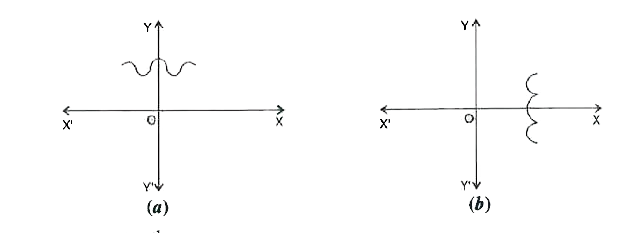
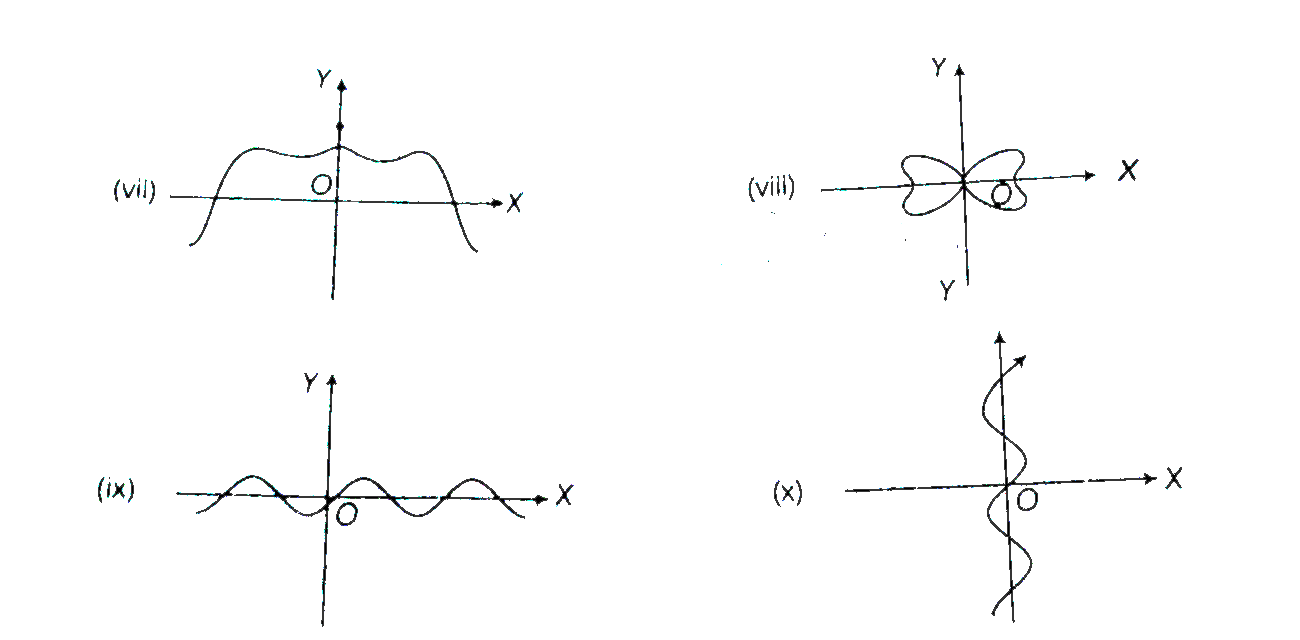
Which of the following graphs represent function whose derivatives have a maximum in the interval (0,1) ?
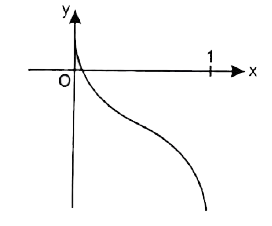
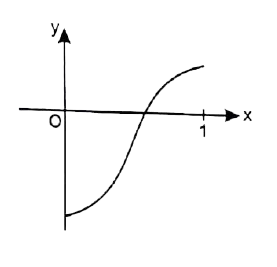
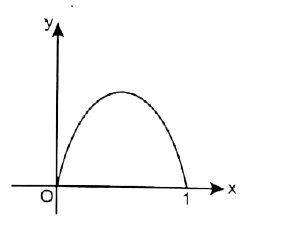
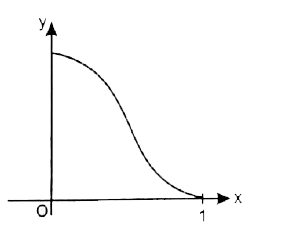
The correct Answer is:A, B, D
To determine which of the given graphs represents a function whose derivative has a maximum in the interval (0,1), we need to analyze the behavior of the derivatives of the functions represented by the graphs. Here is a step-by-step solution:
Step 1: Understand the Concept of Derivatives
The derivative of a function gives us the slope of the tangent line at any point on the graph. If we denote the function as f(x), then its derivative is f′(x). A maximum of the derivative occurs when f′(x) reaches its highest value.
Step 2: Identify the Condition for Maximum of Derivative
For a function g(x)=f′(x) to have a maximum at a point x0 in the interval (0,1), the following conditions must be satisfied:
1. g′(x0)=0 (the first derivative of g is zero).
2. g′′(x0)<0 (the second derivative of g is negative, indicating a maximum).
Step 3: Analyze the Given Graphs
We need to look at the graphs provided and determine where the derivative g(x) has a maximum. We will check for points in the interval (0,1) where the slope of the tangent (the derivative) is at its peak.
- Graph A: The curve appears to have a peak in the interval (0,1). The slope increases to a maximum and then decreases, indicating that the derivative has a maximum in this interval.
- Graph B: Similar to Graph A, this graph shows a peak in the interval (0,1), suggesting that the derivative also has a maximum here.
- Graph C: This graph does not show a change in concavity and does not have a peak in the interval (0,1). Therefore, the derivative does not have a maximum here.
- Graph D: This graph also shows a peak in the interval (0,1), indicating that the derivative has a maximum.
Step 4: Conclusion
From the analysis:
- Graphs A, B, and D represent functions whose derivatives have a maximum in the interval (0,1).
- Graph C does not represent such a function.
Final Answer
The graphs that represent functions whose derivatives have a maximum in the interval (0,1) are A, B, and D.
The derivative of a function gives us the slope of the tangent line at any point on the graph. If we denote the function as f(x), then its derivative is f′(x). A maximum of the derivative occurs when f′(x) reaches its highest value.
For a function g(x)=f′(x) to have a maximum at a point x0 in the interval (0,1), the following conditions must be satisfied:
1. g′(x0)=0 (the first derivative of g is zero).
2. g′′(x0)<0 (the second derivative of g is negative, indicating a maximum).
We need to look at the graphs provided and determine where the derivative g(x) has a maximum. We will check for points in the interval (0,1) where the slope of the tangent (the derivative) is at its peak.
- Graph B: Similar to Graph A, this graph shows a peak in the interval (0,1), suggesting that the derivative also has a maximum here.
From the analysis:
- Graphs A, B, and D represent functions whose derivatives have a maximum in the interval (0,1).
- Graph C does not represent such a function.
The graphs that represent functions whose derivatives have a maximum in the interval (0,1) are A, B, and D.
Topper's Solved these Questions
- APPLICATION OF DERIVATIVES Book:VK JAISWALChapter:APPLICATION OF DERIVATIVES Exercise:EXERCISE (COMPREHENSION TYPE PROBLEMS)
Explore 16 Videos
- APPLICATION OF DERIVATIVES Book:VK JAISWALChapter:APPLICATION OF DERIVATIVES Exercise:EXERCISE (MATCHING TYPE PROBLEMS)
Explore 8 Videos
- APPLICATION OF DERIVATIVES Book:VK JAISWALChapter:APPLICATION OF DERIVATIVES Exercise:EXERCISE (SUBJECTIVE TYPE PROBLEMS)
Explore 22 Videos
- AREA UNDER CURVESBook:VK JAISWALChapter:AREA UNDER CURVESExercise:EXERCISE (SUBJECTIVE TYPE PROBLEMS)
Explore 8 Videos
Similar Questions
Knowledge Check
Which of the following graph is correctly represented?
A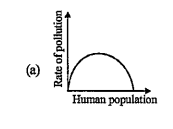 B
B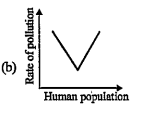 C
C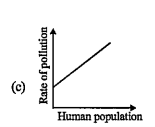 D
D
What is the range of the function f(x)=|x|x,x≠0?
A B
B C
C Dnone of above
Which one the following graph represents the function
f(x)=xx,x≠0?A B
B C
C DNone of the above
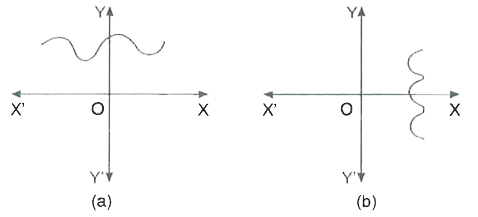
Which one of the following graphs represents the function of x? why?
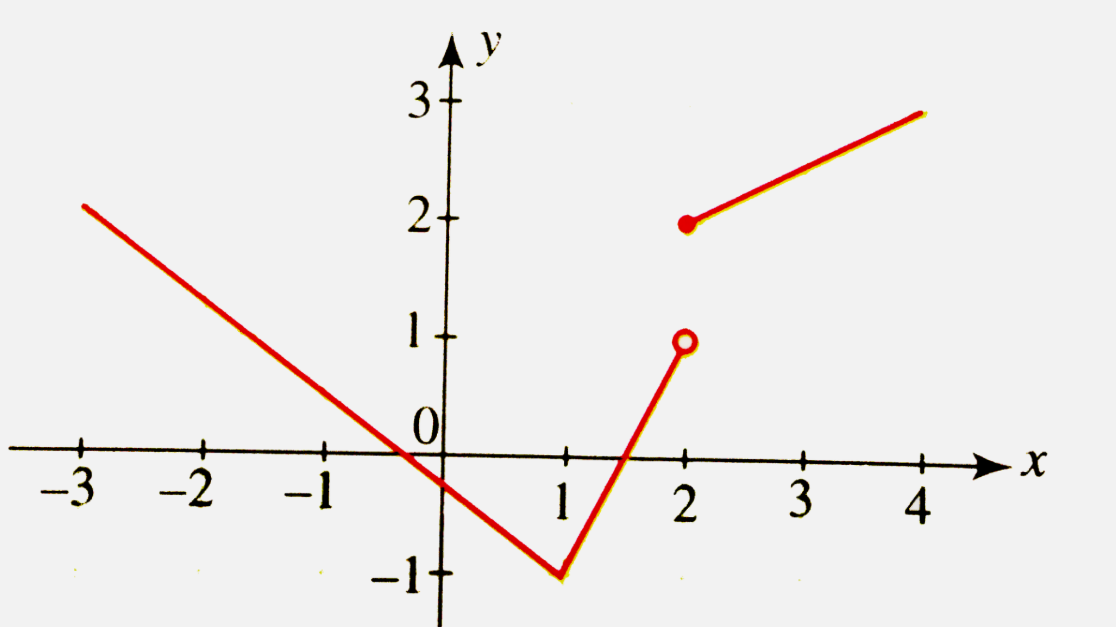
View SolutionDoes the following graph represent a function or a relation?
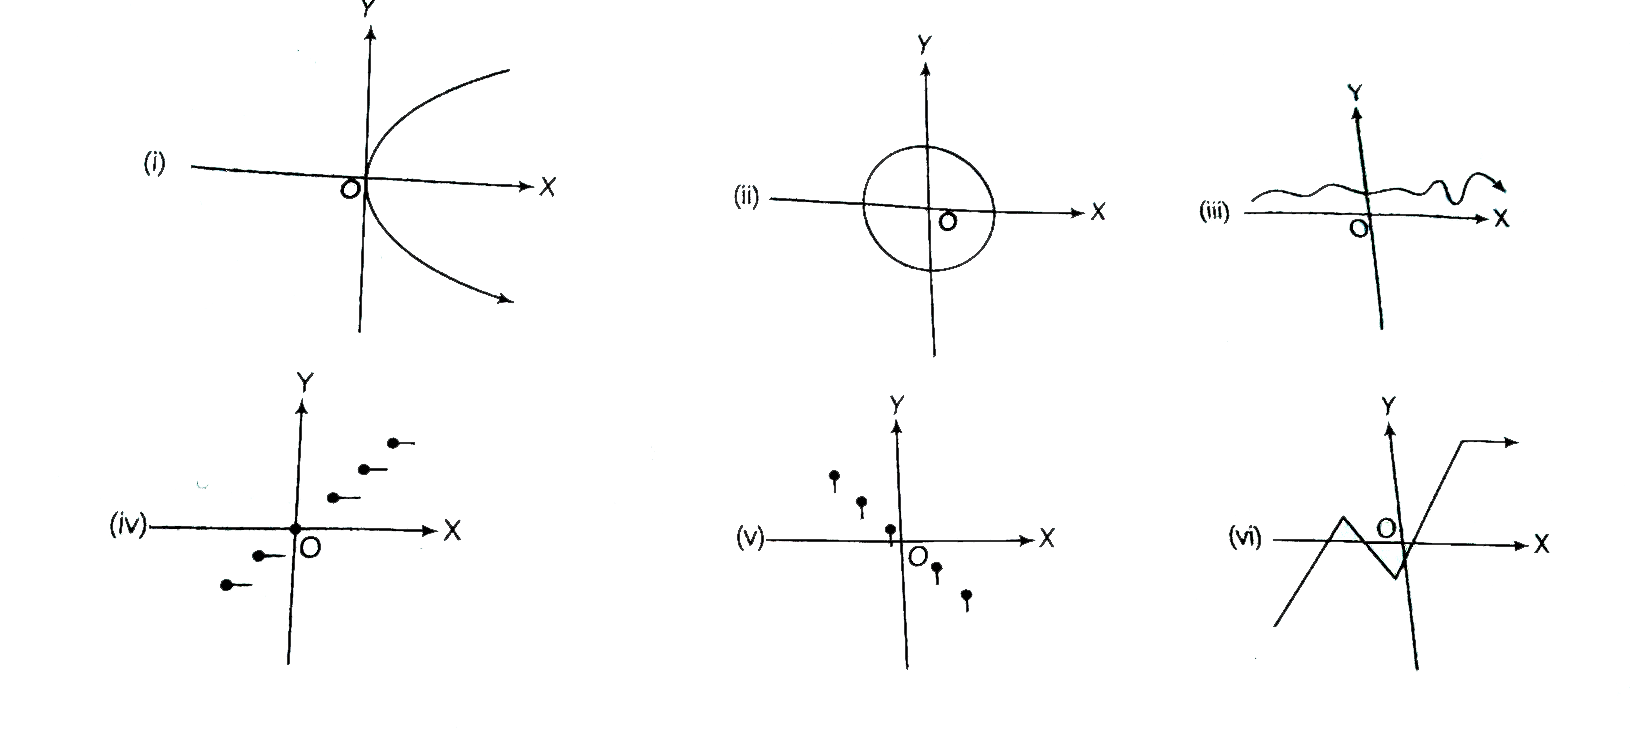
View SolutionWhich of the following graphs are graphs of a function?
View SolutionDoes the following graph represent a function? Justify your answer.
View SolutionWhich of the following pair of functions have the same graph ?
View Solution


