Figure shown an imaginary cube of edge L/2. A uniformly Charged rod of length L moves towards left at a small but constant speed v. At t=0, the left end just touches the centre of the cube opposite it. Which of the graphs shown in figure represents the flux of the electic field through the cube as the rod goes through it?
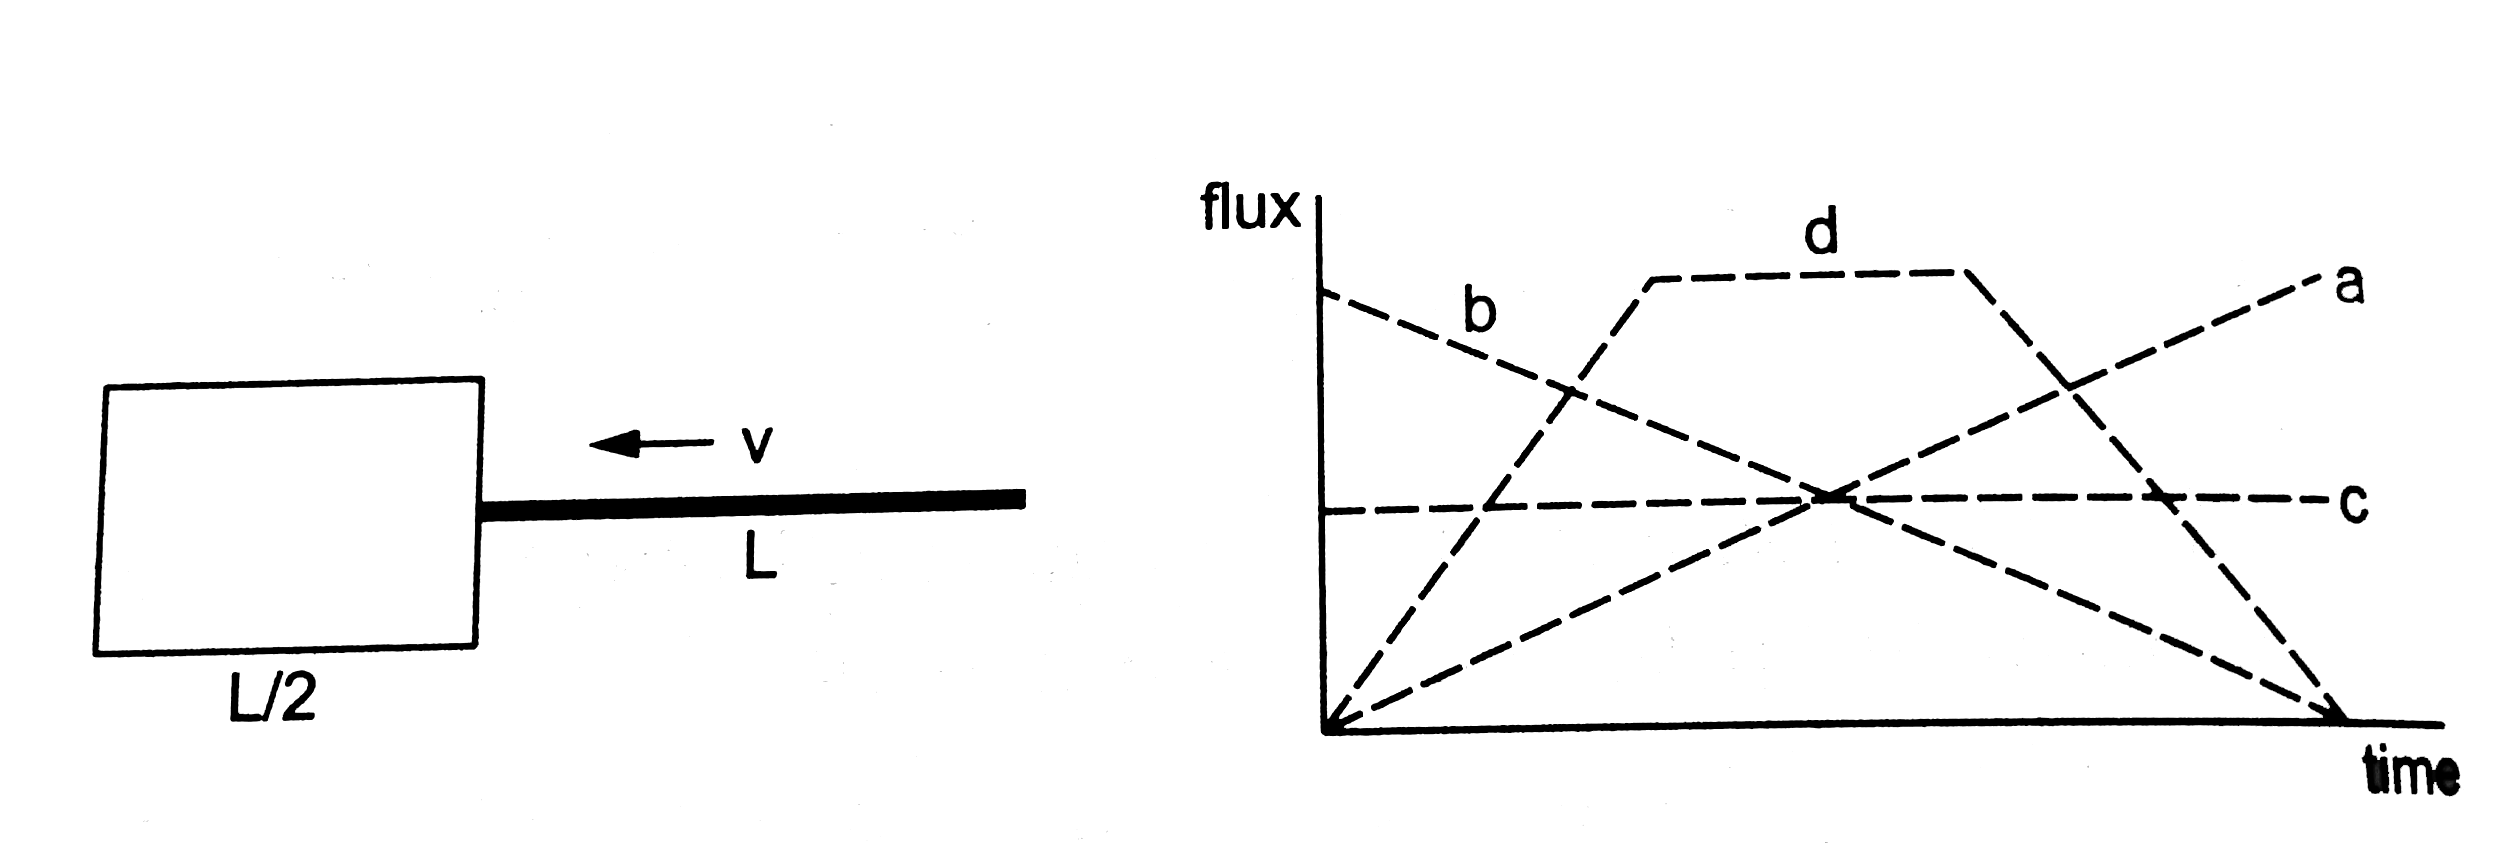
a
b
c
d
The correct Answer is:D
Step by step video, text & image solution for Figure shown an imaginary cube of edge L/2. A uniformly Charged rod of length L moves towards left at a small but constant speed v. At t=0, the left end just touches the centre of the cube opposite it. Which of the graphs shown in figure represents the flux of the electic field through the cube as the rod goes through it? by Physics experts to help you in doubts & scoring excellent marks in Class 12 exams.
Updated on:21/07/2023Topper's Solved these Questions
- ELECTROSTATICSBook:RESONANCEChapter:ELECTROSTATICSExercise:Part - II Section (J)
Explore 13 Videos
- ELECTROSTATICSBook:RESONANCEChapter:ELECTROSTATICSExercise:Part - III
Explore 20 Videos
- ELECTROSTATICSBook:RESONANCEChapter:ELECTROSTATICSExercise:Part - II Section (H)
Explore 8 Videos
- ELECTROMAGNETIC INDUCTIONBook:RESONANCEChapter:ELECTROMAGNETIC INDUCTIONExercise:A.l.P
Explore 19 Videos
- EXPERIMENTAL PHYSICSBook:RESONANCEChapter:EXPERIMENTAL PHYSICSExercise:PART -II
Explore 10 Videos
Similar Questions
An imaginary cube of edge length is shown in the figure. A uniformly charged rod having linear charge density and length L moves towards left with constant speed v. At time t = 0, the left end just touches the centre of face of the cube. v= constant Choose the correct graph which represents the flux of the electric field through the cube as rod goes through it. flux- time- flux - time
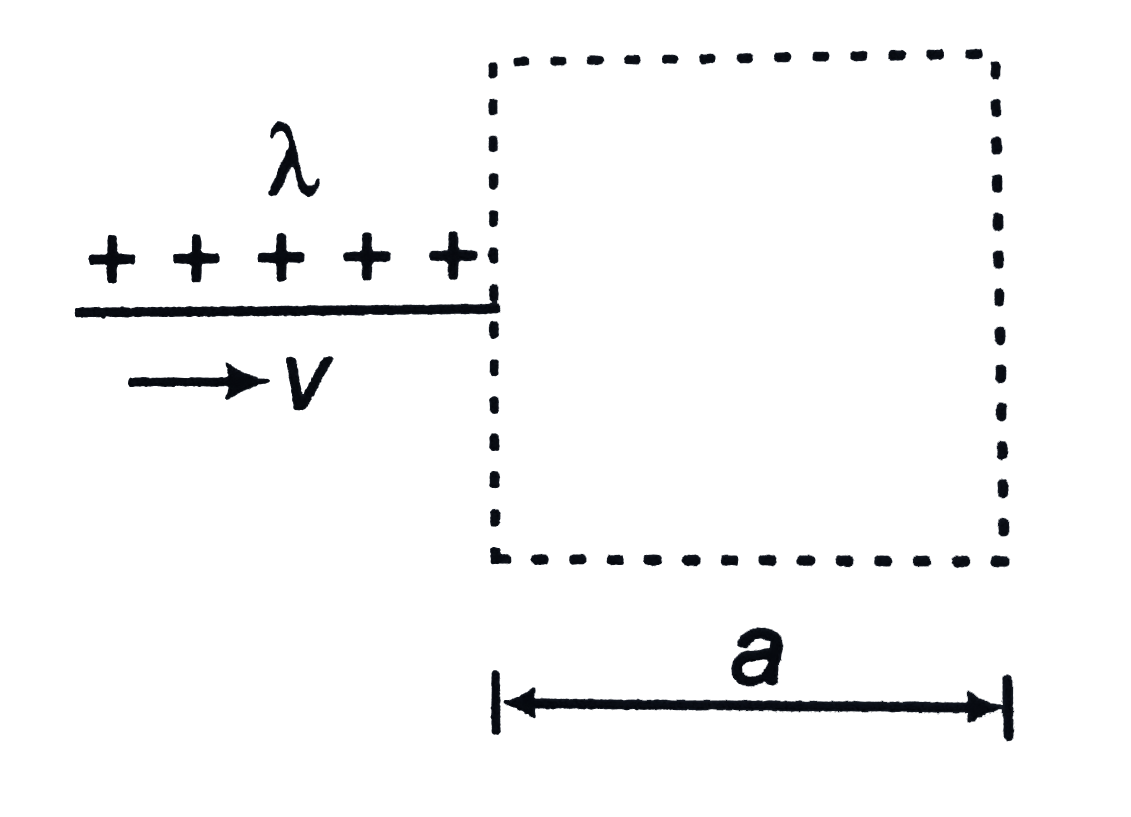
View SolutionFigure shows an imaginary cube of side a. A uniformly charged rod of length a moves towards right at a constant speed v. At t=0 the right end of the just touches the left face of the cube. Plot a graph between electric flux passing through the cube versus time.
View Solution
Knowledge Check
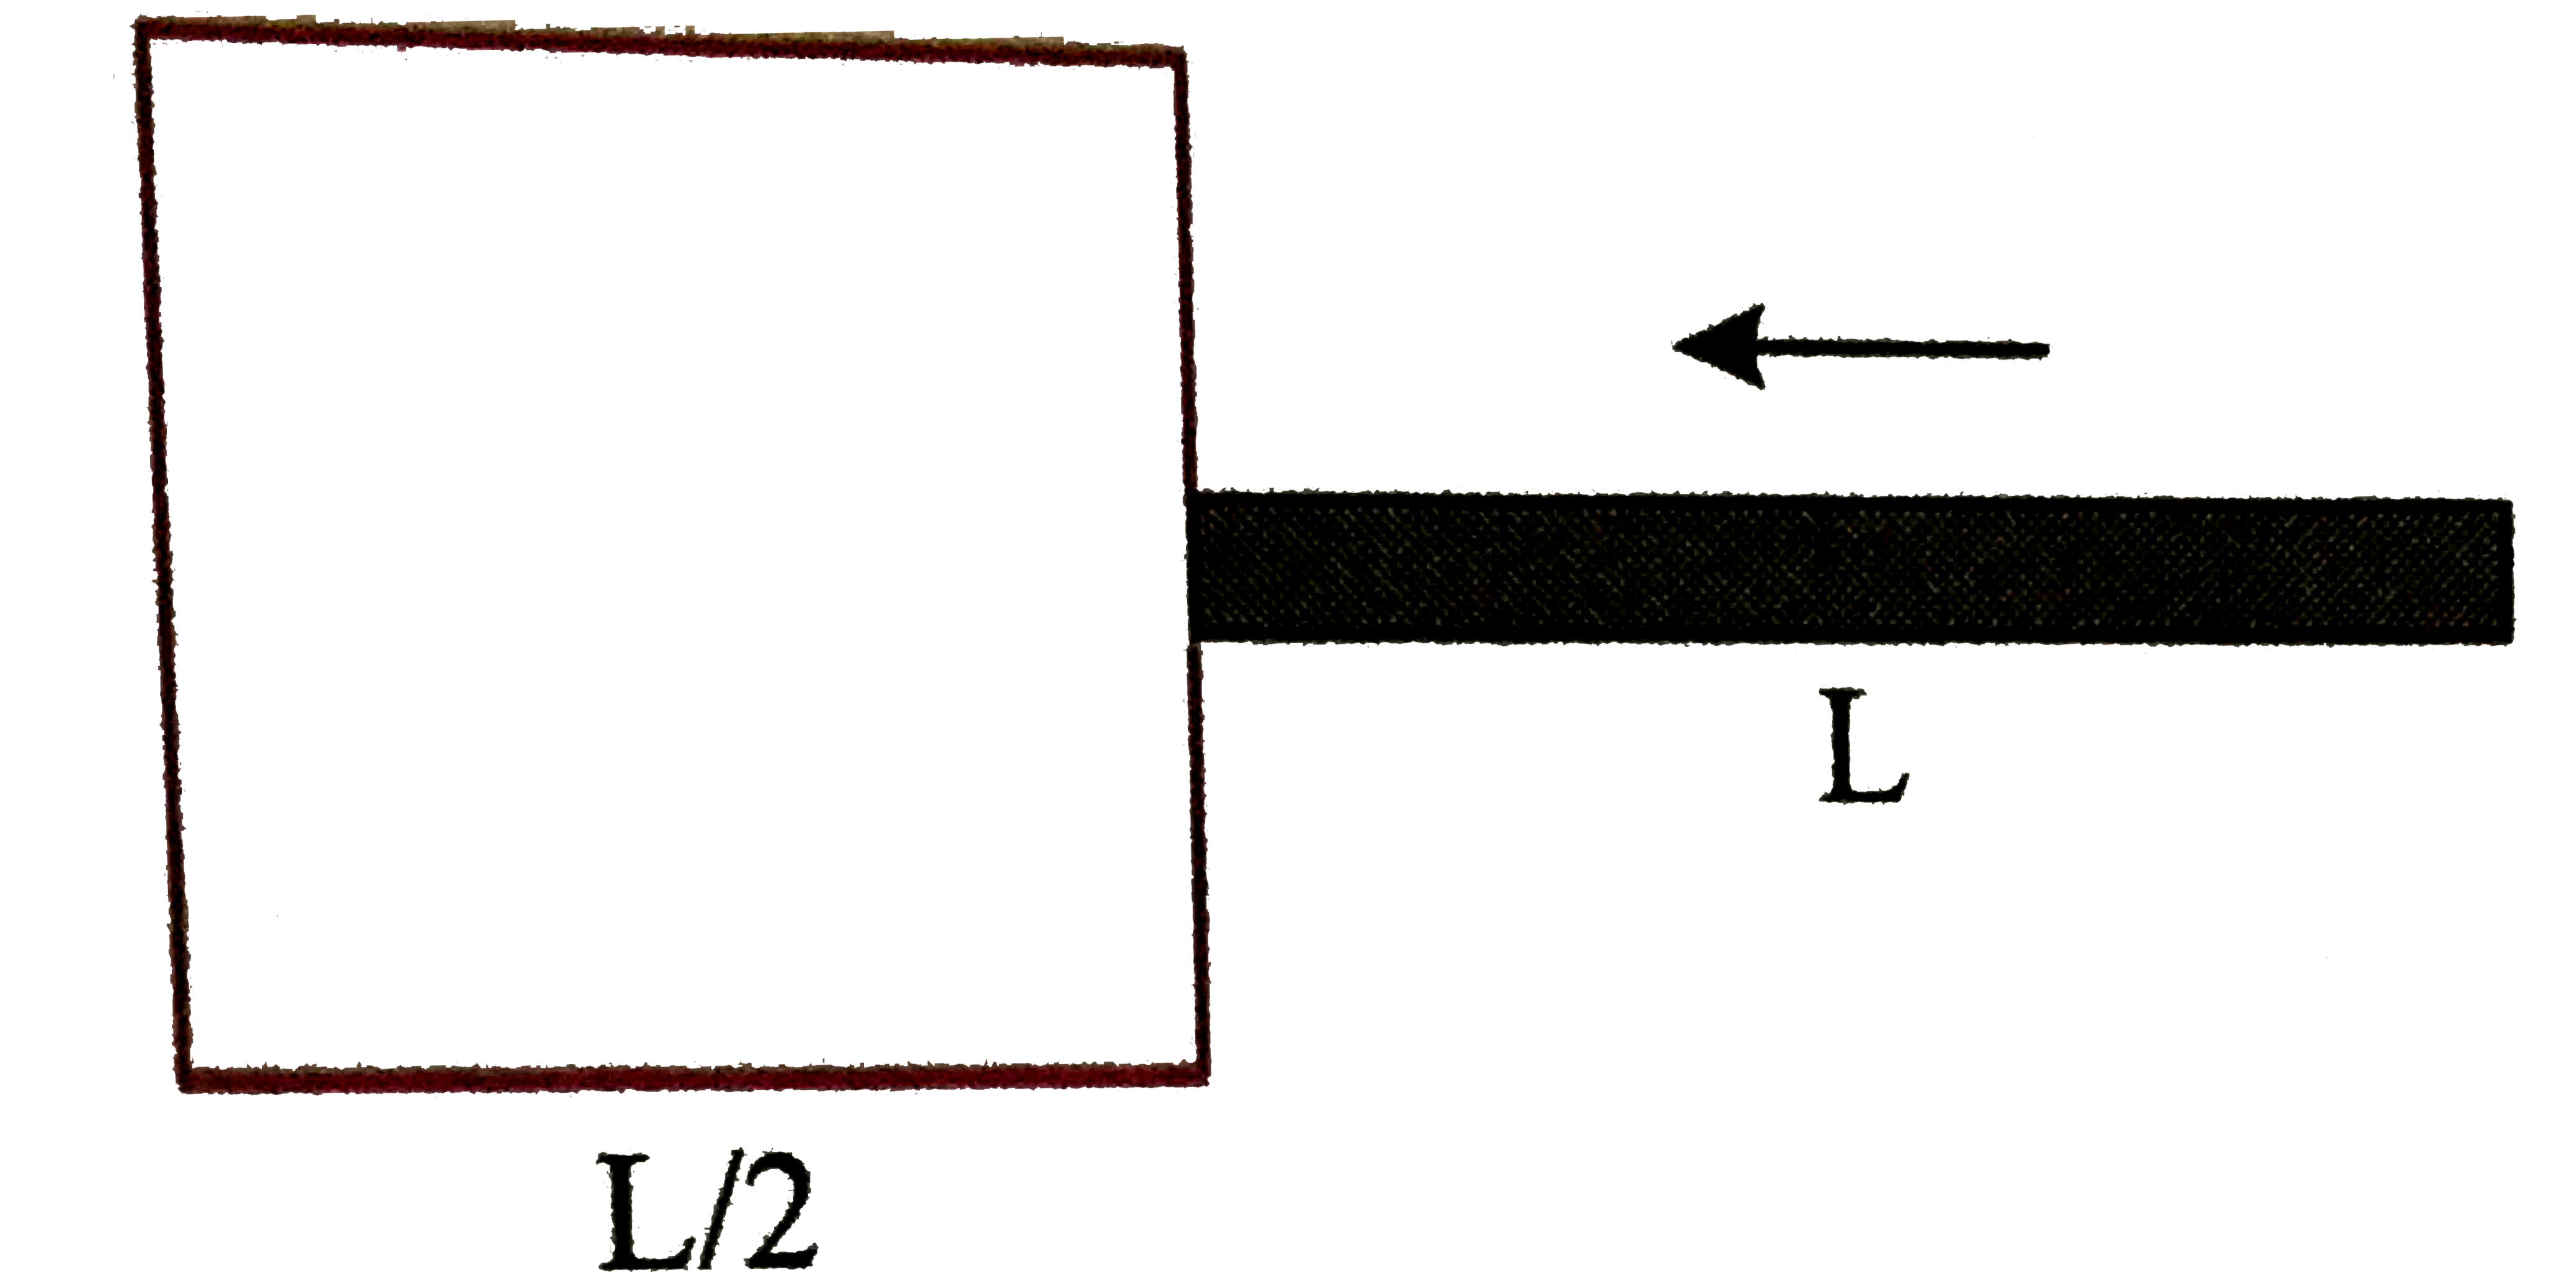
The figure shows an imaginary cube of length L/2 and a uniformly charged rod of length L touching the centre of the centre of the right face of the cube normally.At time t=0 the rod starts moving to the left slowly at a constant speed v .The electric flux (F) thriguh the cube si plotted against time (t) .The correct graph showing the variation of flux with time is
 A
A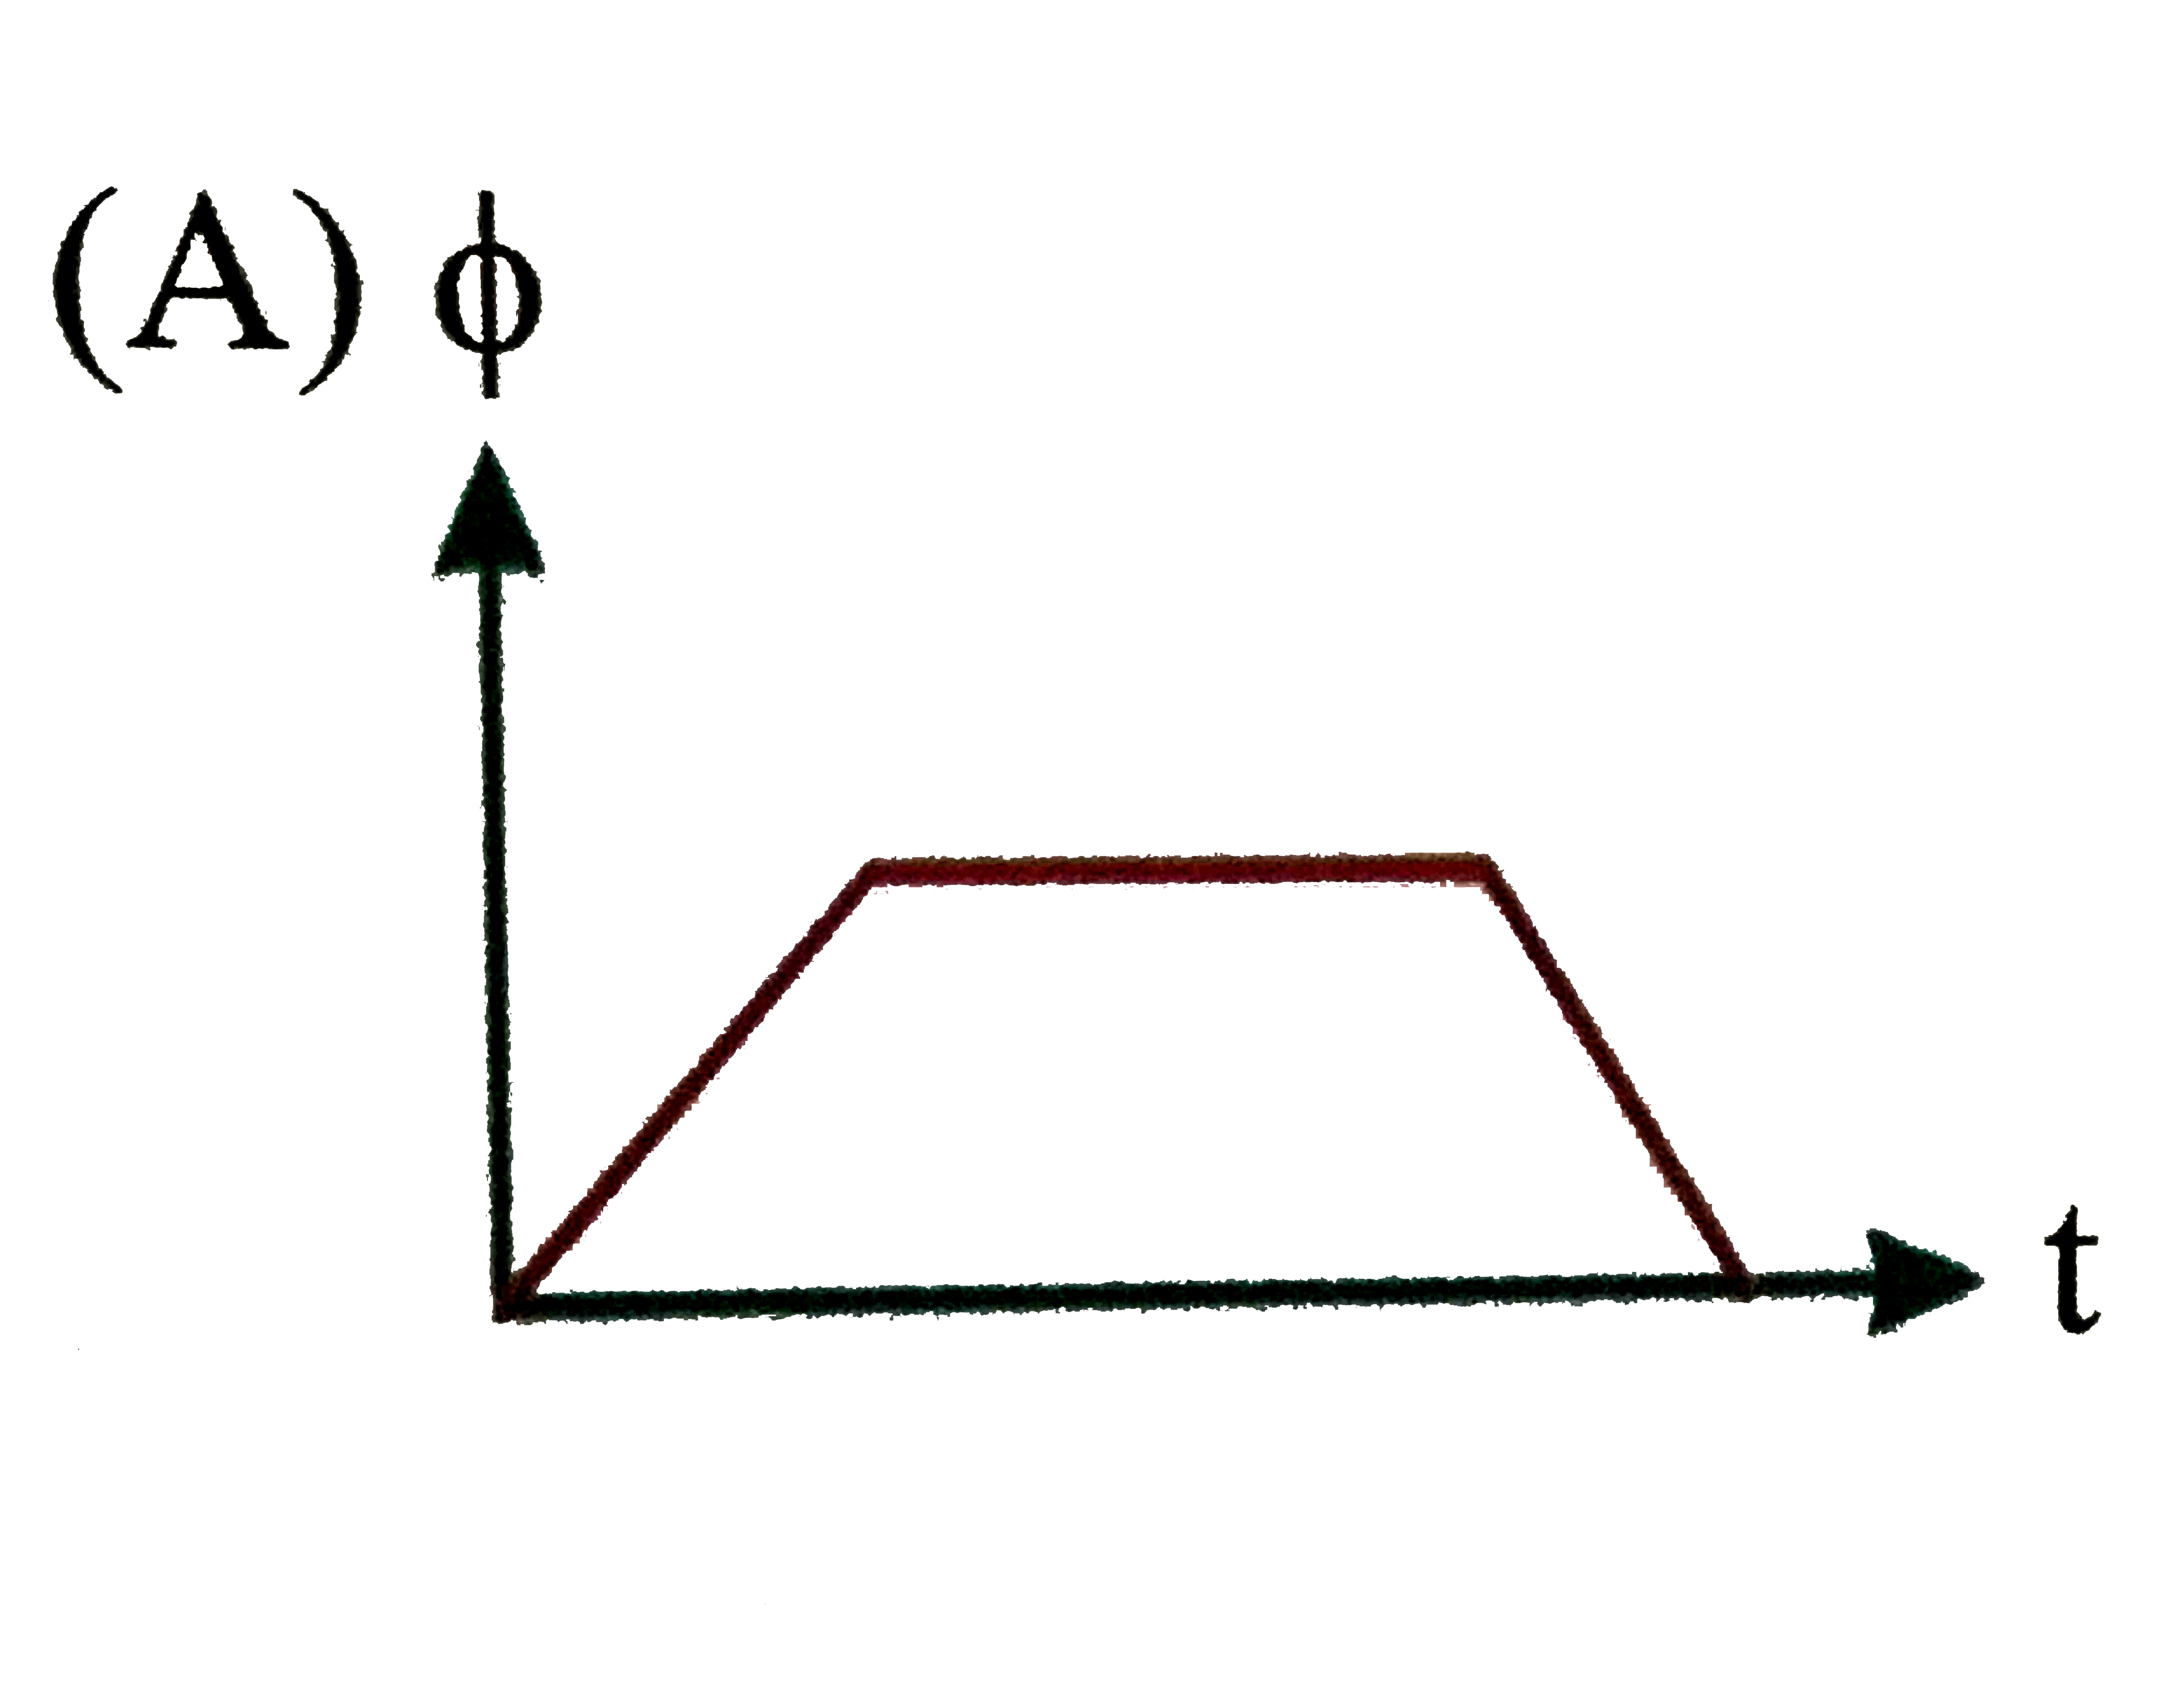 B
B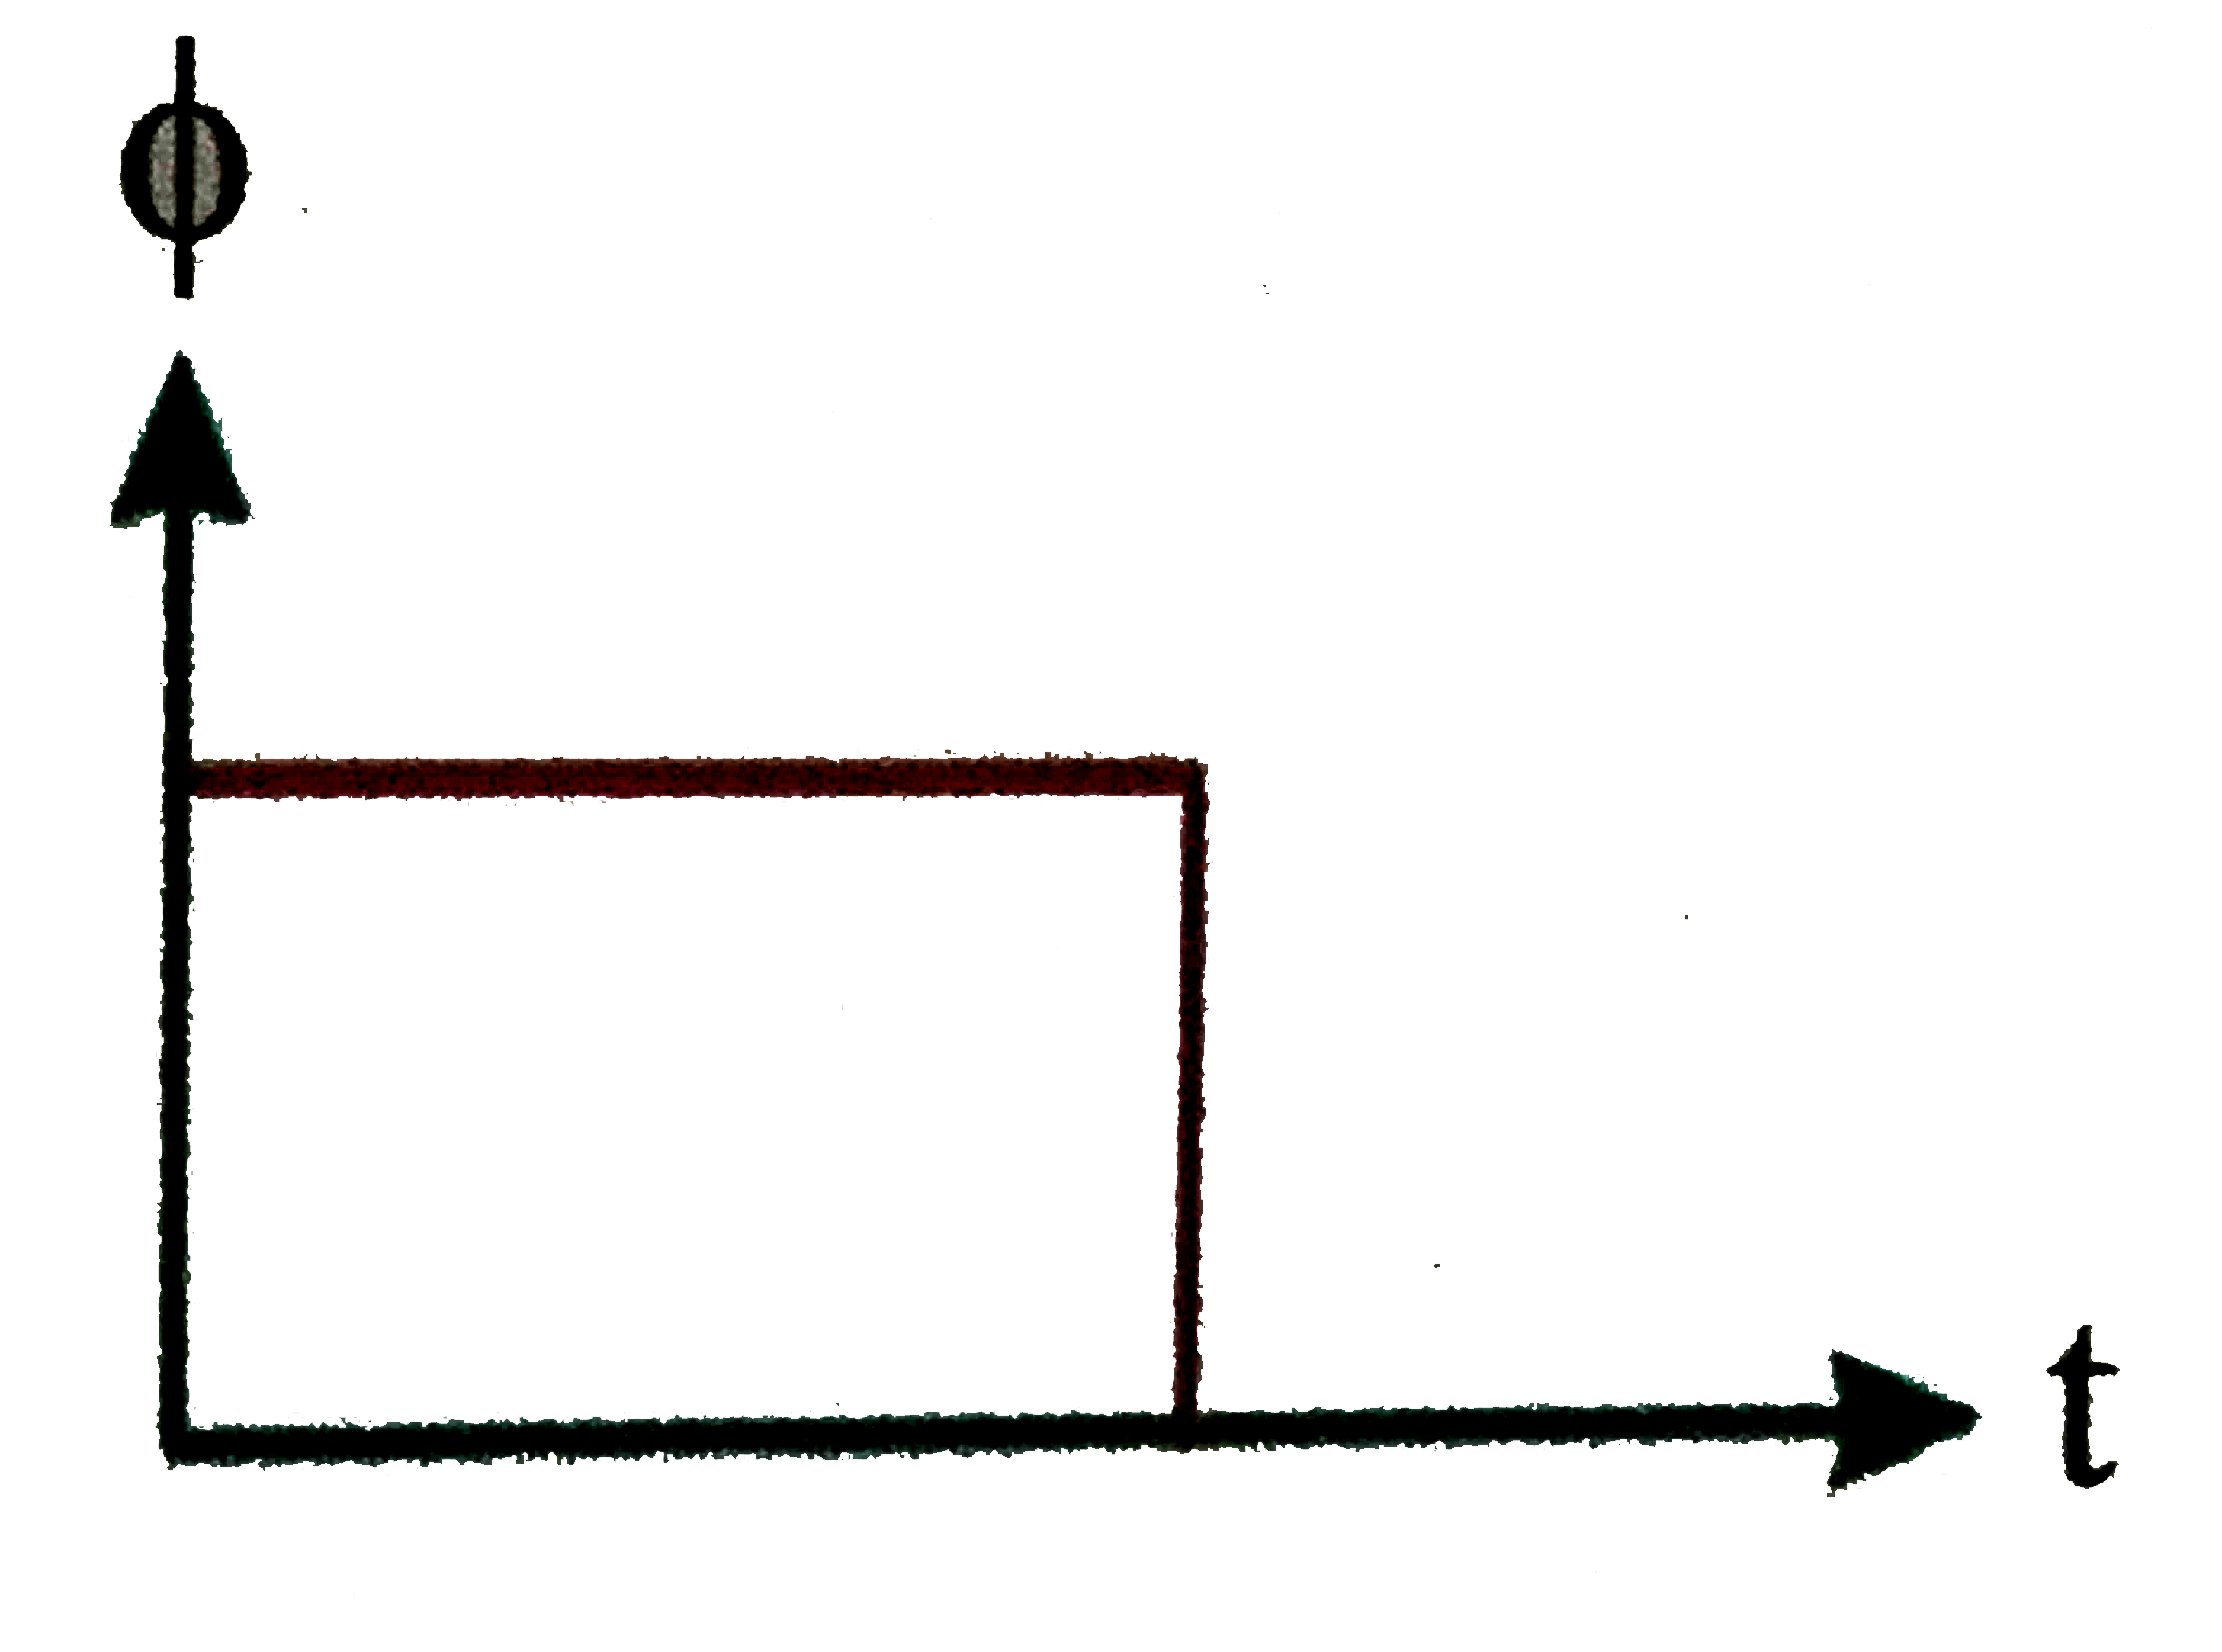 C
C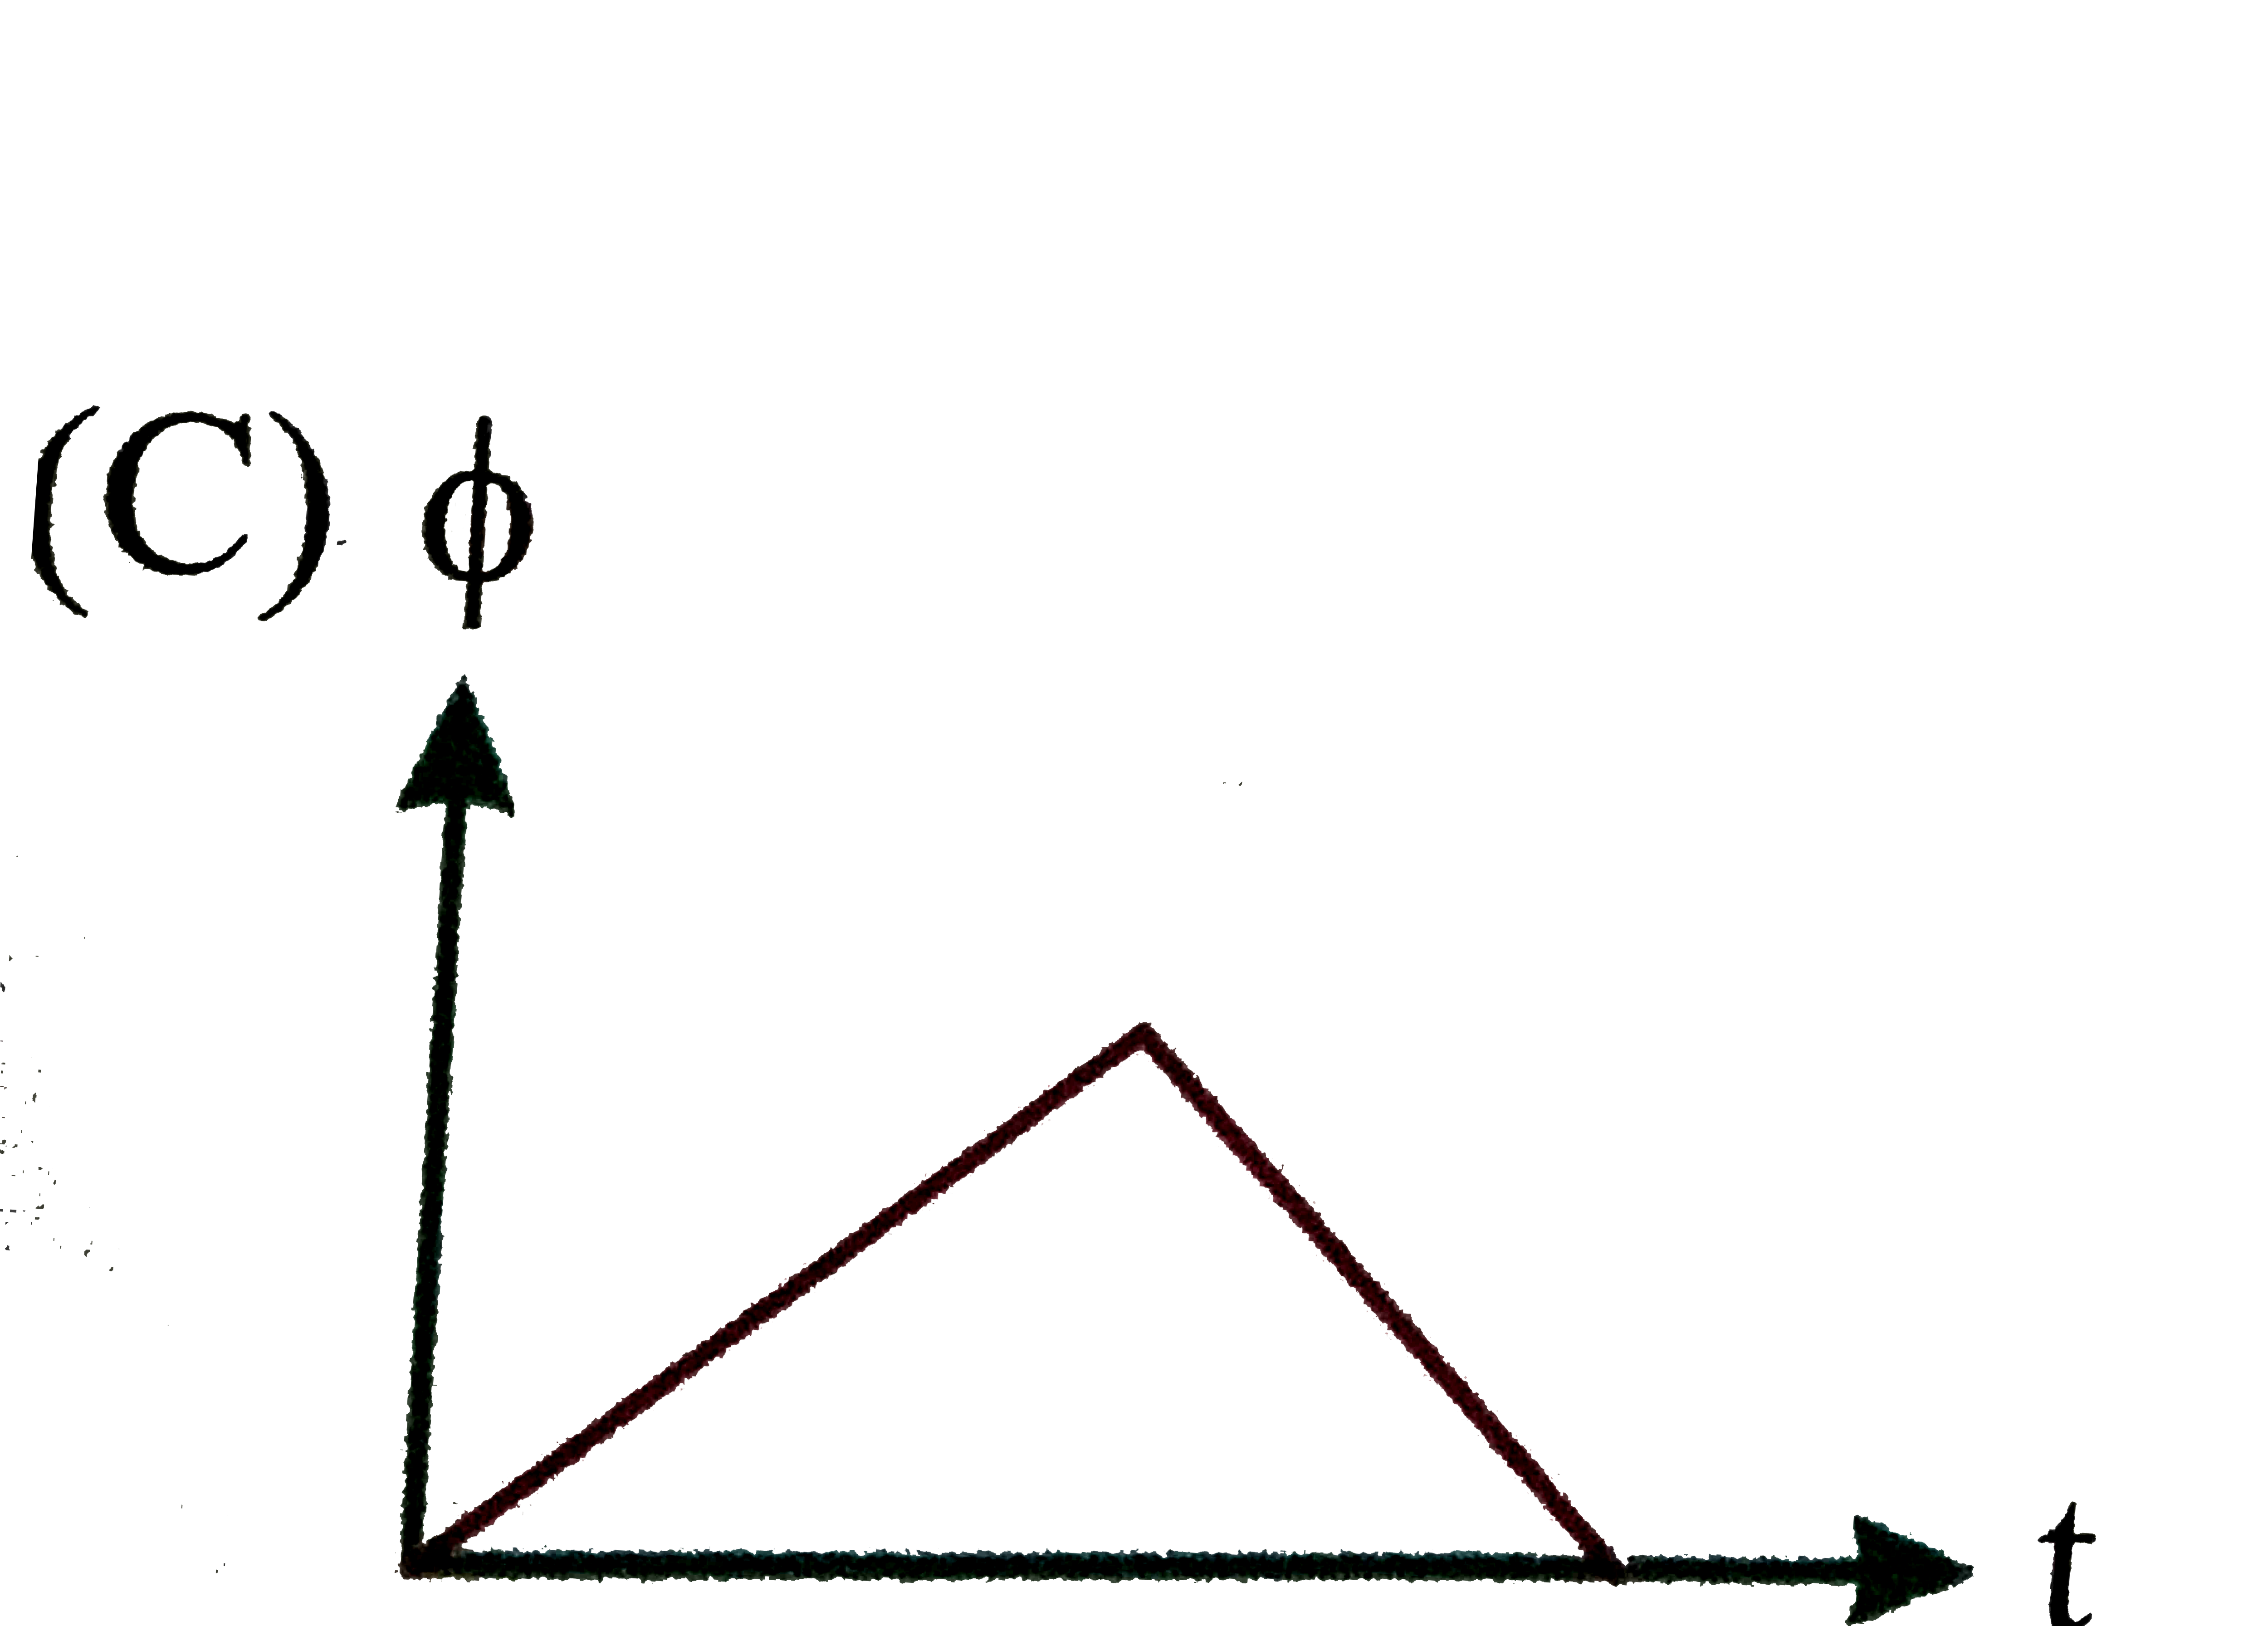 D
D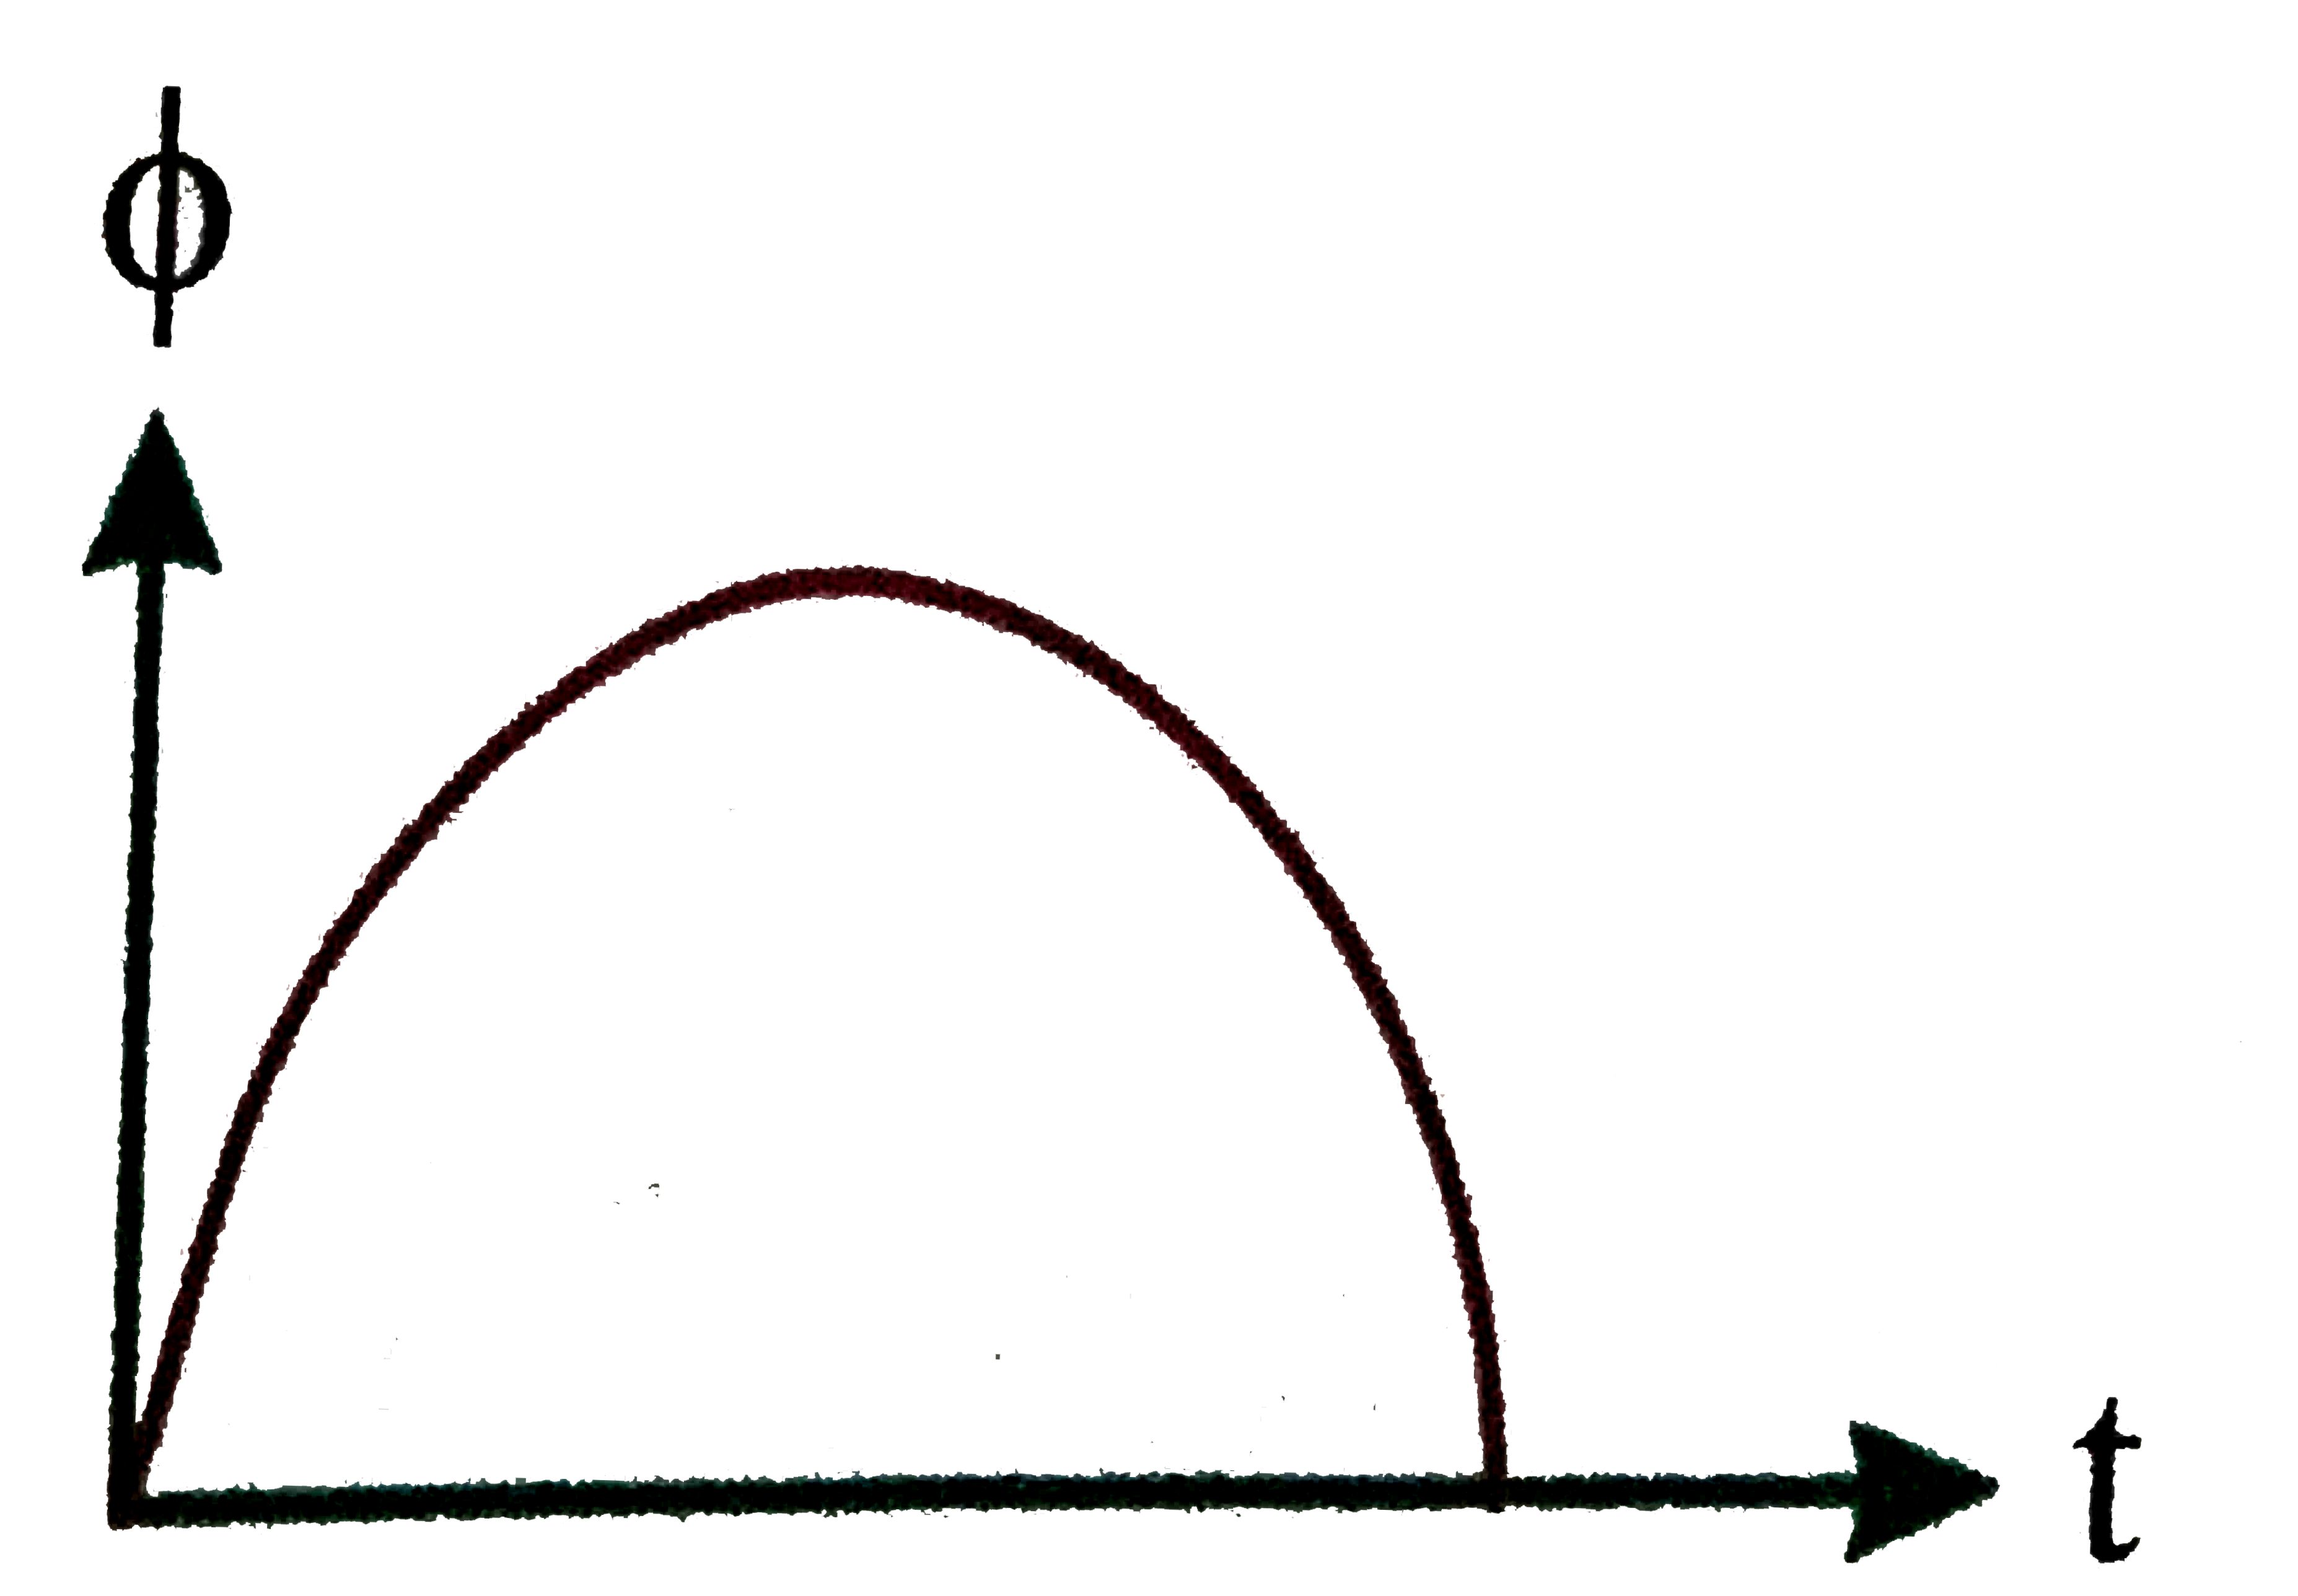
A long string with a charge of a per unit length passes through an imaginary cube of edge L. The maximum possible flux of electric field through the cube will be
AλLε0B√2λLε0C√3λLε0D√5λLε0Two infinite line charges each having uniform charges density lamdba .pass through the mid points of two pairs of opposite faces of a cube of edge L as shown in figure .The modulue of the total electric flux due to the both the line charges through the face
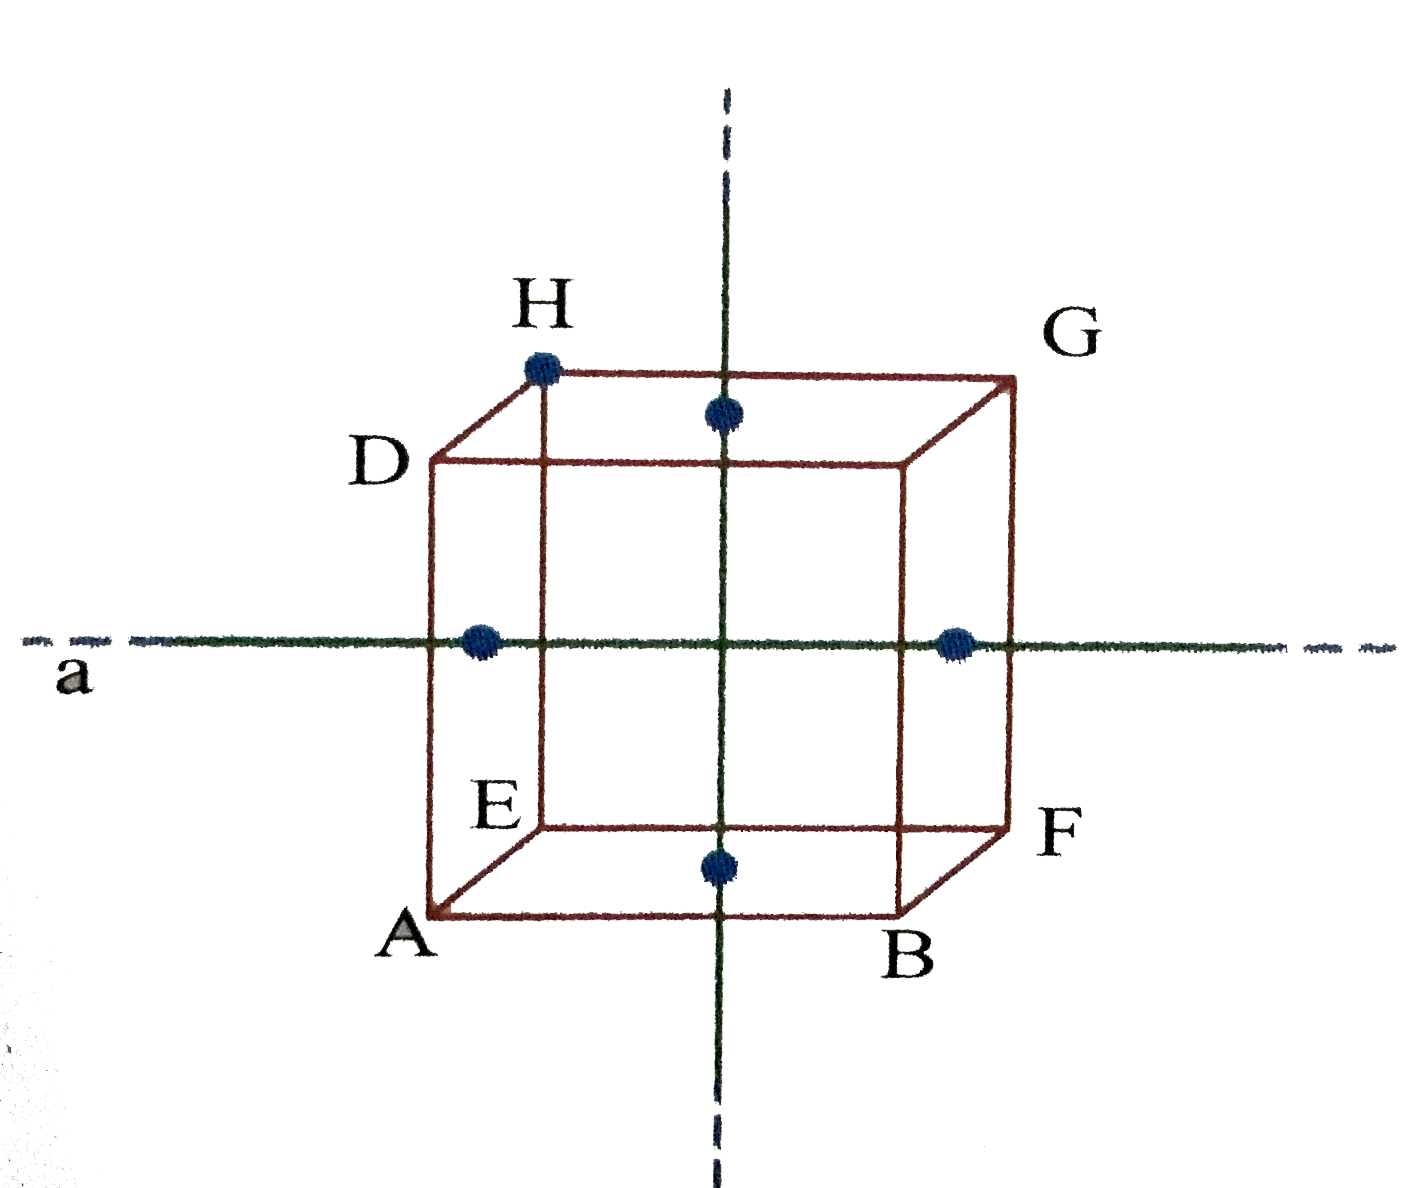 ACDHGis λl2ε0BAEHDis λl3ε0CABCD is λl2ε0DCDHG is λl3ε0
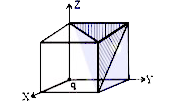
A charge 'q' is placed at one corner of a cube as shown in figure.The flux of electrostatic field →E through the shaded area is :
View SolutionA charge Q is uniformly distributed over a rod of length ι. Condider a hypothetical cube of edge ι with the centre of the cube at one end of the rod. Find the minimum possible flux of the electric field through the entire surface of the cube.
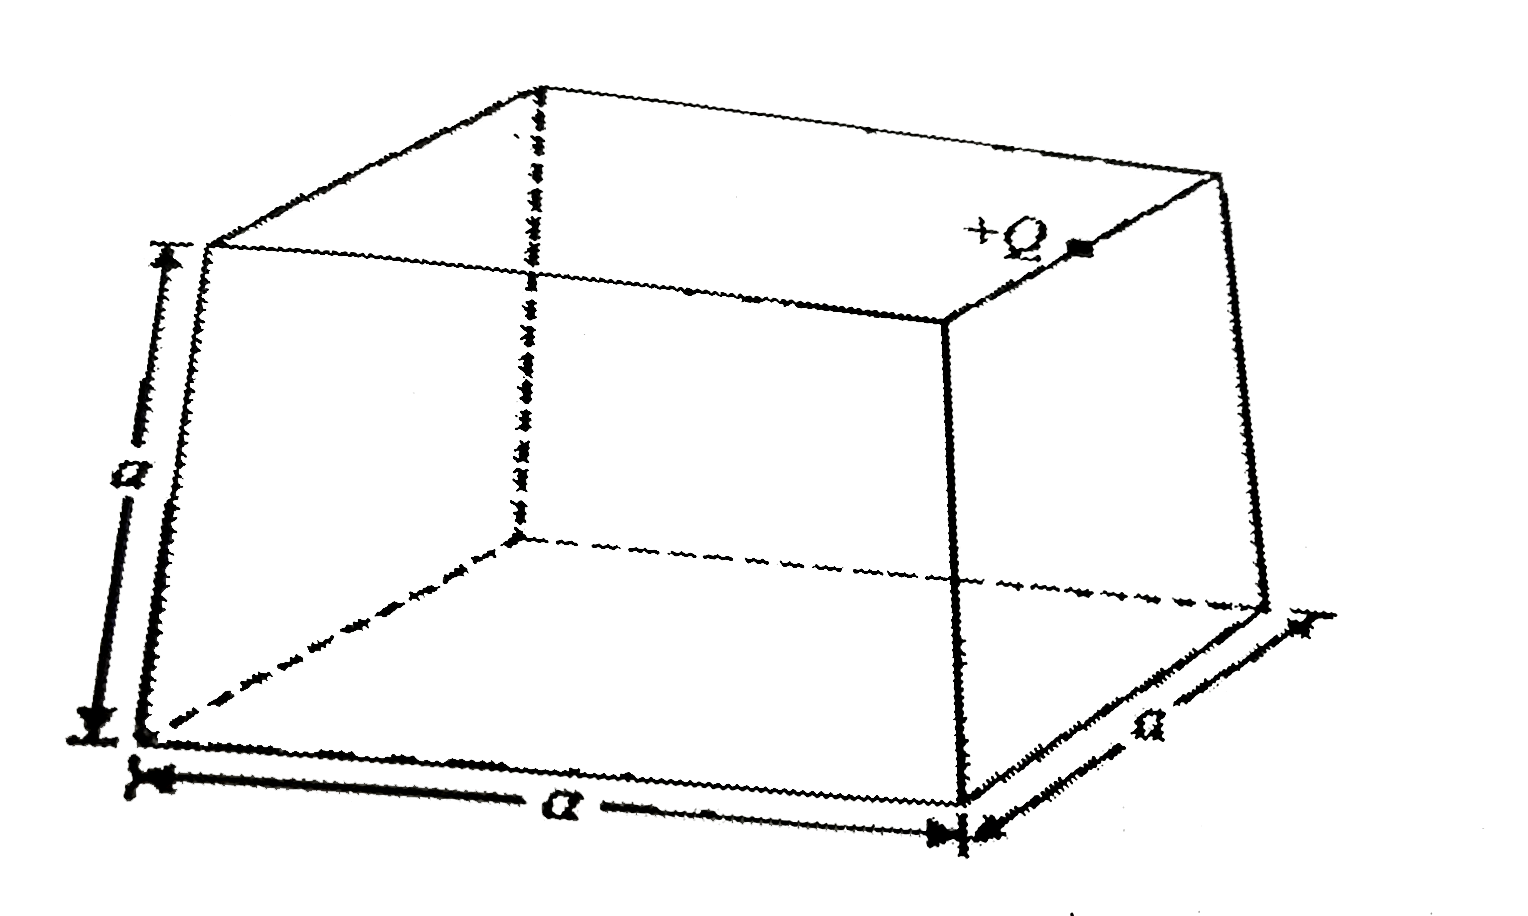
View SolutionIn figure +Q charge is located at one of the edge of the cube as shown in figure-1.376. Then electric flux through cube due to +Q charge is given as
View SolutionFigure shown a square loop of side l being moved towards right at a constant speed v . The front edge enters th emagnetic field B at t=0 . The width of field is 3l . Sketch induced emf versus time graph.

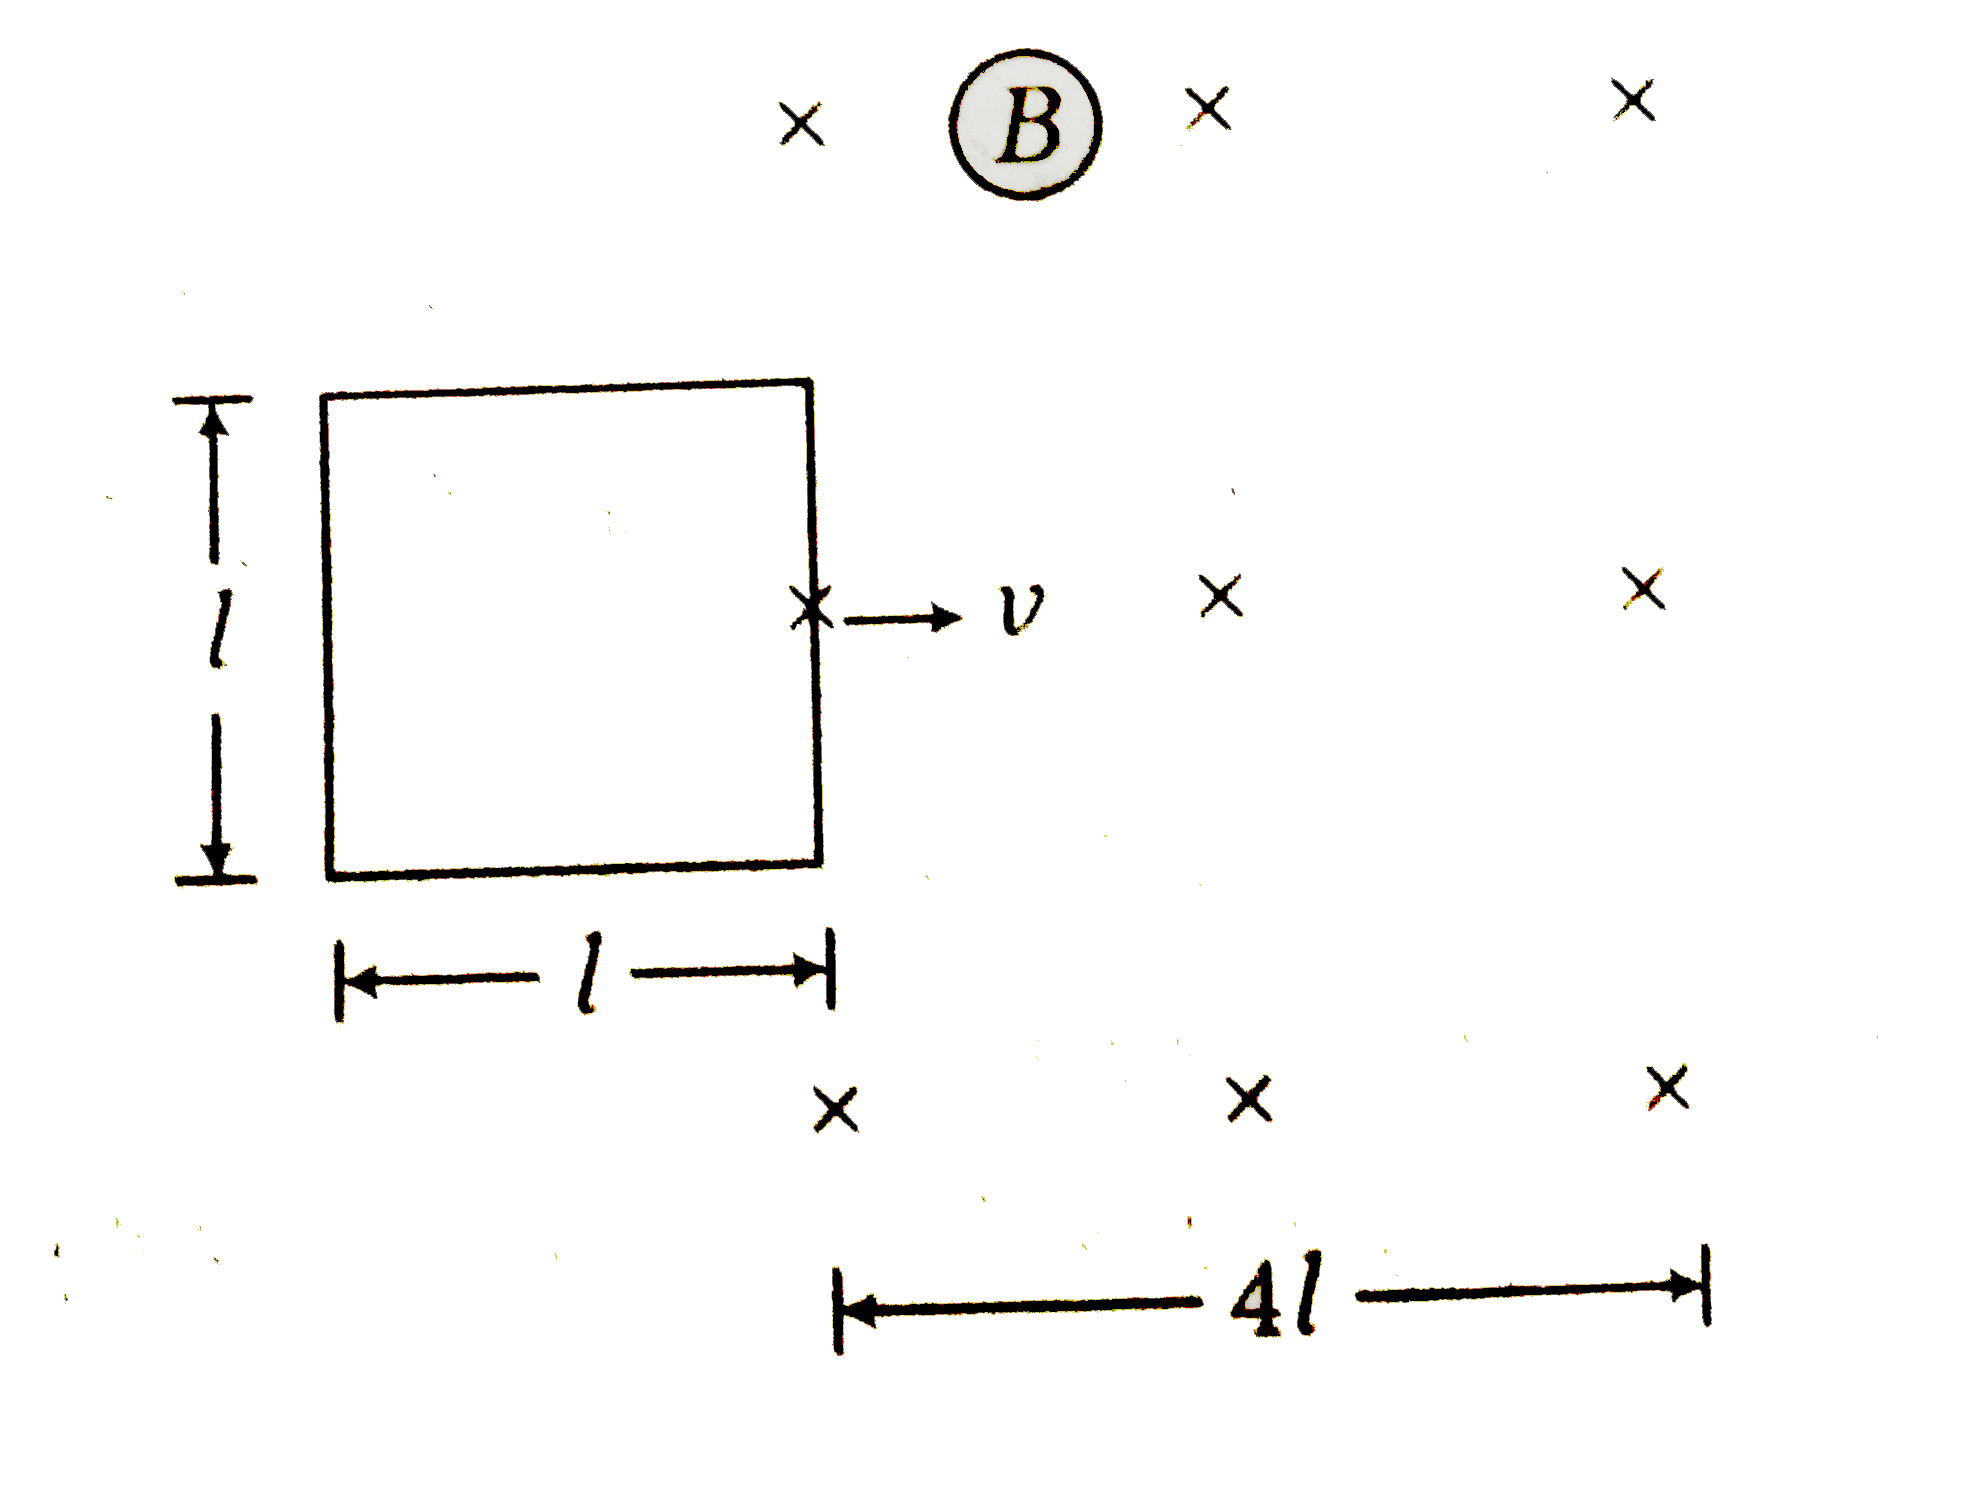
View SolutionA square loop of side l being moved towards right at a constant speed v as shown in figure. The front edge enters the magnetic field B at t = 0. The width of field is 4l. Sketch induced emf versus time graph.
View Solution

