
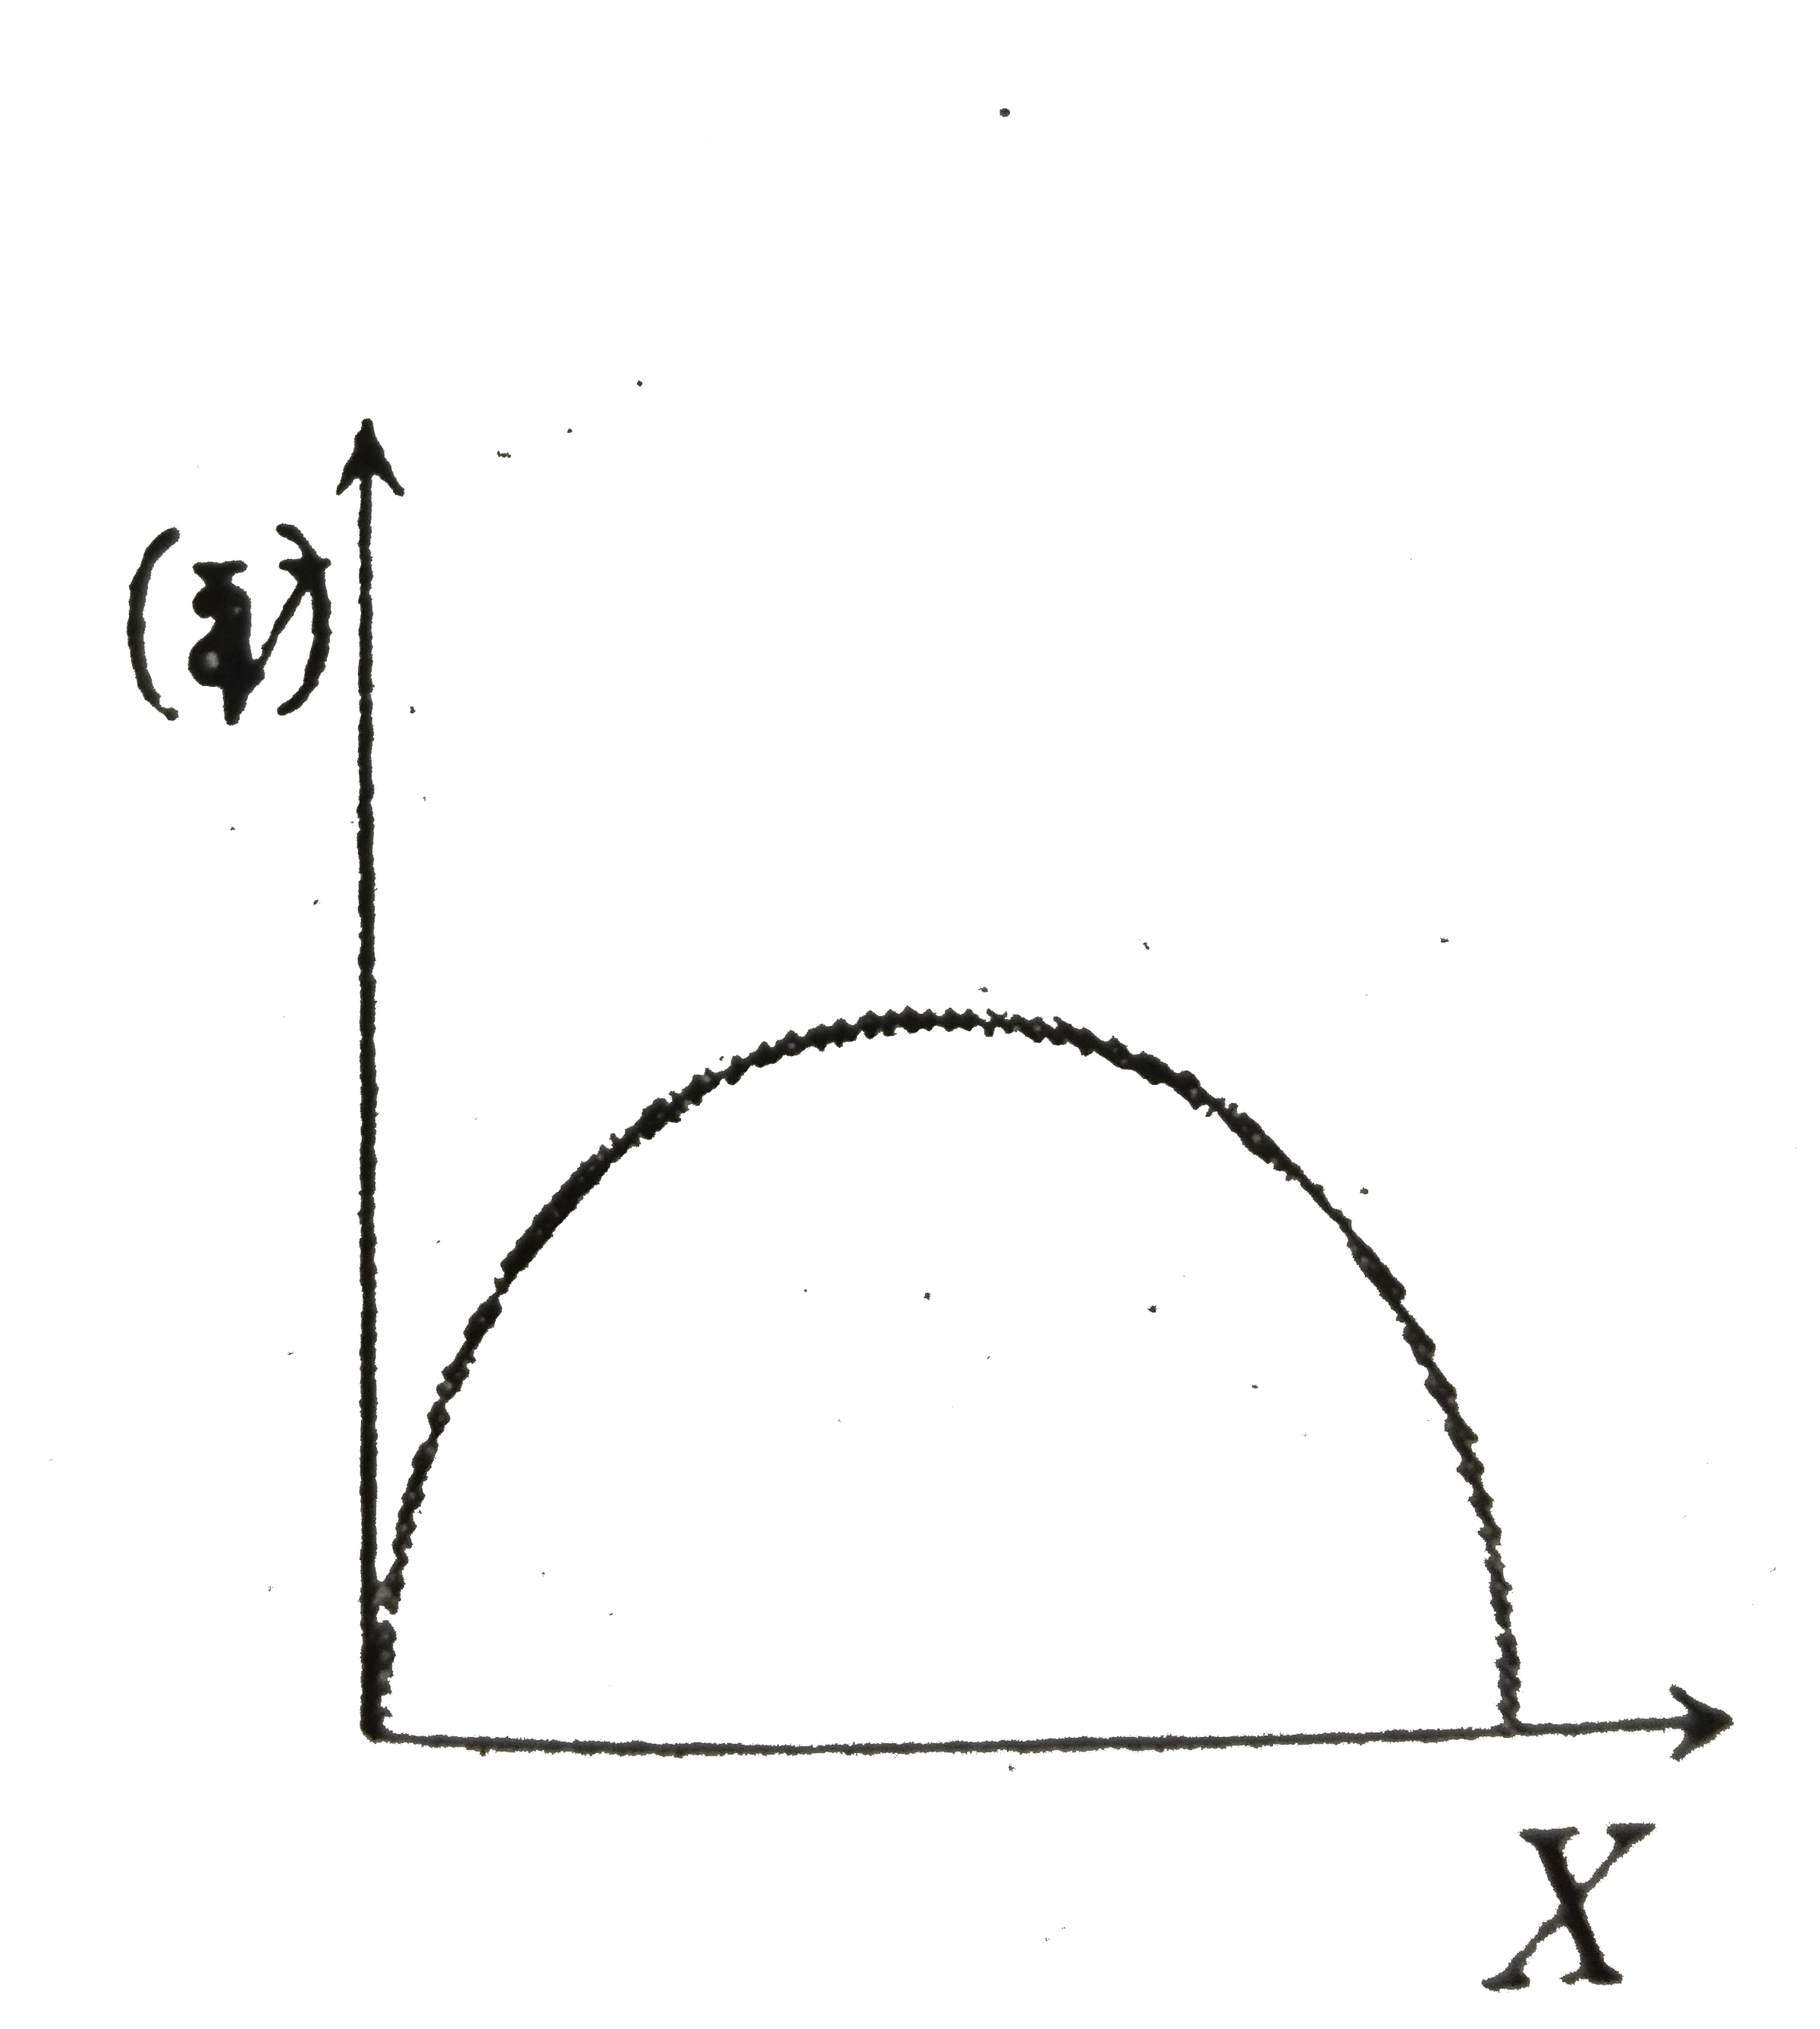
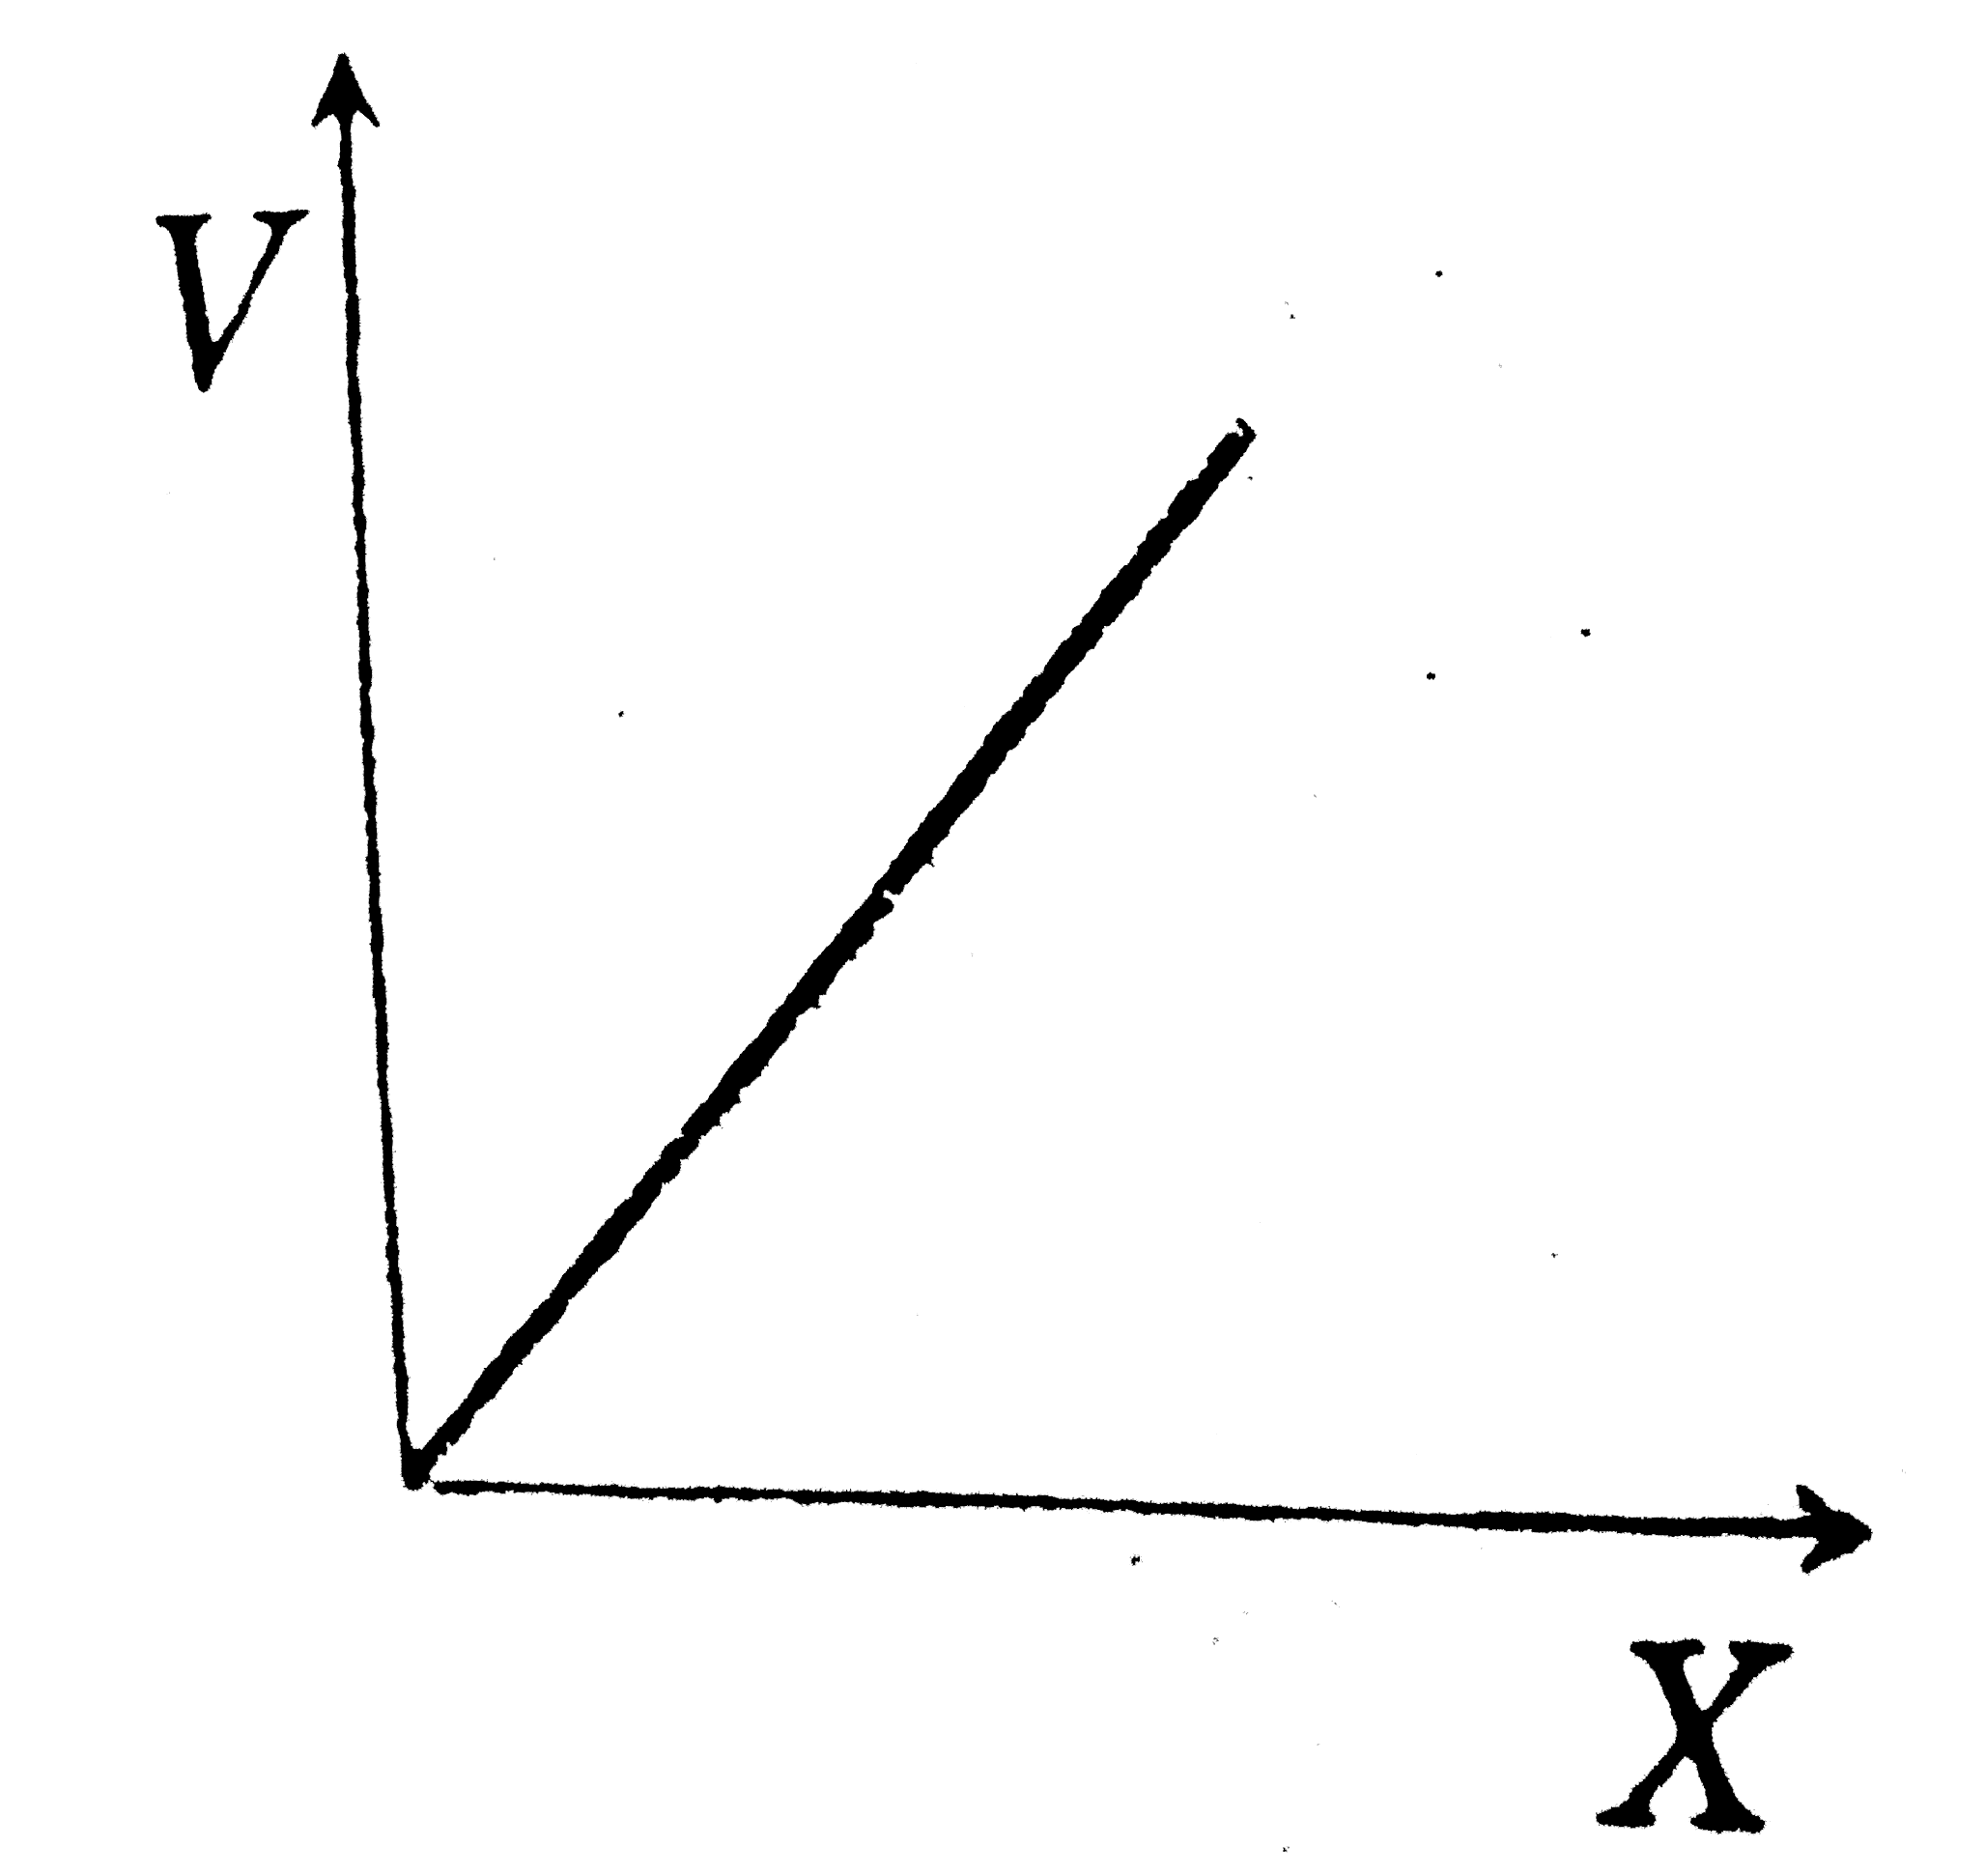
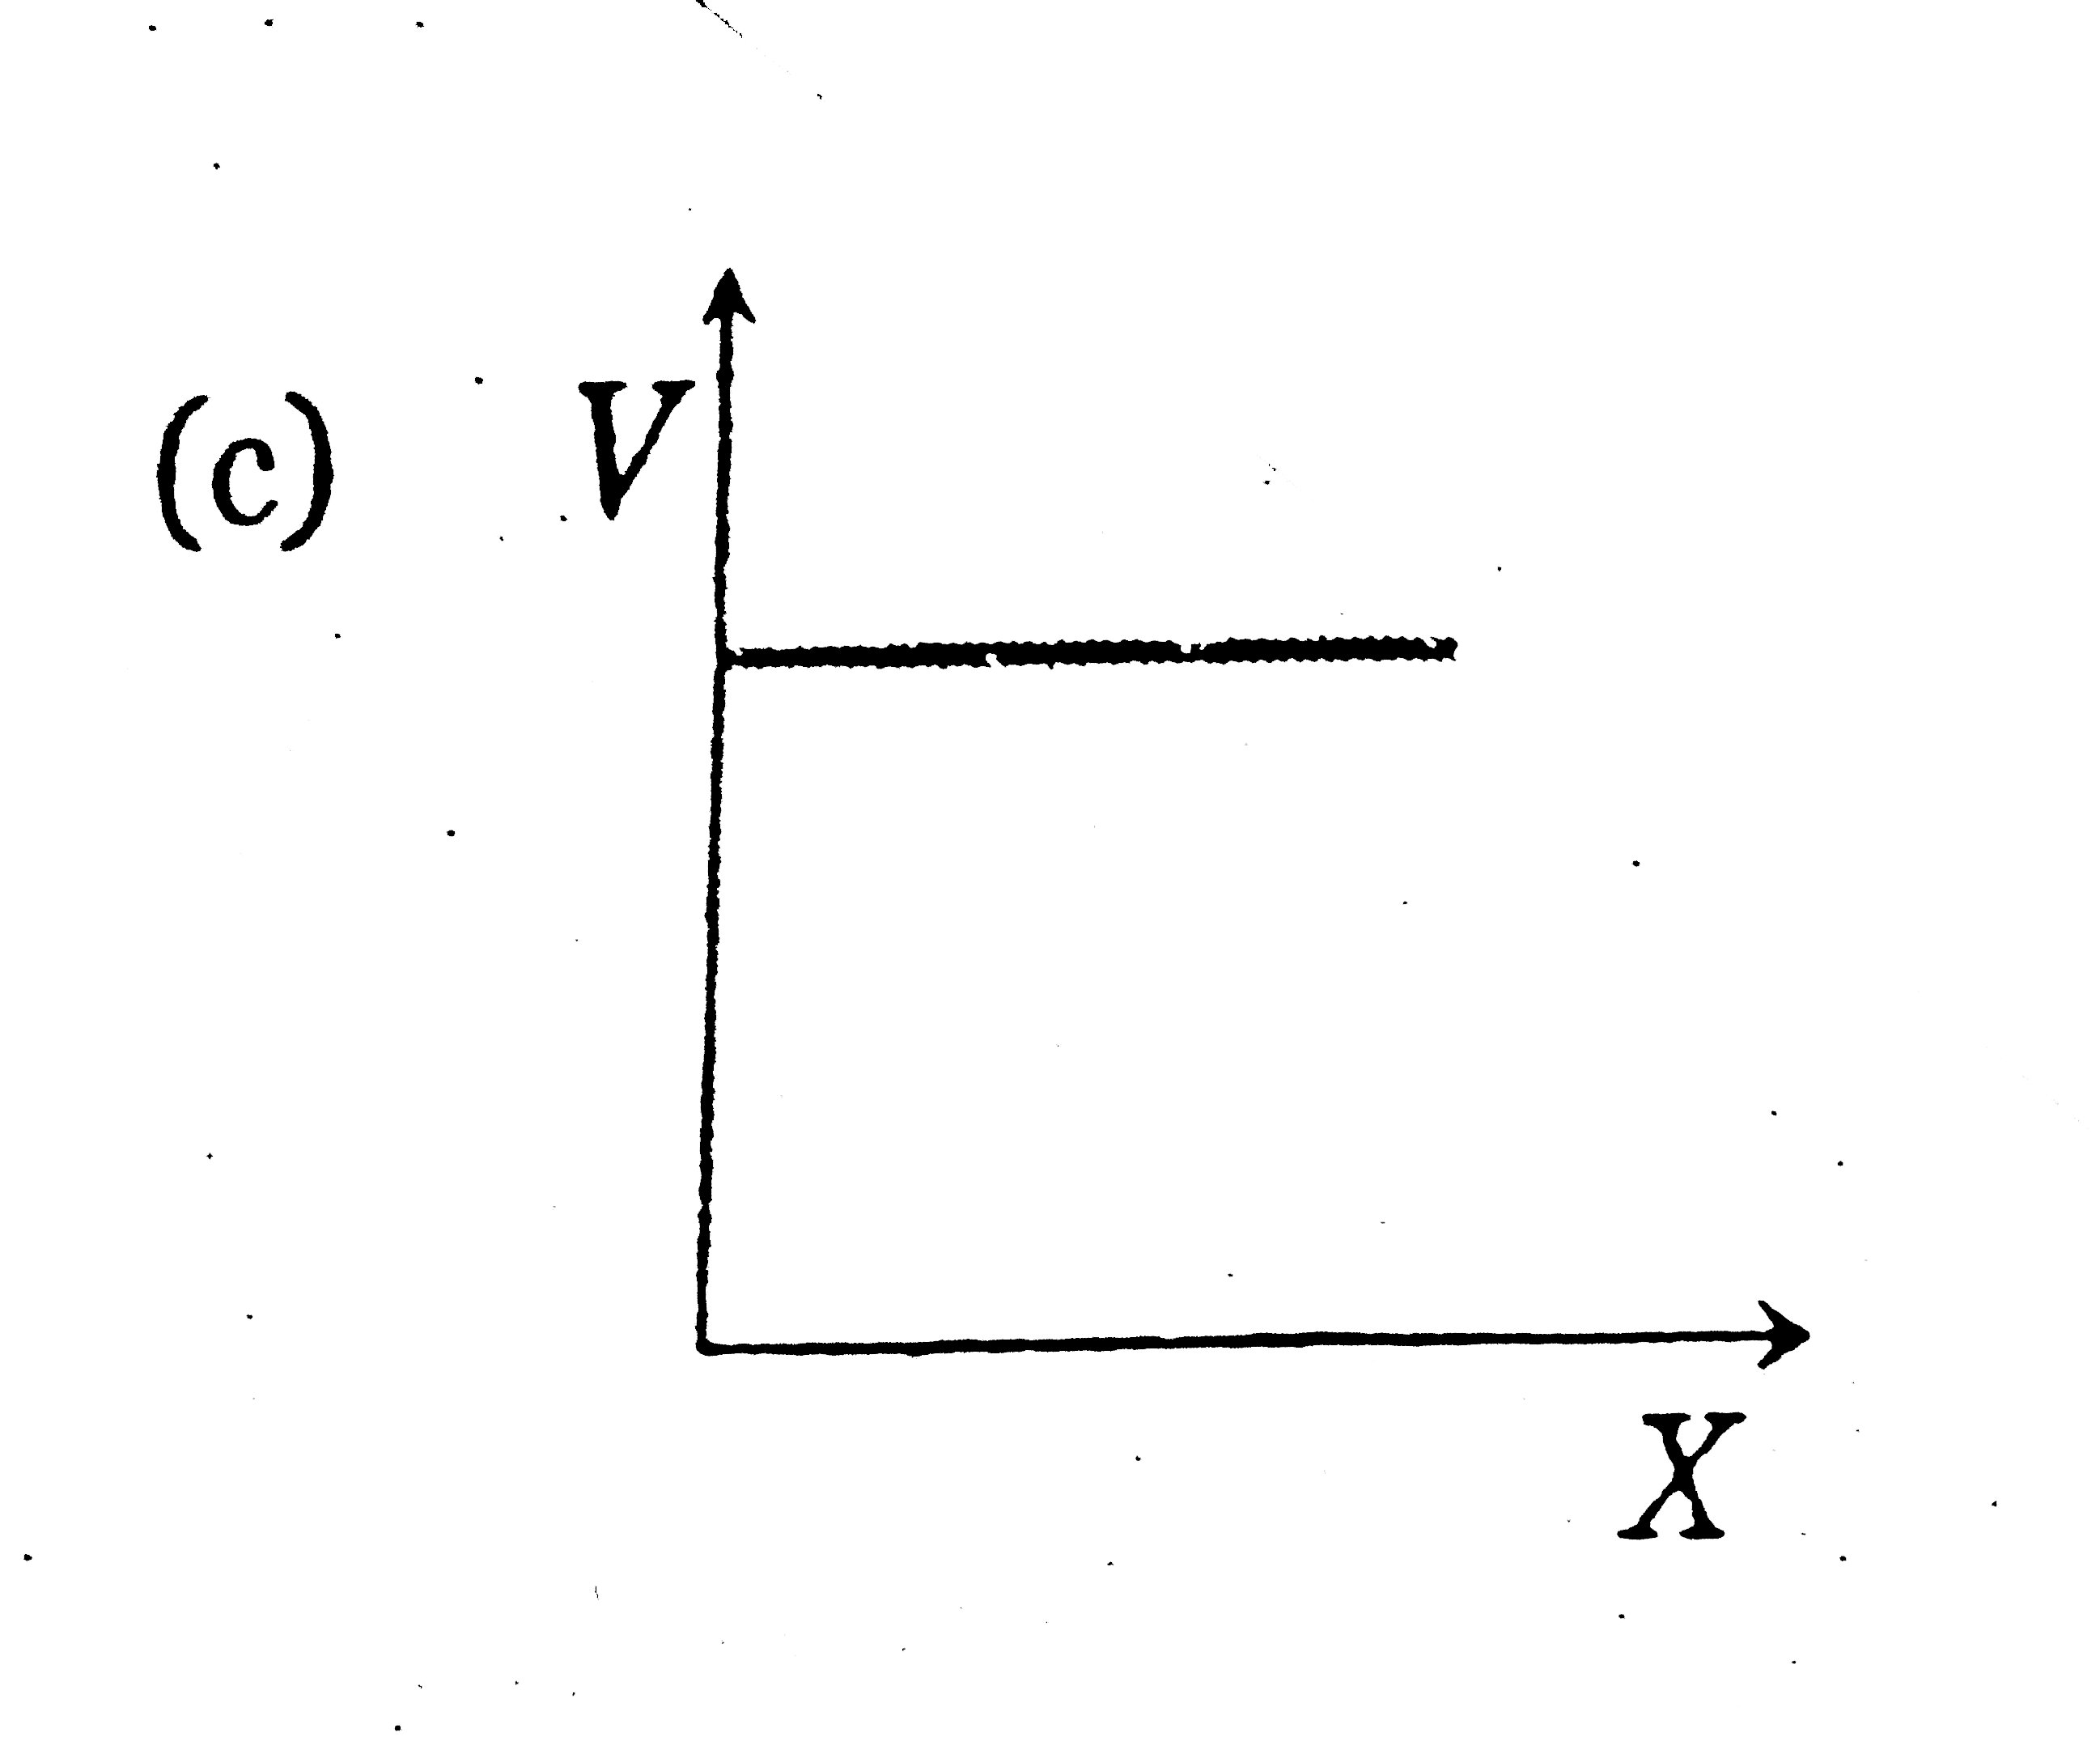
The diagram shows a cup of tea seen from above. The tea has been stirred and is now rotating without turbulence. A graph showing the speed v with which the liquid is crossing points at a distance X from O along a radius OX would took like
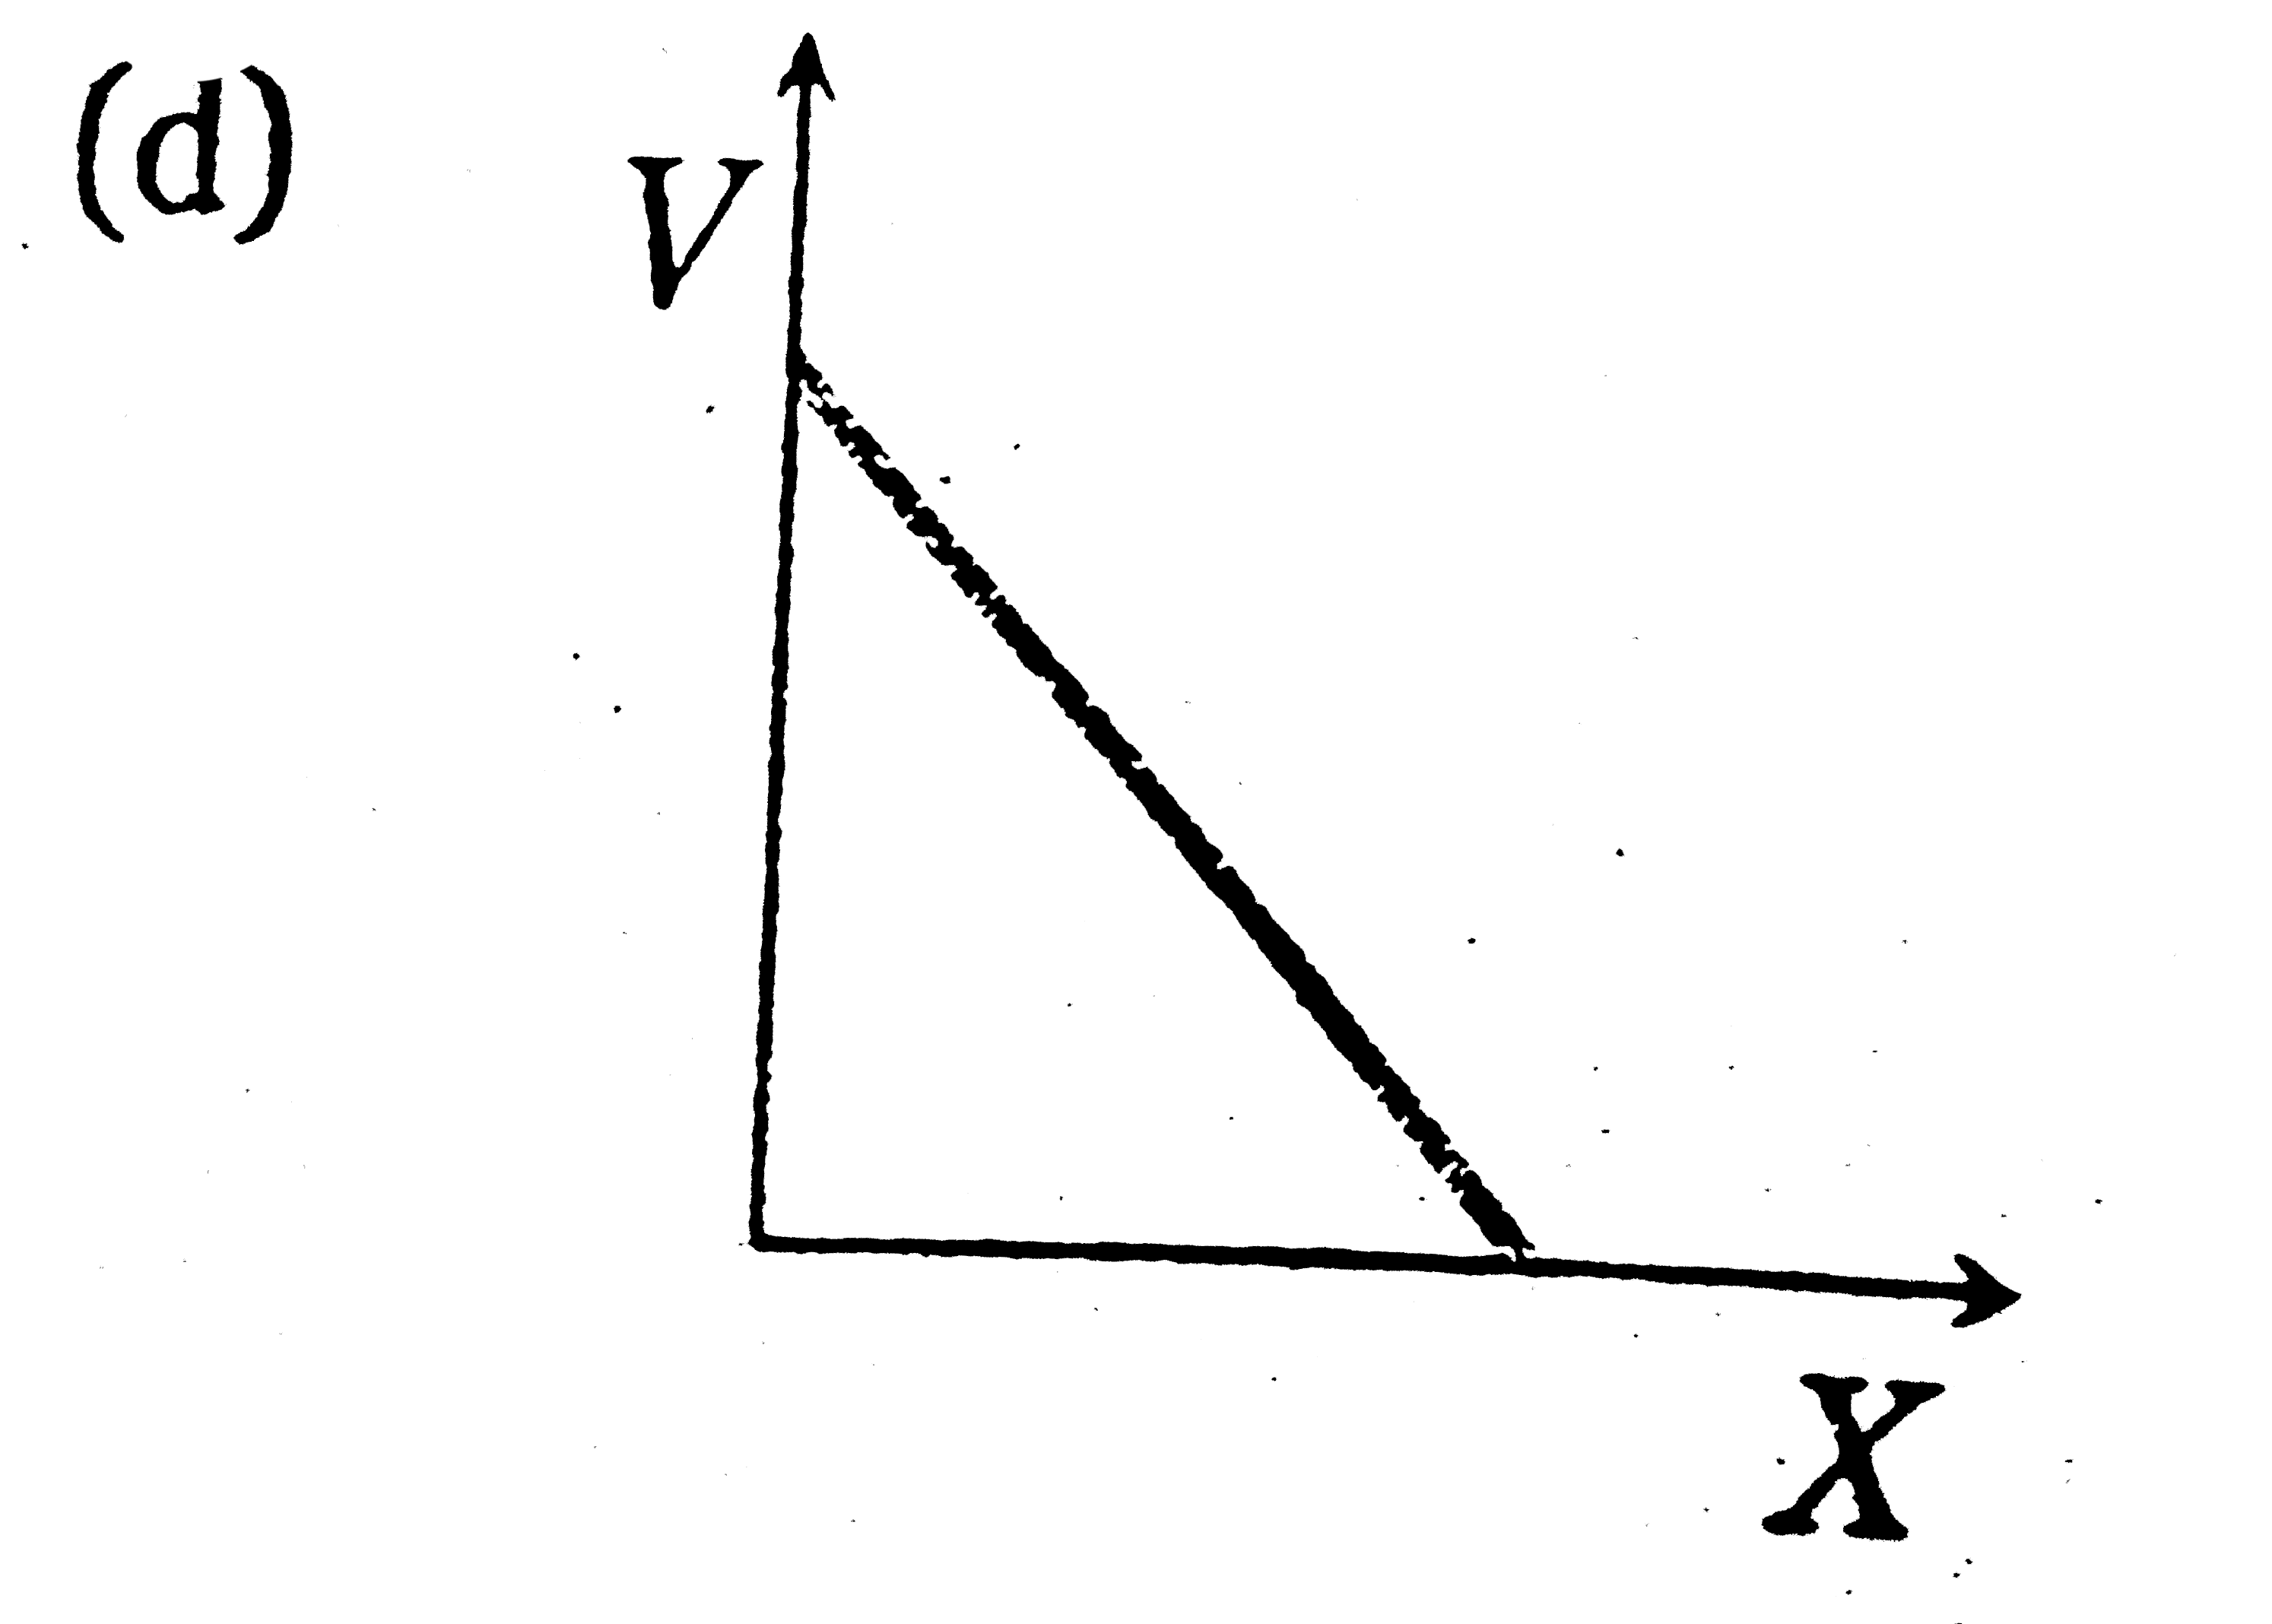
The correct Answer is:D
When we move from the centre to the circumference the velocity of liquid goes on decreasing and finally becomes zero
Topper's Solved these Questions
Similar Questions
Figure shows a cross section of a large metal. Sheet carrying an electric current along its surface. The current in a strip of width dl is Kdl where K is a constant. Find the magnetic field at a point P at a distance x from the metal sheet.

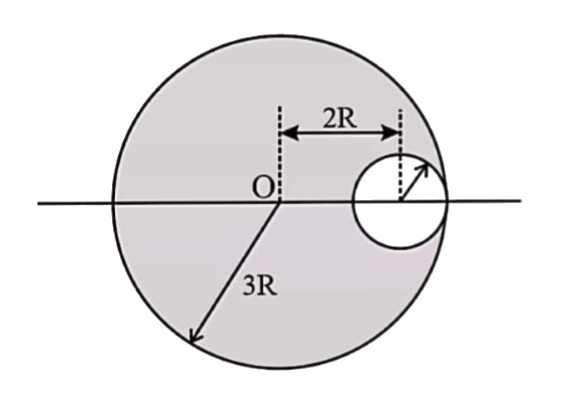
View SolutionThe figure shows a disc of radius 3R from which a circular hole of radius R is cut as shown in the figure. The distance of the centre of mass of the remaining object from the point O is
View Solution
Knowledge Check
The figure shows a system consisting of (i) a ring the outer radius 3R rolling clockwise without slipping on a horizontal surface with angular speed ω and (ii) an inner disc of radius 2R rotating anti clockwise with angular speed ω/2. The ring and disc are separated. The point P on the inner disc is at a distance R from the origin, where OP makes an angle of 30∘ with the horizontal. Then with respect to the horizontal surface,
Athe point O has linear velocity 3RωˆiBthe point P has linear velocity 114Rωˆi+√34Rωˆk.Cthe point P has linear velocity 134Rωˆi−√34RωˆkDthe point P has linear velocity ((3−√34)Rωˆi+14Rωˆk.The following diagram shows the electric field lines between two opposite charges. The positive charge is indicated by the black circle, the negative charge by the white circle. An electron string from rest at the indicated position (X), and accelerated to high speed by the electric field will follow most likely which trajectory?
A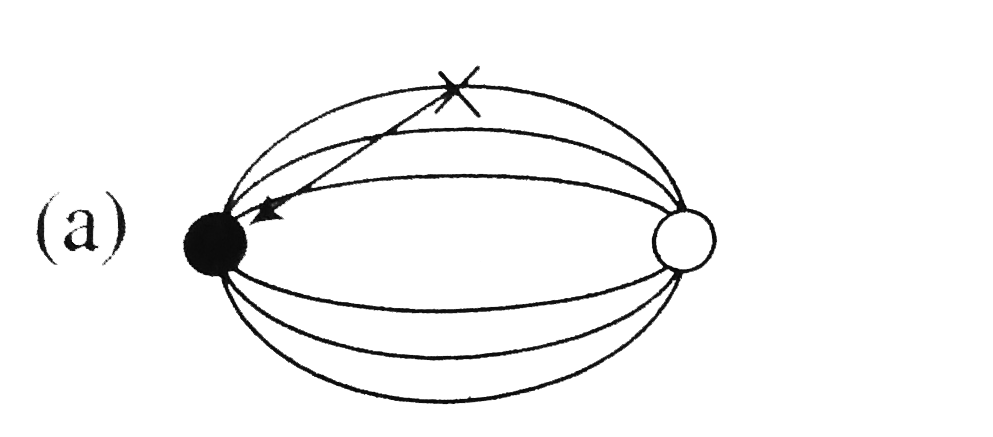 B
B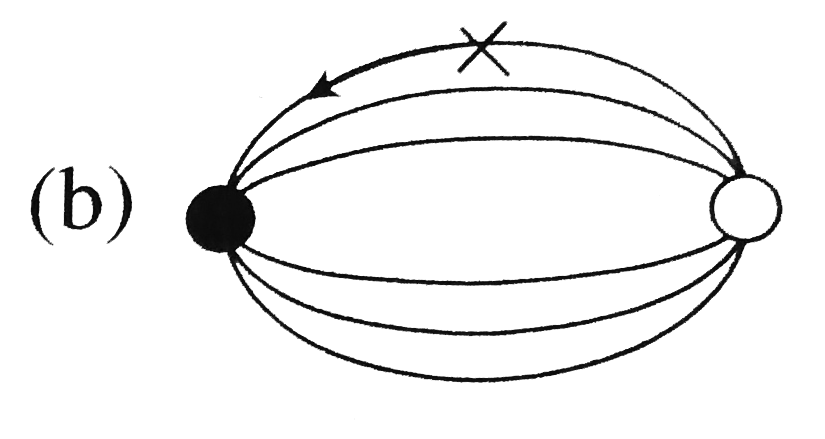 C
C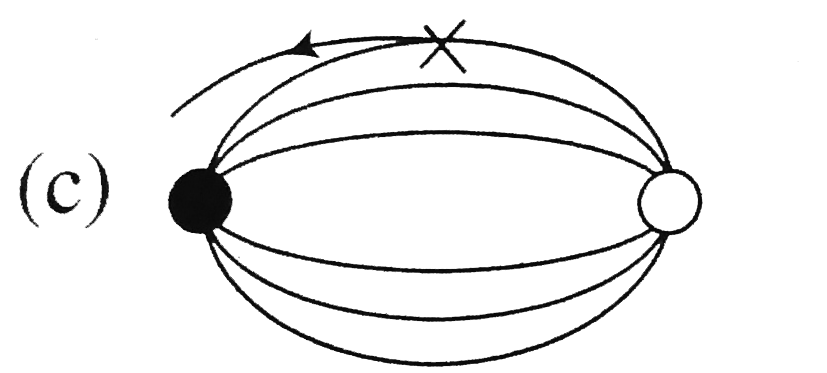 D
D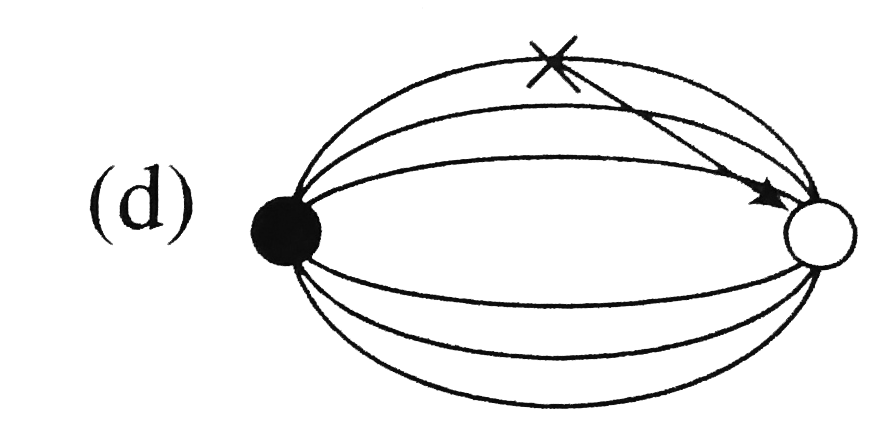
In a uniform electric field, a point charge of mass m and charge q is released from rest. If there are no other forces acting on the particle, then which of the following graphs, correctly show the dependence of the particles speed v on the distance x travelled by the particles speed v on the distance x travelled by it? [Graphs are schematic and not drawn to scale]
A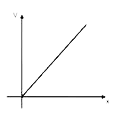 B
B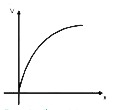 C
C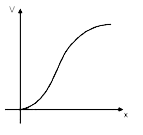 D
D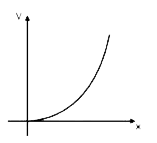
A point source of light S is placed at the bottom of a vessel containing a liquid of refractive index 5/3. A person is viewing the source from above the surface. There is an opaque disc of radius 1cm floating on the surface. The centre of disc lies vertically above the source O. The liquid from the vessel is gradually drained out through a tap. What is the maximum height of the liquid for which the source cannot be seen at all.
View SolutionIn a uniform electric field, a point charge of mass m and charge q is released from rest. If there are no other forces acting on the particle, then which of the following graphs, correctly show the dependence of the particles speed v on the distance x travelled by the particles speed v on the distance x travelled by it? [Graphs are schematic and not drawn to scale]
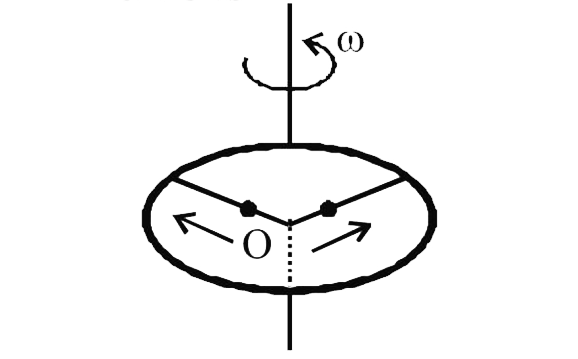
View SolutionA ring of mass M and radius R is rotating with angular speed ω about a fixed vertical axis passing through its centre O with two point masses each of mass M8 at rest at O. These masses can move radially outwards along two massless rods fixed on the ring as shown in the figure. At some instant the angular speed of the system is 89ω and one fo the masses is at a distance of 35R from O. At this instant the distance of the other mass from O is
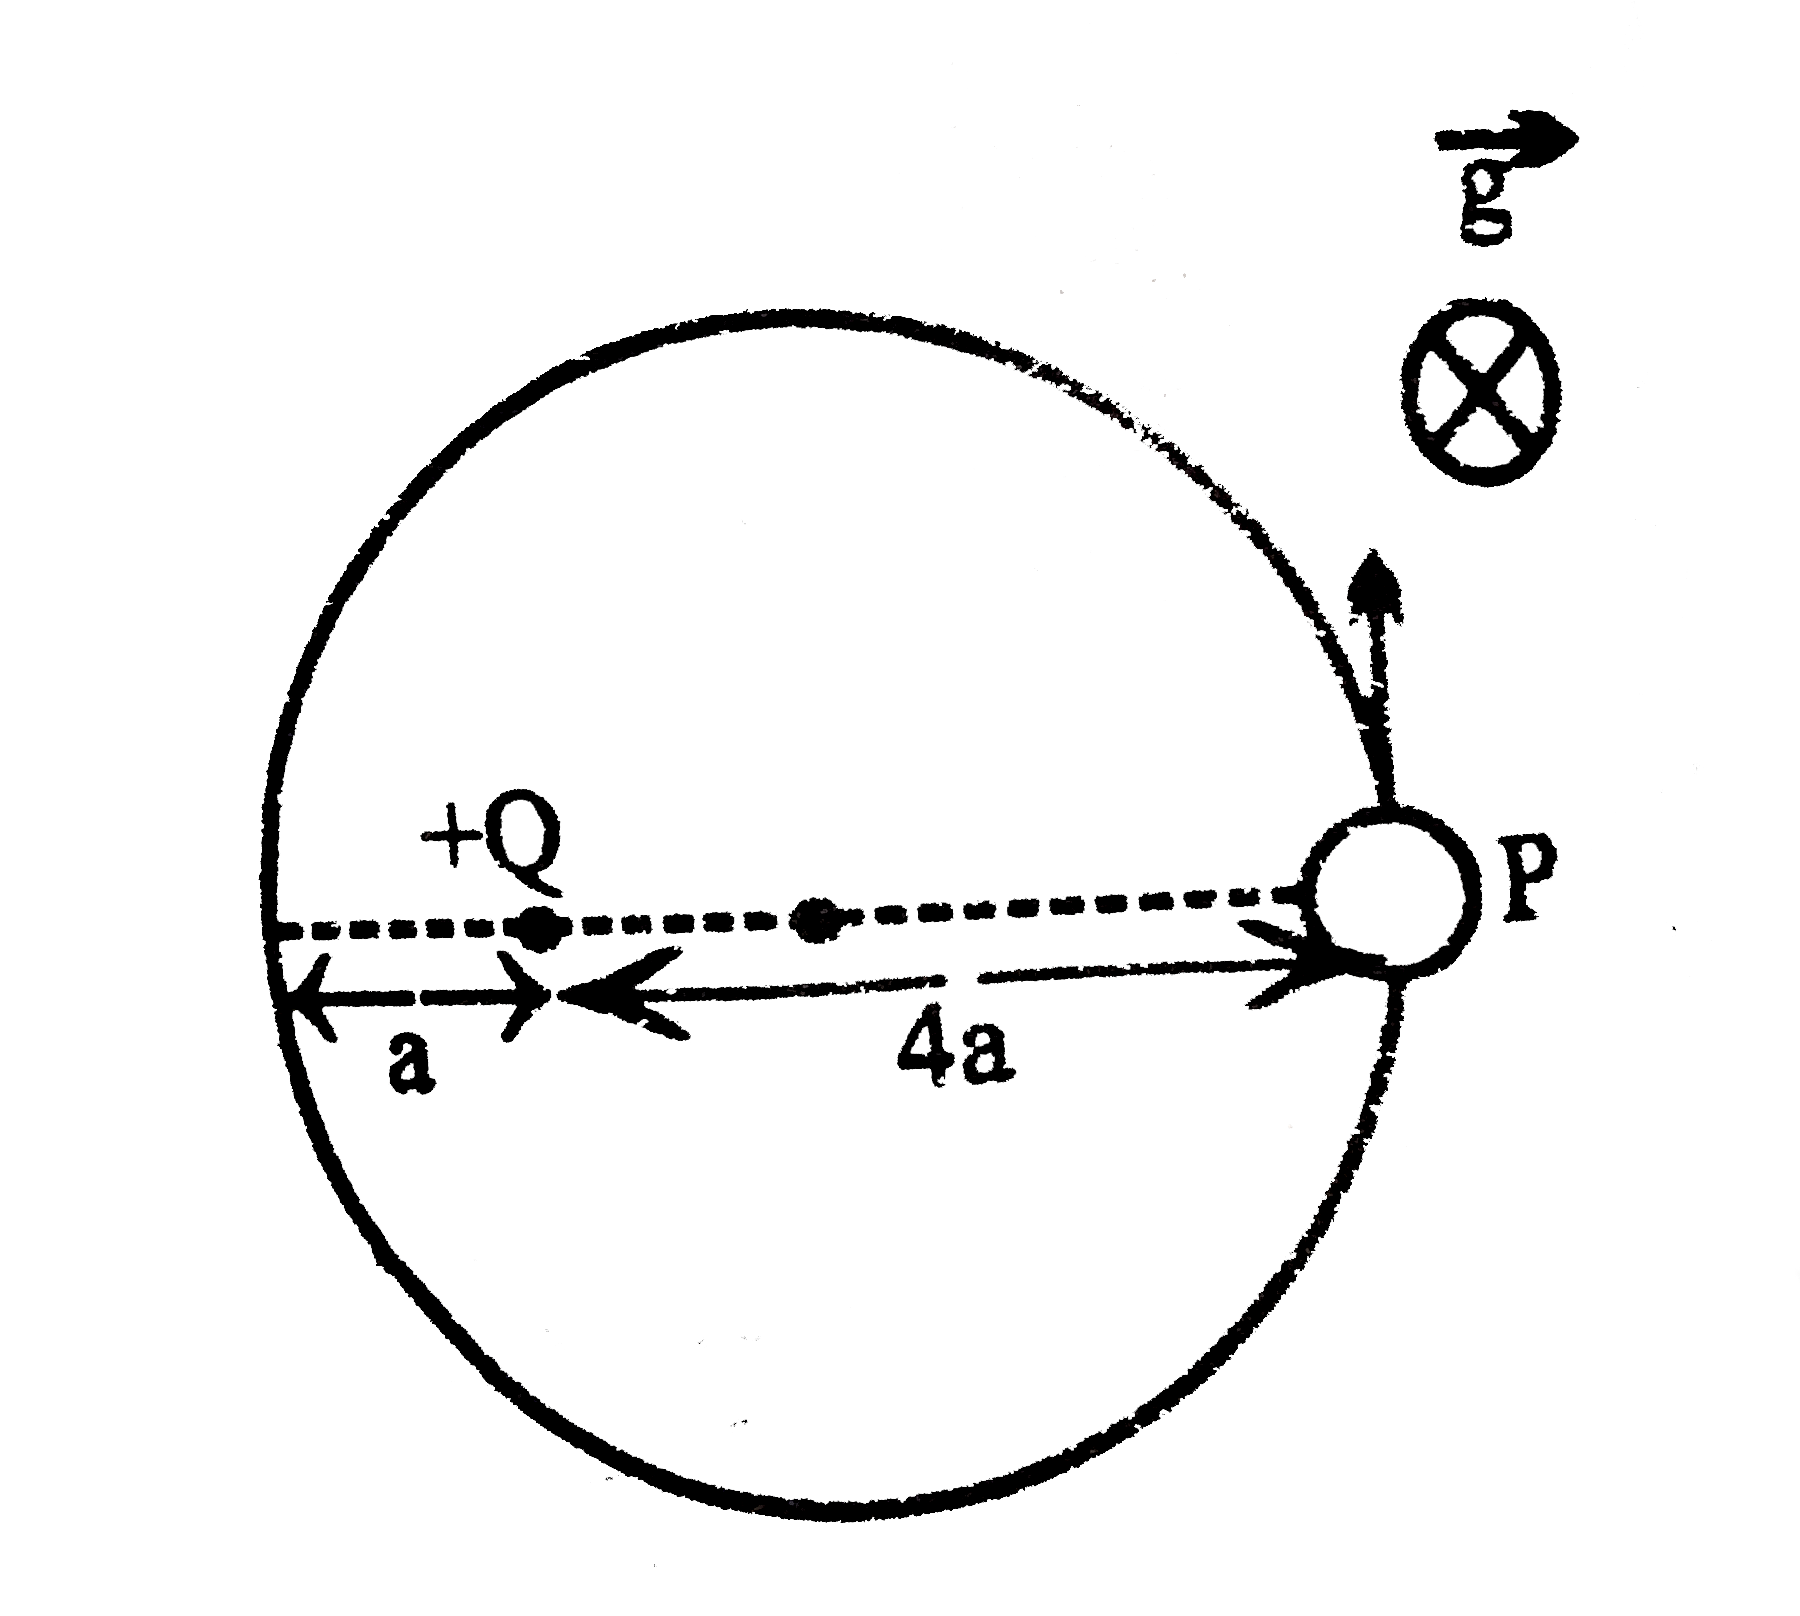
View SolutionThe diagram show a small bead of mass m carrying charge q. The bead can freely move on the smooth fixed ring placed on a smooth borizontal plane . In the same pane a charge +Q has also been fixed as shown. The potential at the point P due to +Q is V . The velocity which the bead should projected from the point P so that it can complete a circle should be greater than .
View SolutionWhich graph(s) show(s) the correct distribution of potential (at the points between them) due to two like point charges. [X= distance from the charge on left]
View Solution
