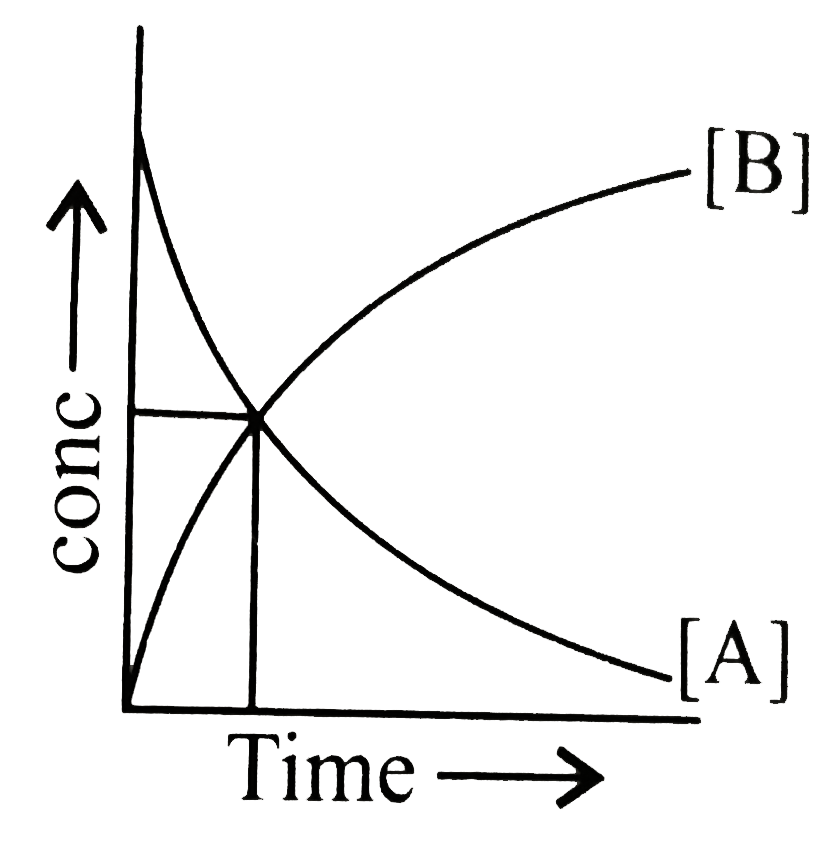
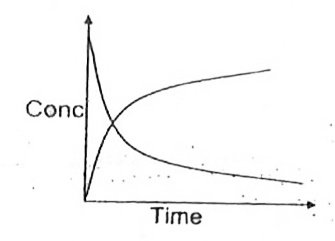
The accompanying figure depicts a change in concentration of species A and B for the reaction A→B, as a function of time. The point of inter section of the two curves represents
T1/2
T3/4
T2/3
data insufficient to predict
The correct Answer is:A
Step by step video, text & image solution for The accompanying figure depicts a change in concentration of species A and B for the reaction ArarrB, as a function of time. The point of inter section of the two curves represents by Chemistry experts to help you in doubts & scoring excellent marks in Class 12 exams.
Updated on:21/07/2023Topper's Solved these Questions
- CHEMICAL KINETICSBOOK - OP TANDONCHAPTER - CHEMICAL KINETICSEXERCISE - OBJECTIVE QUESTIONS (LEVEL-B) SET I
48 Videos
- CHEMICAL KINETICSBOOK - OP TANDONCHAPTER - CHEMICAL KINETICSEXERCISE - OBJECTIVE QUESTIONS (LEVEL-B) SET II
13 Videos
- CHEMICAL KINETICSBOOK - OP TANDONCHAPTER - CHEMICAL KINETICSEXERCISE - PRACTICE PROBLEMS
70 Videos
- CARBOXYLIC ACIDS AND THEIR DERIVATIVESBOOK - OP TANDONCHAPTER - CARBOXYLIC ACIDS AND THEIR DERIVATIVESEXERCISE - Integer
4 Videos
- Chemical Thermodynamics and ThermochemistryBOOK - OP TANDONCHAPTER - Chemical Thermodynamics and ThermochemistryEXERCISE - Self Assessment (Integer type).
3 Videos
Similar Questions
An irreversible reaction A+B→P is studied under conditions where initial concentrations of A and B are equal.Under these circumstances a graph of In A as a function of time is linear.What is the order of the reaction with respect to A with given data?
View SolutionAt the point of intersection of the two curves shown for the reaction
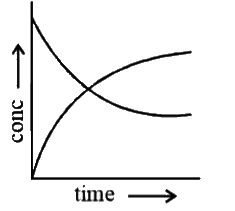
A→nB time →
then concentration of B is given by :
View Solution
Knowledge Check
The accompanying figure depicts a change in concentration of species A and B for the reaction A→B, as a function of time. The point of inter section of the two curves represents
 At1/2Bt3/4Ct2/3DData insufficient to predict
The accompanying figure depicts a change in concentration of species A and B for the reaction A→B, as a function of time. The point of inter section of the two curves represents
 At1/2Bt3/4Ct2/3DData insufficient to predict
The figure shows the change in concentration of species A and B as a function of time.
The equilibrium constant Kcfor the reactionA(g)⇔2B(g) is :
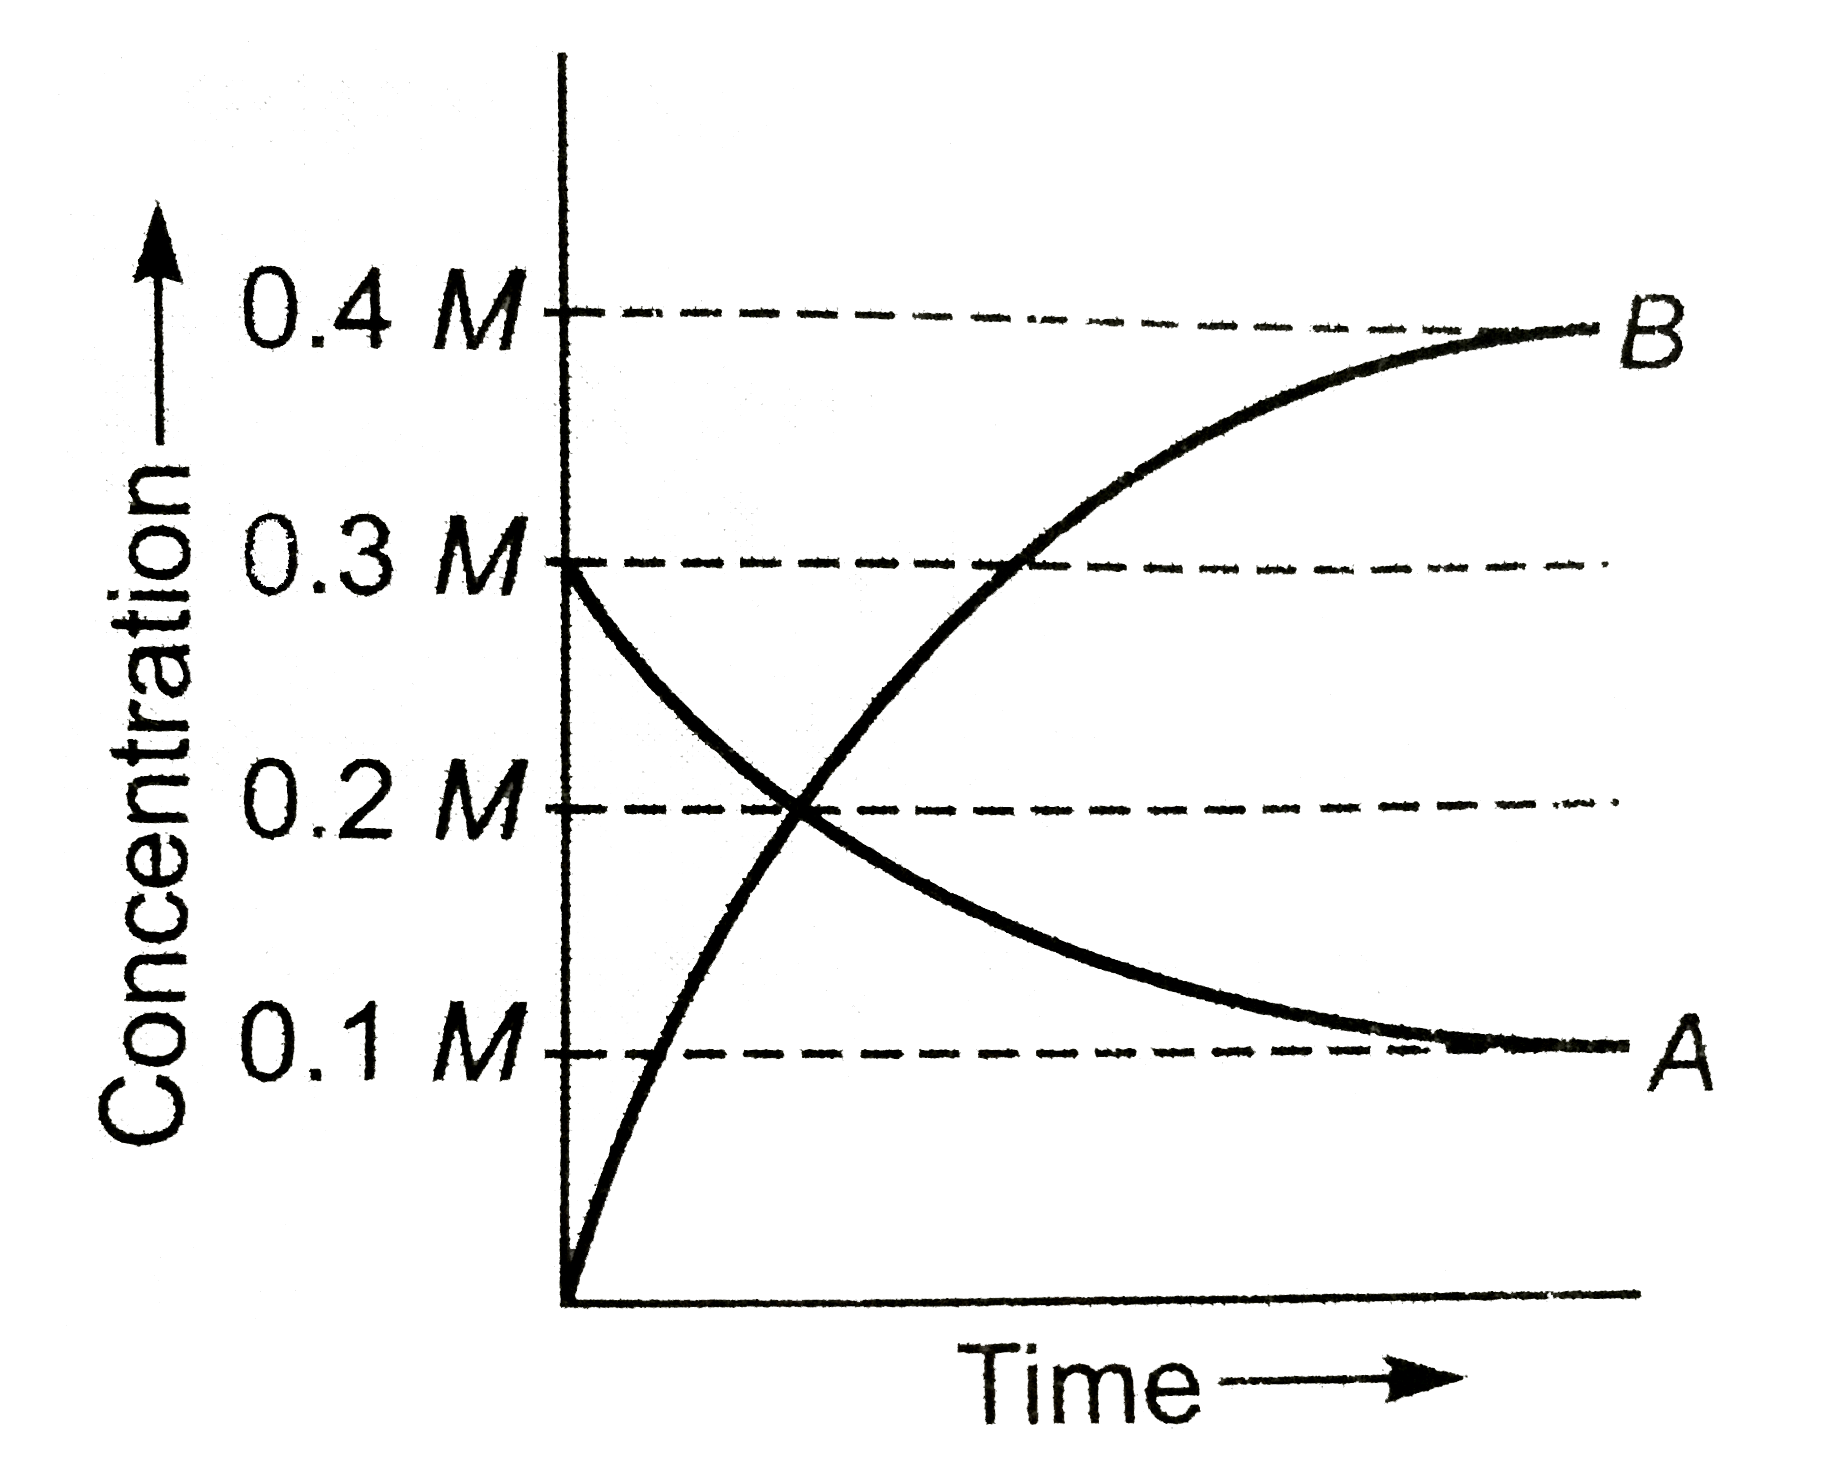 AKc>1BK<1CK=1Ddata insufficient
The slope of the tangent at a point on the curve of concentration of a reactant as a function of time gives the instantaneous rate of reaction.
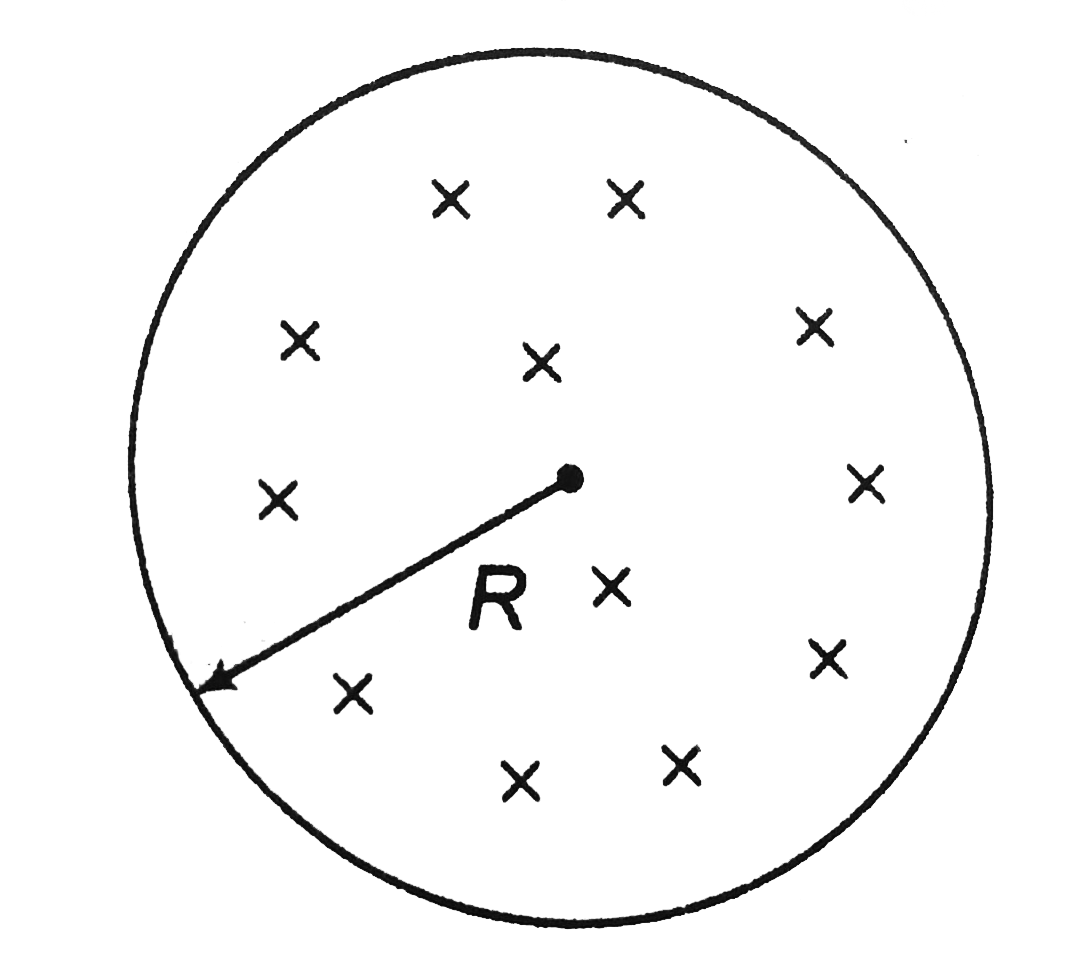
View SolutionThe magnetic field at all points within the cyllindrical region whose cross section is indicated in the accompanying Figure starts increasing at a constant rate α. T/s. find the magnitud of electric field as a function of r, the distance from the geometric centre of the region.
View SolutionAt the given point of intersection of the two curves shown concentration of B is given by ………for, A=3B
View SolutionConsider a reaction 2A+B→ Products. When the concentration of B alone was doubled, the half life did not change. When concentration of A alone was doubled, the rate increased by two times. The unit of rate constant for the reaction is:
View SolutionConsider a reaction, 2A+B→ Products
When concentration of B alone was doubled, the half-life did not change. When the concentration of A alone was doubled, the rate incresed by two times. The unit of rate constant for this reaction is :
View Solution
