For the redox process
Zn(s)+Cu2+⇔Zn2++Cu(s)E∘cell=+1.10V
which graph correctly represents Ecell (Y-axis) as a function of log [Zn2+][Cu2+] (X-axis) ?
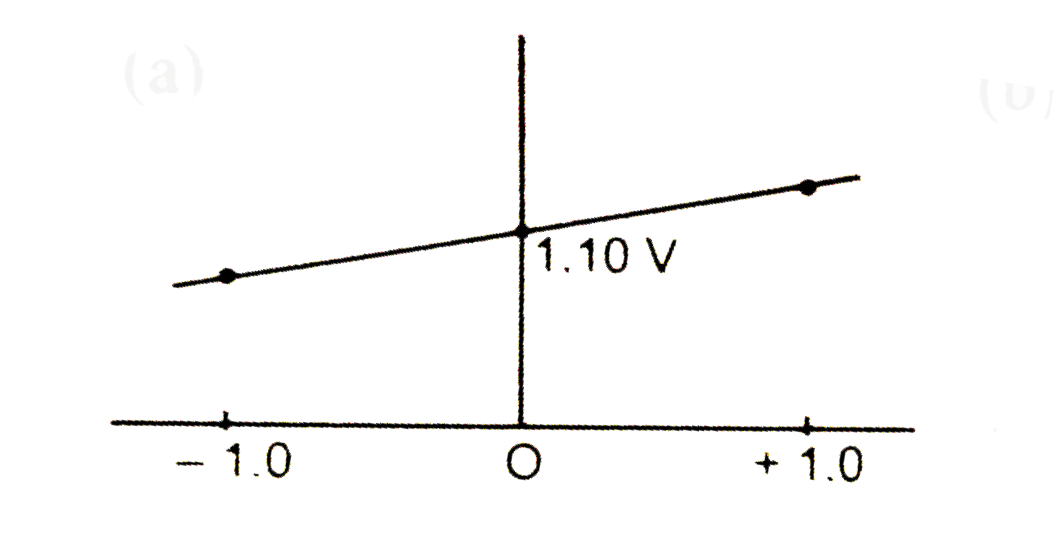
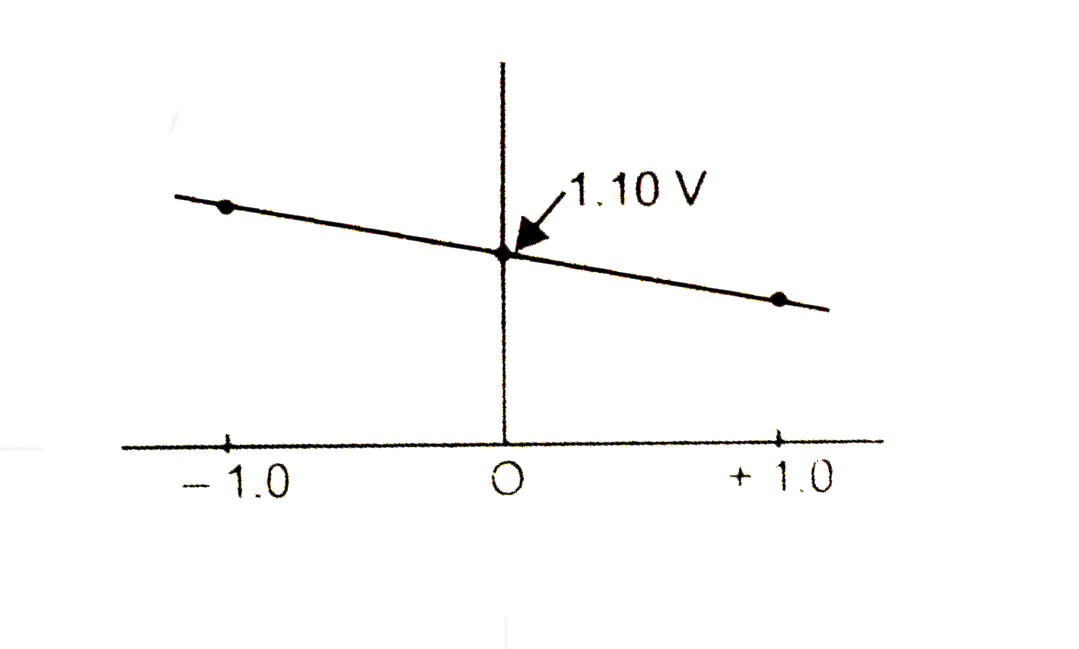
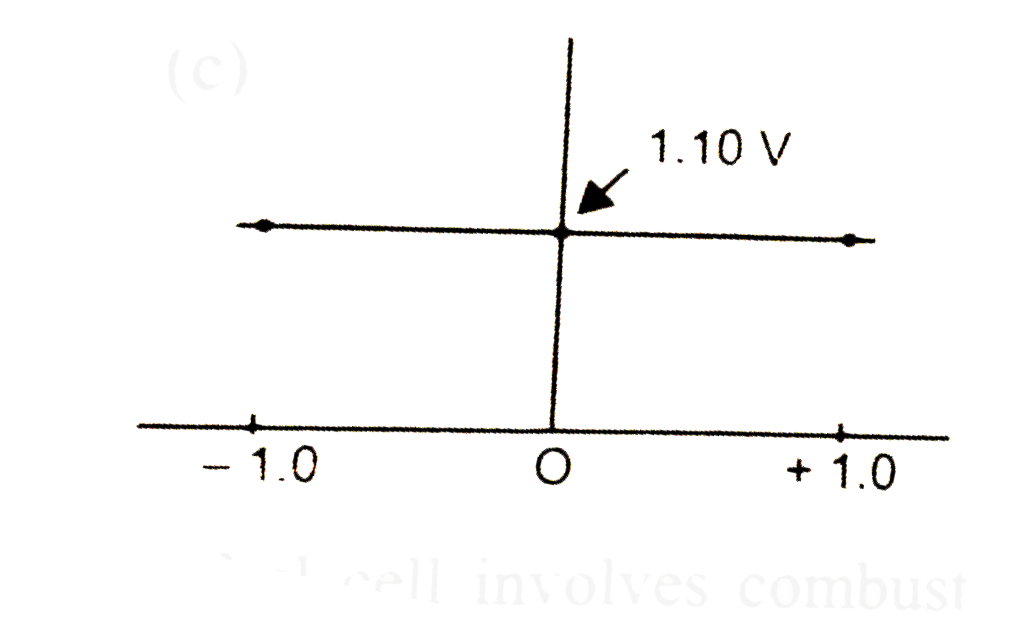
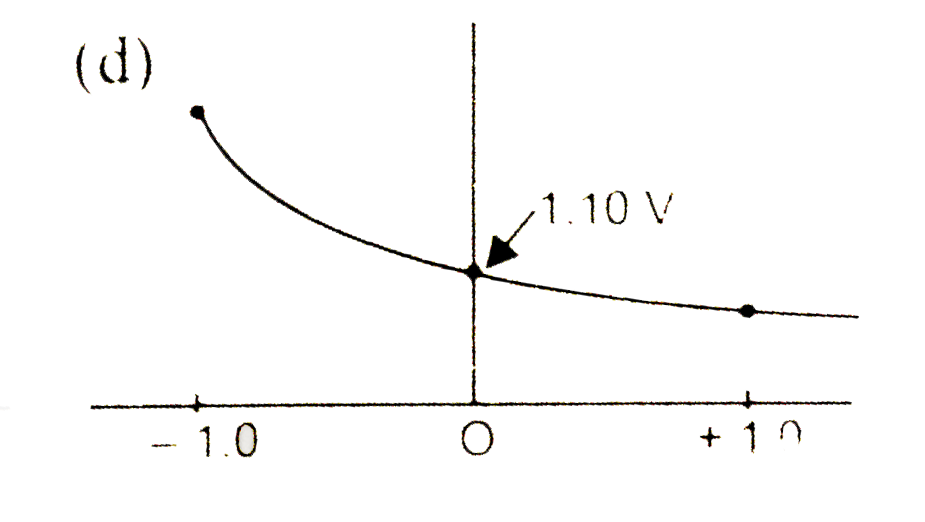
The correct Answer is:B
Step by step video, text & image solution for For the redox process Zn (s) + Cu^(2+) hArr Zn^(2+) + Cu(s) E_("cell")^(@) = + 1.10V which graph correctly represents E_("cell") (Y-axis) as a function of log ([Zn^(2+)])/([Cu^(2+)]) (X-axis) ? by Chemistry experts to help you in doubts & scoring excellent marks in Class 12 exams.
Updated on:21/07/2023Topper's Solved these Questions
- ELECTROCHEMISTRYBOOK - OP TANDONCHAPTER - ELECTROCHEMISTRYEXERCISE - One or more than correct answer
19 Videos
- ELECTROCHEMISTRYBOOK - OP TANDONCHAPTER - ELECTROCHEMISTRYEXERCISE - Assertion- Reason
27 Videos
- ELECTROCHEMISTRYBOOK - OP TANDONCHAPTER - ELECTROCHEMISTRYEXERCISE - OBJECTIVE TYPE QUESTION (LEVEL -A)
194 Videos
- COORDINATION COMPOUNDSBOOK - OP TANDONCHAPTER - COORDINATION COMPOUNDSEXERCISE - SBJECTIVE TYPE
96 Videos
- HALOALKANES AND HALOARENES BOOK - OP TANDONCHAPTER - HALOALKANES AND HALOARENES EXERCISE - Single Interger answer type questions
14 Videos
Similar Questions
The cell , Zn∣∣Zn2+(1M)∣∣∣Cu2+(1M)Cu(E∘cell=1.10V),
Was allowed to be completely discharfed at 298K. The relative concentration of 2+ to Cu2+[Zn2=Cu2+] is :
View SolutionFor the redox reaction Zn(s)+Cu2+(0.1M)→Zn2+(1M)+Cu(s) that takes place in a cell, Eocell is 1.10 volt. Ecell for the cell will be:
View Solution
Knowledge Check
Which graph correctly correlates Ecell as a funcation of concentrations for the cell (for different values of M and M')?
Zn(s)+Cu2+(M)→Zn2+(M')+Cu(s),E∘cell=1.10V
X-axis : log10[Zn2+][Cu2+] Y-axis : EcellA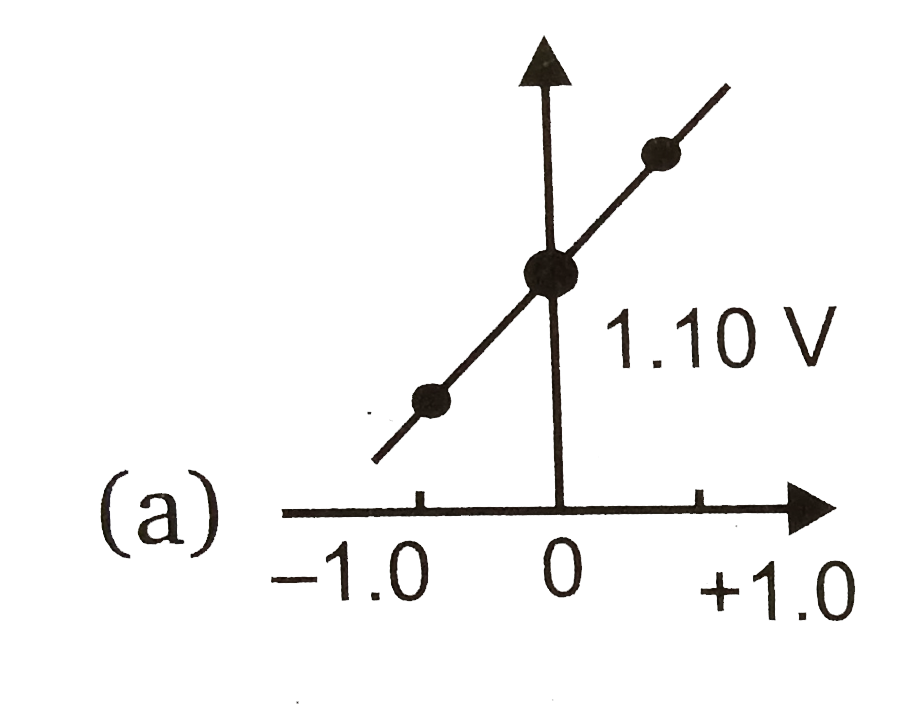 B
B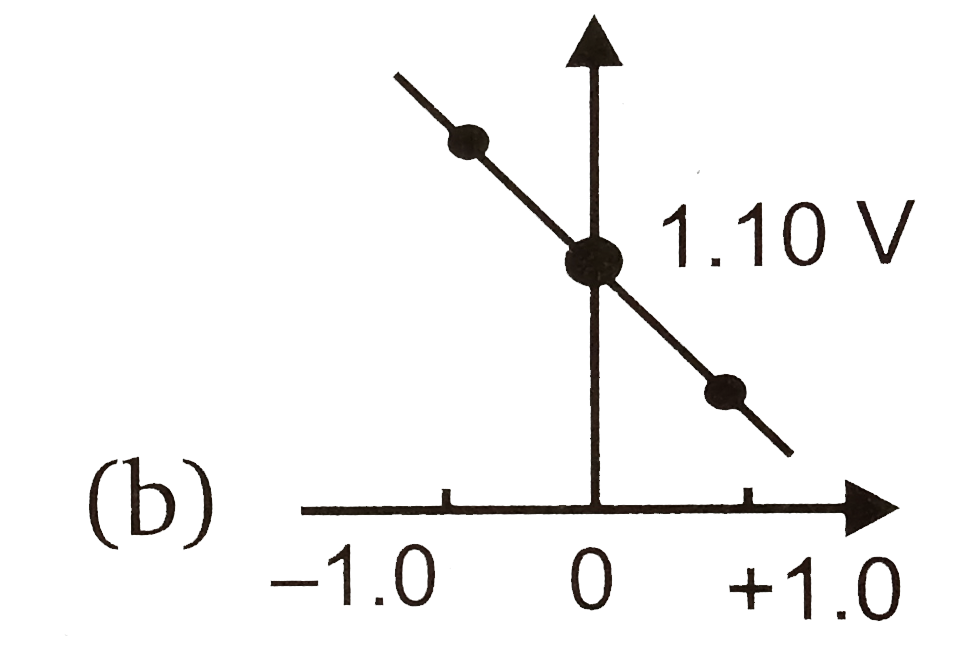 C
C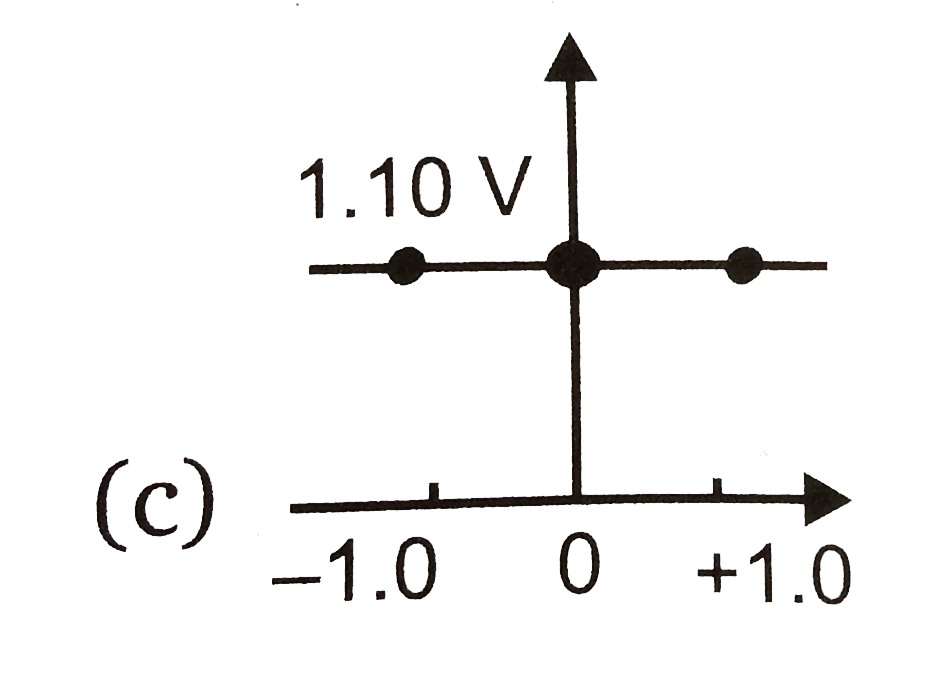 D
D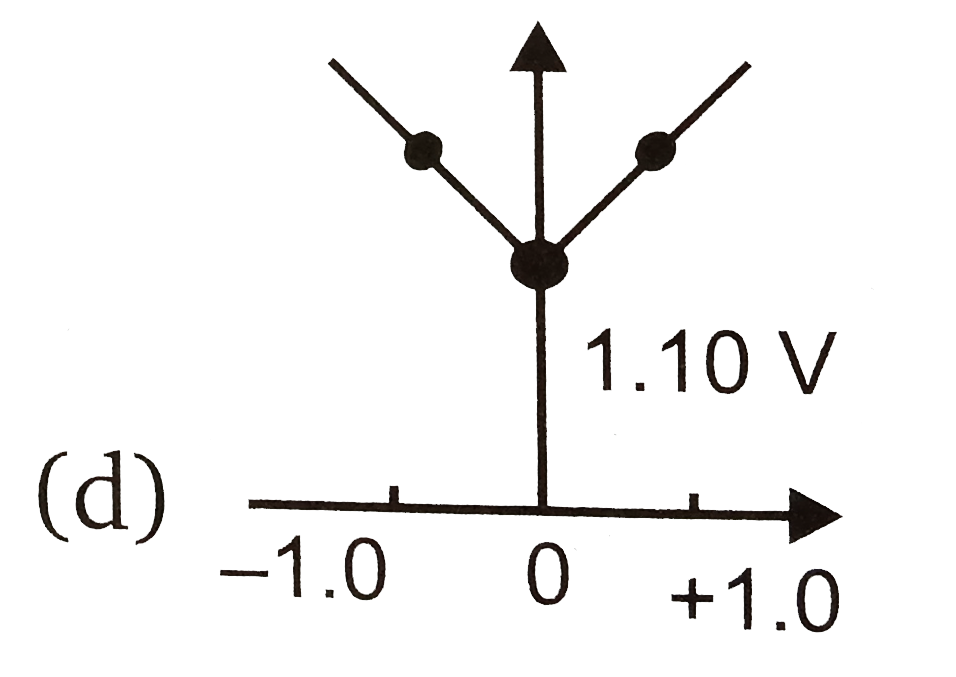
The cell reaction Zn(s)+Cu+2→Zn+2+Cu(s) is best represented as :
ACu∣∣Cu+2∣∣∣∣Zn+2∣∣ZnBZn∣∣Zn+2∣∣∣∣Cu+2∣∣CuCCu+2|Cu||Zn|Zn+2DPt∣∣Zn+2∣∣|Pt|Cu+2The cell Zn∣∣Zn2+(1M)∣∣∣∣Cu2+(1M)∣∣Cu
E∘cell=1.10V was allowed to be copletely discharged at 298 K The relative concentration of Zn2+Cu2+ isAantilog(24.08)B37.2C1037.2D9.65×104
Thecell, Zn∣∣Zn2+(1M)∣∣∣∣Cu2+(1M)∣∣Cu(E∘cell=1.10V) was allowed to be completely discharged at 298 K. The relative concentration of Zn2+ to Cu2+([Zn2+][Cu2+]) is
View SolutionThe cell, Zn∣∣Zn2+(1M)∣∣|(1M)|Cu(E∘cell=1.10V), was was allowed to be completely discharged at 298 K. The concentration of Zn2+ →CU2+([(Zn2+[Cu2+]]) is :
View SolutionThe cell Zn∣∣Zn2+(1M)∣∣∣∣Cu2+(1M)∣∣Cu(E∘_(cell)=1.10V) was allowed to be completely discharged at 298 K. The relative concentration of Zn2+ to Cu2+([Zn2+][Cu2+]) is :
View SolutionConsider the following reaction,
Zn(s)+Cu2+(0.1M)→Zn2+(1M)+Cu(s) above reaction, taking place in a cell, E∘cell is 1.10V.Ecell for the cell will be (2.303RTF=0.0591)
View SolutionWhich graph correctly correlates Ecell as a function of concentration for the cell (for different values of M nad M' Zn(s)+Cu2+(M)→Zn2+(M')+Cu(s),E∘cell=1.10V
X - axis : log10.[Zn2+][Cu2+], Y - axis : Ecell
View Solution
