The graph representing the variation of induced magnetic field in the gap of the condenser plates during its charging with the distance from the axis of the gap is
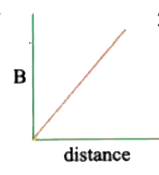
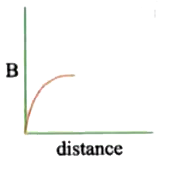
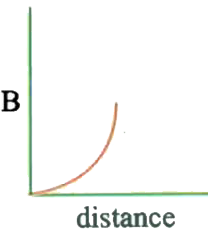
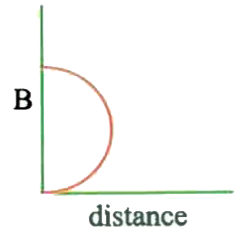
The correct Answer is:A
B = μ0i2πrandI=r2i0R2
Topper's Solved these Questions
- ELECTROMAGNETIC WAVES BOOK - NARAYNACHAPTER - ELECTROMAGNETIC WAVES EXERCISE - EXERCISE -2(C.W)
20 Videos
- ELECTROMAGNETIC WAVES BOOK - NARAYNACHAPTER - ELECTROMAGNETIC WAVES EXERCISE - EXERCISE -2 ( H.W) DISPLACEMENT CURRENT
14 Videos
- ELECTROMAGNETIC WAVES BOOK - NARAYNACHAPTER - ELECTROMAGNETIC WAVES EXERCISE - EXERCISE -1(C.W)
32 Videos
- ELECTROMAGNETIC INDUCTIONBOOK - NARAYNACHAPTER - ELECTROMAGNETIC INDUCTIONEXERCISE - ASSERTION & REASON
6 Videos
- ELECTROSTATIC POTENTIAL AND CAPACITANCEBOOK - NARAYNACHAPTER - ELECTROSTATIC POTENTIAL AND CAPACITANCEEXERCISE - ADDITIONAL PROBLEMS
14 Videos
Similar Questions
Graphically represent the variation of electric potential and electric field due to point charge with respect to the distance from the point charge.
View SolutionThe graph showing the variation of the magnetic field strength (B) with distance (r) from a long current carrying conductor is.

View Solution
Knowledge Check
Which of the following graph represents the variation of electric field E due to a thin charged spherical shell of radius R as a function of the distance r from the centre of the shell?
A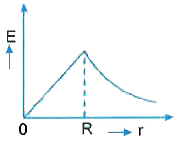 B
B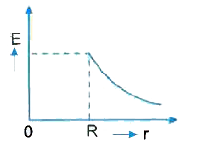 CD
CD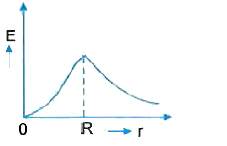
The magnetic field due to a short magnet at a point in its axis at distance X cm from the middle of the magnet is
A100 GaussB400 GaussC50 GaussD200 GaussHow does the electric field (E) between the plates of a charged cylindrical capacitor vary with the distance r from the axis of the cylinder ?
AE∝1r2BE∝1rCE∝r2DE∝r
A thick current carrying cable of radius 'R' carries current 'I' uniformly distributed across its crosssection. The variation of magnetic field B(r) due to cable with distance 'r' from the axis of the cable is represented by.
View SolutionFind the magnetic field induction at a point on the axis of a circular coil carrying current and hence find the magnetic field at the centre of circular coil carrying current.
View SolutionVariation of magnetic field with distance from current carrying conductor is:
View SolutionThe variation of magnetic field (B) due to circular coil as the distance X varies is shown in the graph. Which of the following is false
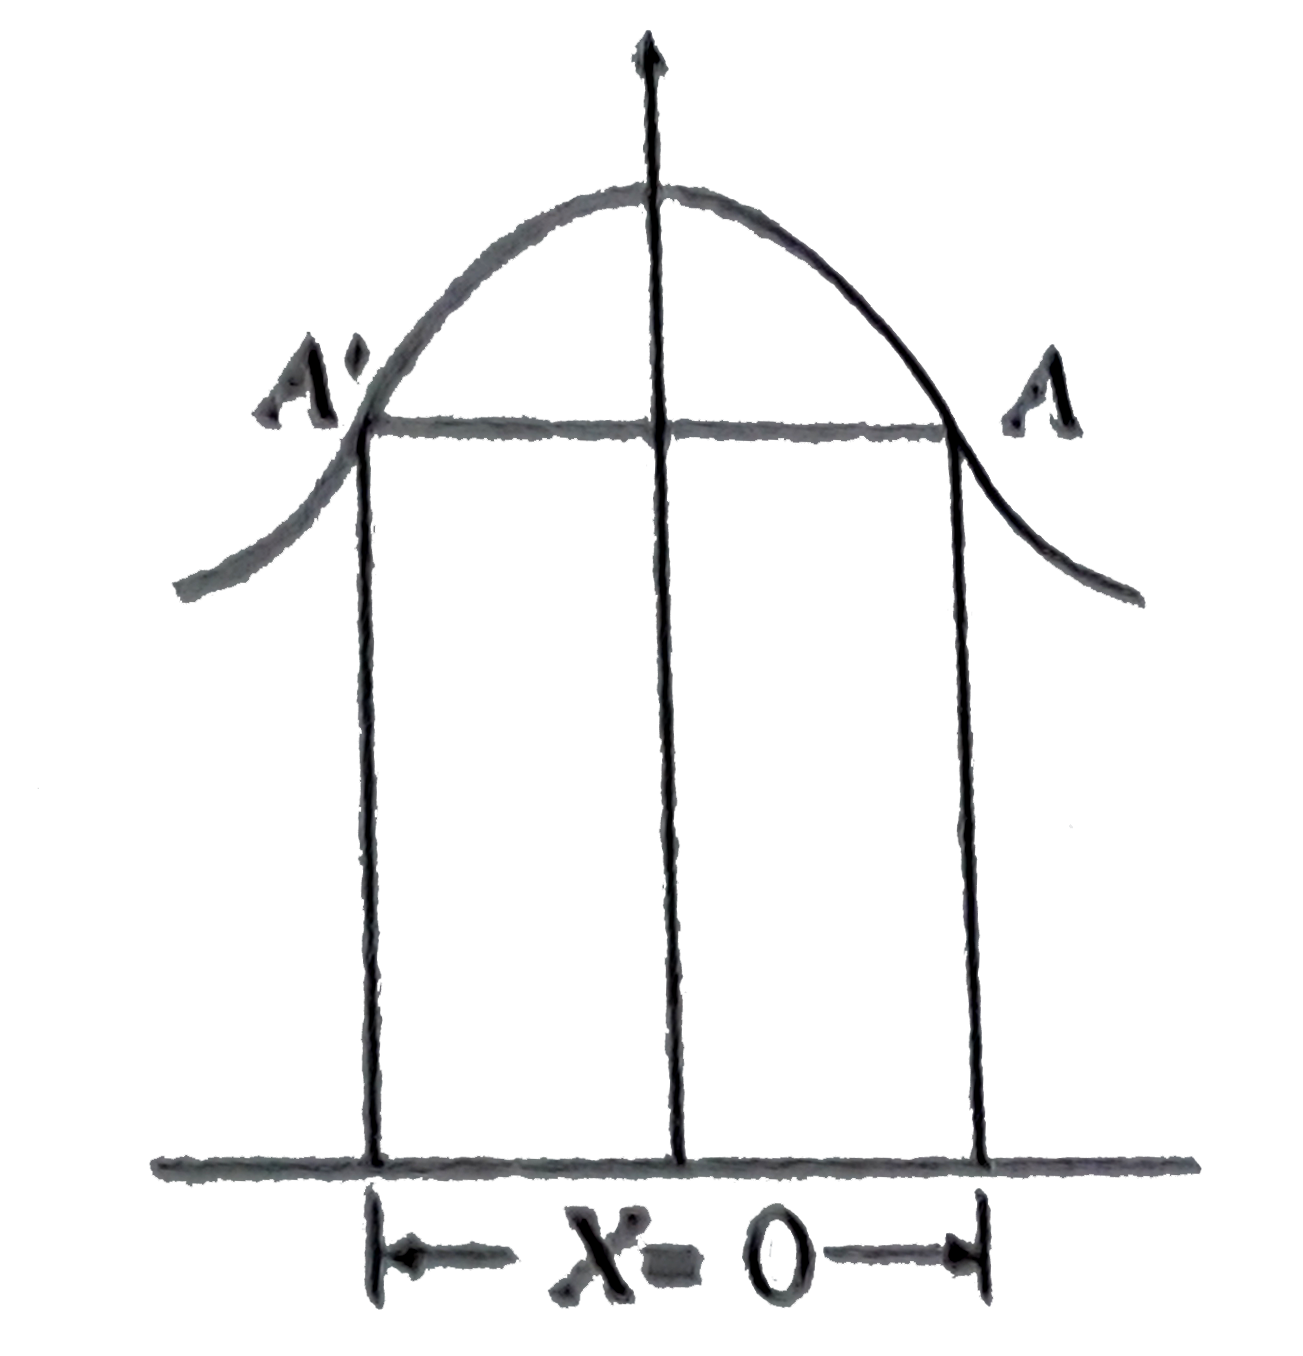
View SolutionAn isolated non-conducting solid sphere of radius R is given an electric charge. The charge is uniformly distributed in the volume of sphere. The graph which shows the correct variation of magnitude of electric field with distance from the centre of the sphere is
View Solution
