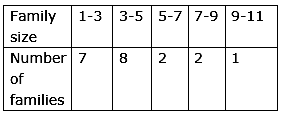
A survey was conducted by a group of students as a part of their environment awareness programme, in which they collected the following data regarding the number of plants in 20 houses in a locality. Find the mean number of plants per house.Which method did you use for finding the mean, and why?
To find the mean number of plants per house from the given data, we will follow these steps:
Step 1: Collect the Data
First, we need to collect the data regarding the number of plants in the 20 houses. Let's assume the data is as follows:
- House 1: 1 plant
- House 2: 3 plants
- House 3: 5 plants
- House 4: 7 plants
- House 5: 9 plants
- House 6: 11 plants
- House 7: 13 plants
- House 8: 2 plants
- House 9: 6 plants
- House 10: 4 plants
- House 11: 5 plants
- House 12: 3 plants
- House 13: 2 plants
- House 14: 3 plants
- House 15: 4 plants
- House 16: 3 plants
- House 17: 9 plants
- House 18: 5 plants
- House 19: 2 plants
- House 20: 8 plants
Step 2: Calculate the Total Frequency
The total number of houses surveyed is 20. This is our total frequency (N).
Step 3: Identify the Values
Next, we will identify the number of plants (X_i) for each house and their corresponding frequencies (f_i).
Step 4: Calculate the Product of f_i and X_i
Now, we will calculate the product of each frequency (f_i) and the corresponding number of plants (X_i):
- For 1 plant: 1 * 1 = 1
- For 2 plants: 2 * 3 = 6
- For 3 plants: 3 * 5 = 15
- For 4 plants: 4 * 7 = 28
- For 5 plants: 5 * 9 = 45
- For 6 plants: 6 * 11 = 66
- For 7 plants: 7 * 13 = 91
- For 8 plants: 8 * 2 = 16
- For 9 plants: 9 * 6 = 54
- For 10 plants: 10 * 4 = 40
- For 11 plants: 11 * 5 = 55
- For 12 plants: 12 * 3 = 36
- For 13 plants: 13 * 2 = 26
- For 14 plants: 14 * 3 = 42
- For 15 plants: 15 * 4 = 60
- For 16 plants: 16 * 3 = 48
- For 17 plants: 17 * 9 = 153
- For 18 plants: 18 * 5 = 90
- For 19 plants: 19 * 2 = 38
- For 20 plants: 20 * 8 = 160
Step 5: Sum of f_i * X_i
Now, we will sum all the products calculated in the previous step:
Sum = 1 + 6 + 15 + 28 + 45 + 66 + 91 + 16 + 54 + 40 + 55 + 36 + 26 + 42 + 60 + 48 + 153 + 90 + 38 + 160 = 162
Step 6: Calculate the Mean
Finally, we can calculate the mean using the formula:
Mean=∑(fi⋅Xi)N
Substituting the values we have:
Mean=16220=8.1
Conclusion
The mean number of plants per house is 8.1.
Method Used
We used the direct method for finding the mean because the frequencies and the corresponding intervals are not too large, making it feasible to calculate directly without needing to use the step deviation method.
First, we need to collect the data regarding the number of plants in the 20 houses. Let's assume the data is as follows:
- House 2: 3 plants
- House 3: 5 plants
- House 4: 7 plants
- House 5: 9 plants
- House 6: 11 plants
- House 7: 13 plants
- House 8: 2 plants
- House 9: 6 plants
- House 10: 4 plants
- House 11: 5 plants
- House 12: 3 plants
- House 13: 2 plants
- House 14: 3 plants
- House 15: 4 plants
- House 16: 3 plants
- House 17: 9 plants
- House 18: 5 plants
- House 19: 2 plants
- House 20: 8 plants
The total number of houses surveyed is 20. This is our total frequency (N).
Next, we will identify the number of plants (X_i) for each house and their corresponding frequencies (f_i).
Now, we will calculate the product of each frequency (f_i) and the corresponding number of plants (X_i):
- For 2 plants: 2 * 3 = 6
- For 3 plants: 3 * 5 = 15
- For 4 plants: 4 * 7 = 28
- For 5 plants: 5 * 9 = 45
- For 6 plants: 6 * 11 = 66
- For 7 plants: 7 * 13 = 91
- For 8 plants: 8 * 2 = 16
- For 9 plants: 9 * 6 = 54
- For 10 plants: 10 * 4 = 40
- For 11 plants: 11 * 5 = 55
- For 12 plants: 12 * 3 = 36
- For 13 plants: 13 * 2 = 26
- For 14 plants: 14 * 3 = 42
- For 15 plants: 15 * 4 = 60
- For 16 plants: 16 * 3 = 48
- For 17 plants: 17 * 9 = 153
- For 18 plants: 18 * 5 = 90
- For 19 plants: 19 * 2 = 38
- For 20 plants: 20 * 8 = 160
Now, we will sum all the products calculated in the previous step:
Finally, we can calculate the mean using the formula:
The mean number of plants per house is 8.1.
We used the direct method for finding the mean because the frequencies and the corresponding intervals are not too large, making it feasible to calculate directly without needing to use the step deviation method.
Similar Questions
A survery was conducted by a group of student as a part of their envionment awareness programme, in which they collected the following data regarding the number of plants in 20 houses in a locality. Find the mean number of plants per house.

Which methode did you use for finding the mean, and why ?
View SolutionA survey was conducted by a group of students as a part of their environment awareness programme, in which they collected the following data regarding the number of plants in 20 houses in a locality. Find the mean number of plants per house. Number of plants: 0-2 2-4 4-6 6-8 8-10 10-12 12-14 Number of houses: 1 2 1 5 6 2 3 Which method did you use for finding the mean, and why?
View Solution
Knowledge Check
A survey conducted on 20 households in a locality by a group of students resulted in the following frequency table for the number of family members in a household:Find the mode of this data.
 A4B3.8C3.286DNone
As part of the 'Swachh Bharat Abhyan', some houses of a locality in Agra decided to clean up and beautify a Primary School of their locality by planting a number of plants. They involved the school kids and the local community in doing so.

Here is the data indicating the number of plants contributed by different houses:

If the mean number of plants contributed be 8.9, then how many houses contributed 7 to 9 plants?A6 housesB7 housesC8 housesD9 houses
The cost of living index and the number of weeks are given in the following table. Find the mean cost of living index :

Use step deviation method .
View SolutionThe following table shows the number of students and the time they utilized daily for their studies. Find the mean time spent by students for their studies by direct method.

View SolutionThe following table shows the number of students and the time they utilized daily for their studies. Find the mean time spent by students for their studies by direct method.

View SolutionIn a retail market, fruit vendors were selling mangoes kept in packing boxes. These boxes contained varying number of mangoes. The following was the distribution of mangoes according to the number of boxes.Find the mean number of mangoes kept in a packing box. Which method of finding the mean did you choose?
View SolutionThe following table shows the number of students and the time they utilized dialy for th eir studeis.Find the mean time spent by students for their studeies by direct method

View SolutionIn a retail market, fruit vendors were selling mangoes kept in packing boxes. These boxes contained varying number of mangoes. The following was the distribution of mangoes according to the number of boxes. No. of mangoes: 50-52 53-55 56-58 59-61 62-64 No. of boxes: 15 110 135 115 25 Find the mean number of mangoes kept in a packing box. Which method of finding the mean did you choose?
View Solution
