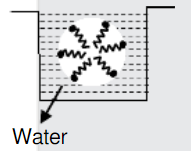
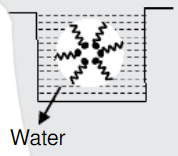
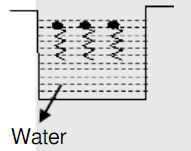
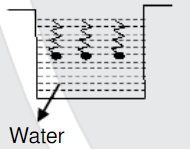
Above CMC correct diagram for micelle formation is

A

B

C

D

Video Solution
Text Solution
The correct Answer is:A
|
Answer
Step by step video, text & image solution for Above CMC correct diagram for micelle formation is by Chemistry experts to help you in doubts & scoring excellent marks in Class 12 exams.
Updated on:21/07/2023
Knowledge Check
- Question 1 - Select One
During micelle formation :
AΔH=+ve,ΔS=+veBΔH=−ve,ΔS=−veCΔH=−ve,ΔS=+veDΔH=+ve,ΔS=−ve - Question 1 - Select One
Micelle formation occurs in:
AEnterocyteBDuodenumCLactealsDPancreas - Question 1 - Select One
Micelles formation takes place
Abelow kraft temperatureBabove kraft temperatureCbelow critical micells concentrationDhave no relation with kraft temperature - Question 1 - Select One
Micelle formation occurs in :−
AEnterocyteBDuodenumCLuctealsDPancrease - Question 1 - Select One
Molar conductivity (A) of aqueous solution of sodium stearate, which behaves as a strong electrolyte, is recorded at varying concentrations (C) of sodium stearate. Which one of the following plots provides the correct representation of micelle formation in the solution? (Critical micelle concentration (CMC) is marked with an arrow in the figures)
A B
B C
C D
D
- Question 1 - Select One
Molar conductivity (A) of aqueous solution of sodium stearate, which behaves as a strong electrolyte, is recorded at varying concentrations (C) of sodium stearate. Which one of the following plots provides the correct representation of micelle formation in the solution? (Critical micelle concentration (CMC) is marked with an arrow in the figures)
A B
B C
C D
D
- Question 1 - Select One
Molar conductivity (A) of aqueous solution of sodium stearate, which behaves as a strong electrolyte, is recorded at varying concentrations (C) of sodium stearate. Which one of the following plots provides the correct representation of micelle formation in the solution? (Critical micelle concentration (CMC) is marked with an arrow in the figures)
A B
B C
C D
D
- Question 1 - Select One
Molar conductivity (L) m of aqueous solution of sodium stearate, which behaves as a strong electrolyte, is recorded at varying concentrations (c) of sodium stearate. Which one of the following plots provides the correct representation of micelle formation in the solution?
(Critical micelle concentration (CMC) is marked with an arrow in the figures)A B
B C
C D
D

