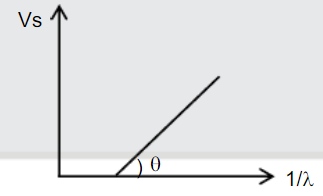
A light is incidence on a metallic surface. Graph etween stopping potential Vs and 1λ is as shown in figure. when intensity of ligh is increases at given frequency then:

Graph does not change
Graph steeper
Vs intercept change
Graph gets narrower
The correct Answer is:A
Step by step video, text & image solution for A light is incidence on a metallic surface. Graph etween stopping potential V_s and 1/lambda is as shown in figure. when intensity of ligh is increases at given frequency then: by Physics experts to help you in doubts & scoring excellent marks in Class 12 exams.
Updated on:21/07/2023Topper's Solved these Questions
Similar Questions
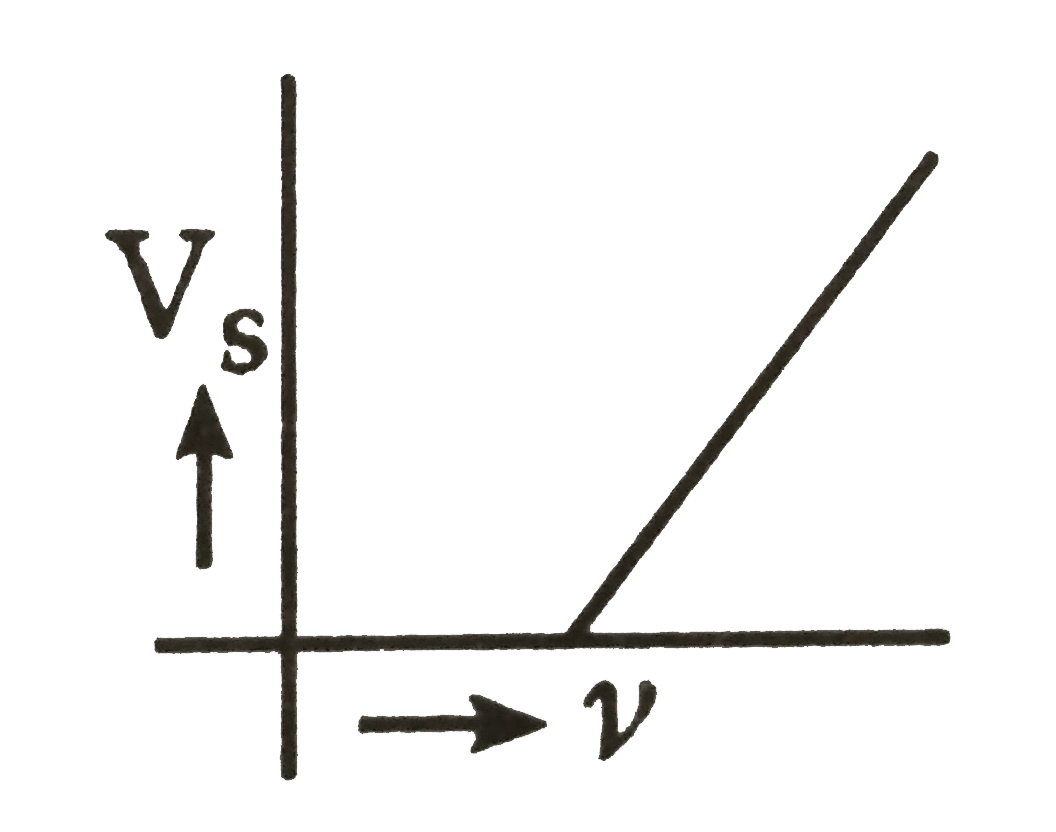
In photoelectric effect the slope of straight line graph between stopping potential (Vs) and frequency of incident light (v) gives

View SolutionWhen light of wavelength λ is incident on a metal surface, stopping potential is found to be x. When light of wavelength nλ is incident on the same metal surface, stopping potential is found to be xn+1 . Find the threshold wavelength of the metal.
View Solution
Knowledge Check
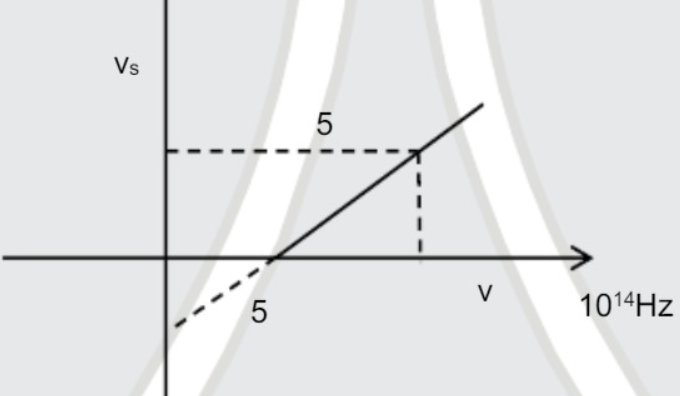
Graph between stopping potential and frequency of light as shown find the work function
 A4.01 evB2.07 evC5.01 evD2.09 ev
Graph between stopping potential and frequency of photon is given in figure
_2019_CBT7_E01_021_Q01.png)
Find out work function of metal:A0.82B0.92C0.72D0.62When light of wavelength λ is incident on a metal surface ,stopping potential is found to be V∘ . When light of wavelength nλ is in incident on the same metal surface ,stopping potential is found to be V∘n+1. The threshold wavelength of the metal is
An3λBλn2Cn2λD(n+2)λ
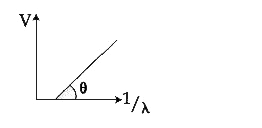
In a photoelectric effect experiment, the graph of stopping potential V versus reciprocal of wavelength obtained is shown in the figure. As the intensity of incident radiation is increased :

View SolutionWhen radiation of wavelength λ is incident on a metallic surface , the stopping potential is 4.8volts . If the same surface is illuminated with radiation of double the wavelength , then the stopping potential becomes 1.6volts. Then the threshold wavelength for the surface is
View SolutionThe correct curve between the stopping potential (V) and intensity of incident light (I) is
View SolutionWhen monochromatic light of wavelength λ is incident on a metallic surface the stopping potential for photoelectric current is 3V0 when same surface is illuminated with light of waelength 2λ the stopping potential is V0
The threshold wavelength for this surface when photoelectric effect takes place is
View Solution

