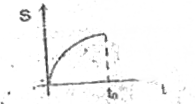
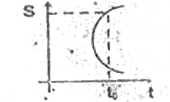
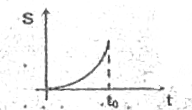
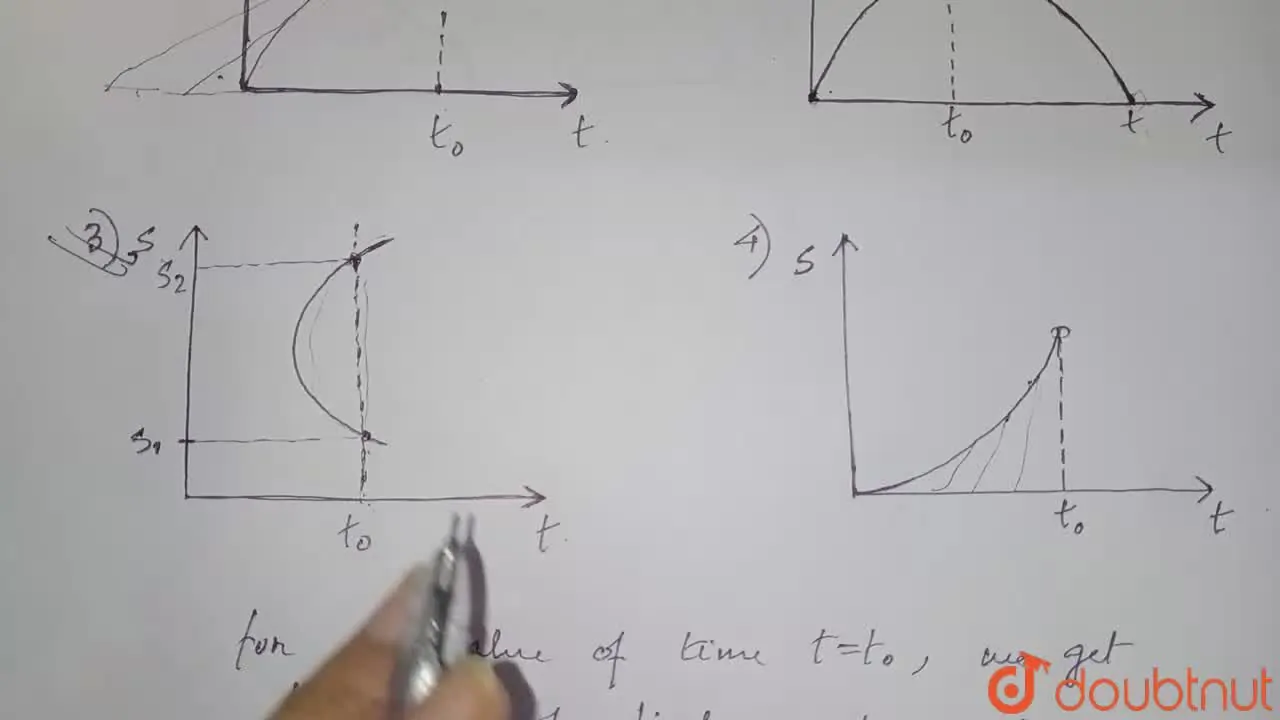
Which of the following graph is wrong?
A

B

C

D

Video Solution
Text Solution
At one time, two values of displacement are not possible..
|
Updated on:21/07/2023
Related Playlists
- BOOK - FIITJEECHAPTER - KINEMATICSEXERCISE - ASSIGNMENT PROBLEMS (SUBJECTIVE) LEVEL-I (Short Answer Type Questions)3videos
KINEMATICS
- BOOK - FIITJEECHAPTER - KINEMATICSEXERCISE - ASSIGNMENT PROBLEMS (SUBJECTIVE) LEVEL-I (Fill in the Blanks:)2videos
KINEMATICS
- BOOK - FIITJEECHAPTER - KINEMATICSEXERCISE - Comprehension4videos
KINEMATICS
- BOOK - FIITJEECHAPTER - HEAT AND TEMPERATUREEXERCISE - NUMERICAL BASES QUESTIONS1videos
HEAT AND TEMPERATURE
- BOOK - FIITJEECHAPTER - LAWS OF MOTIONEXERCISE - COMPREHENSION-III2videos
LAWS OF MOTION
Similar Questions
Which of the following match is wrong?
View SolutionWhich of the following order is wrong-
View SolutionWhich of the following pairs is wrong?
View SolutionWhich of the following pairs is wrong?
View Solutionwhich one of the following is wrong ?
View SolutionWhich of the following formulae is wrong?
View SolutionWhich one of the following is wrong?
View SolutionWhich one of the following is wrong
View SolutionWhich one of the following is wrong?
View SolutionWhich one of the following is wrong?
View Solution


