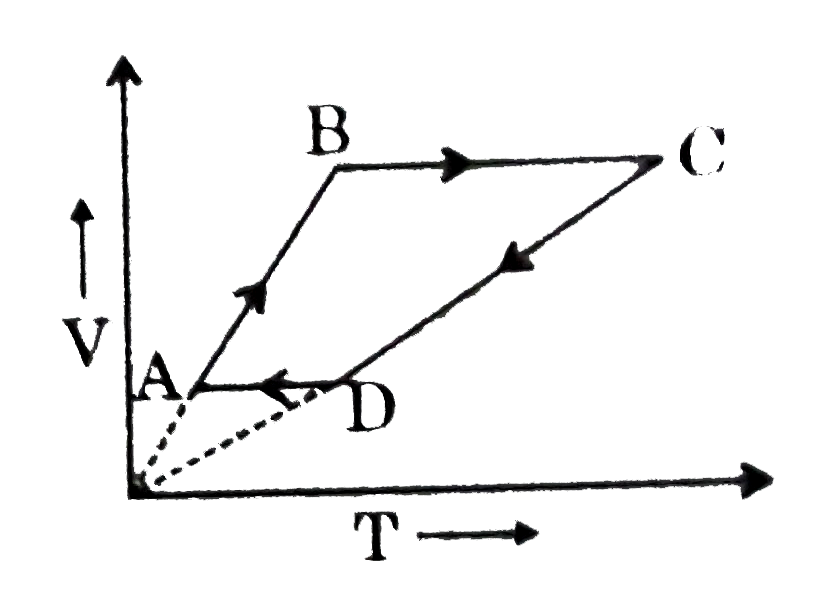
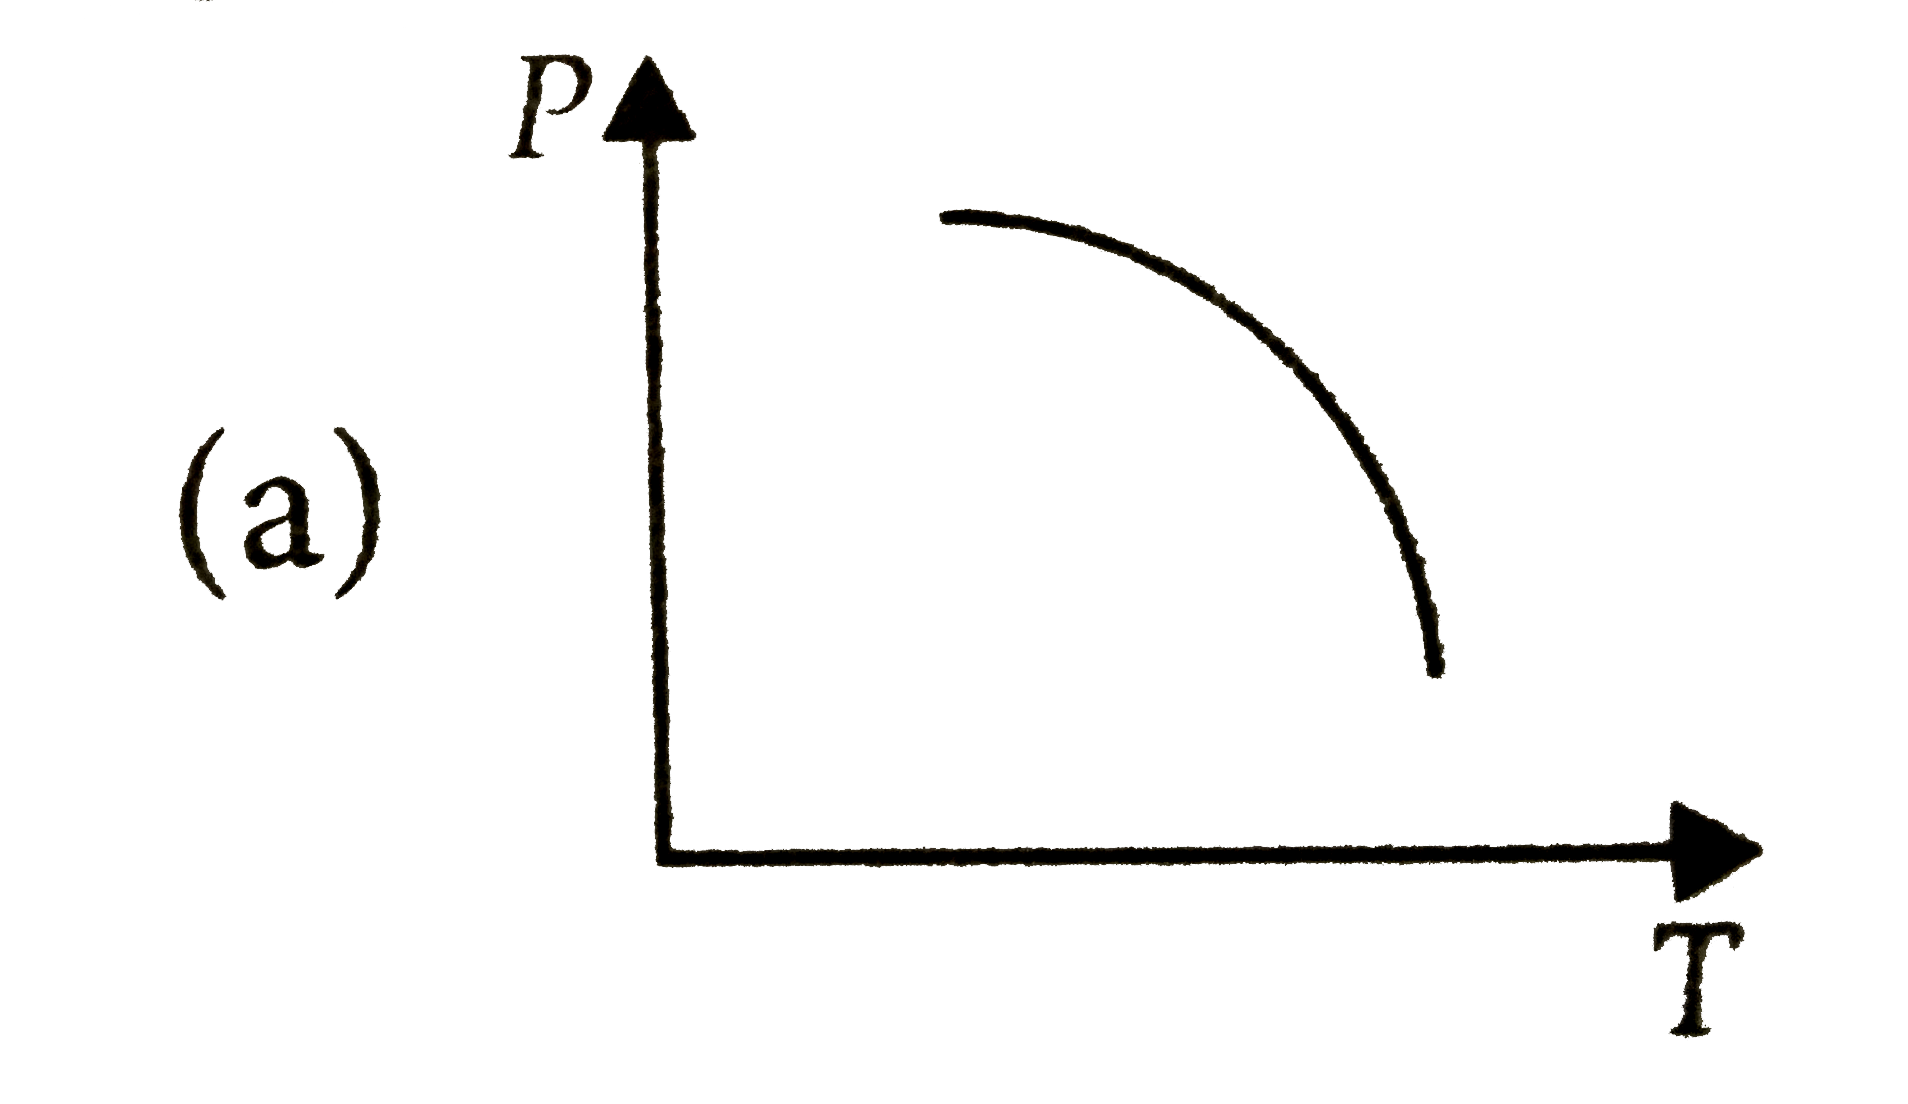
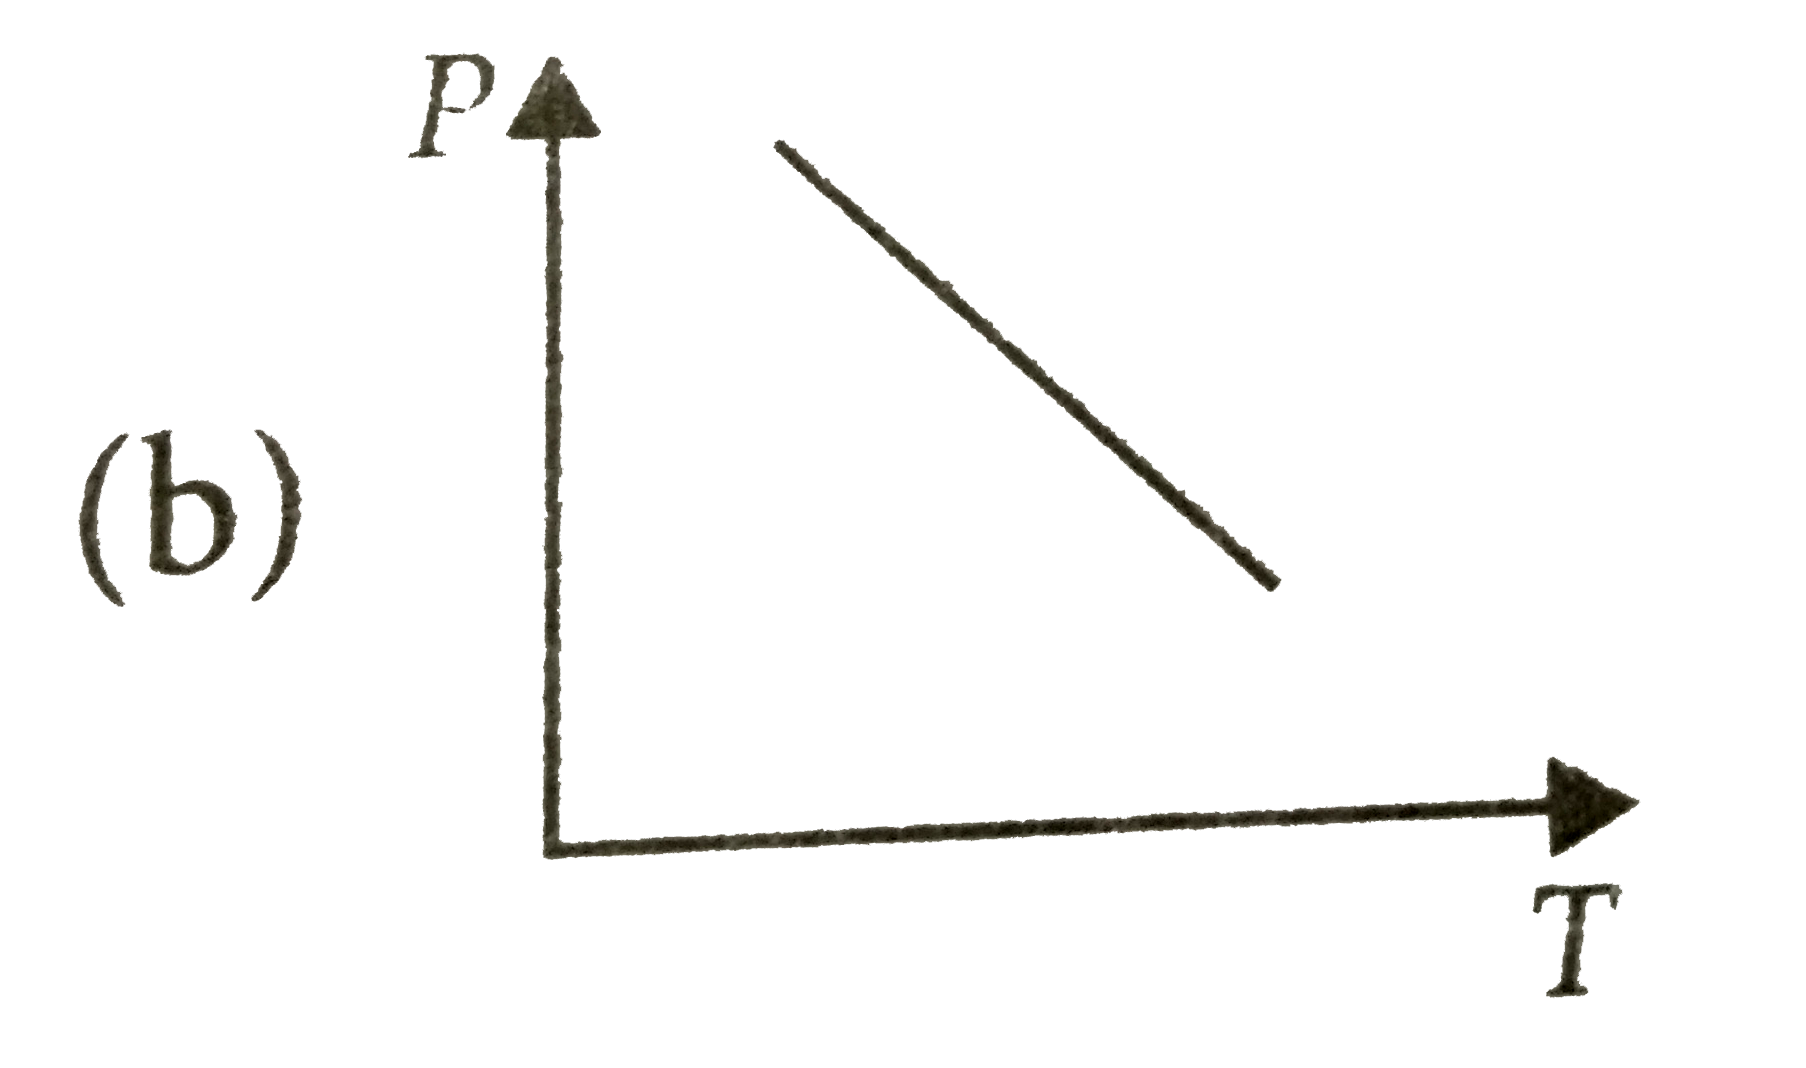
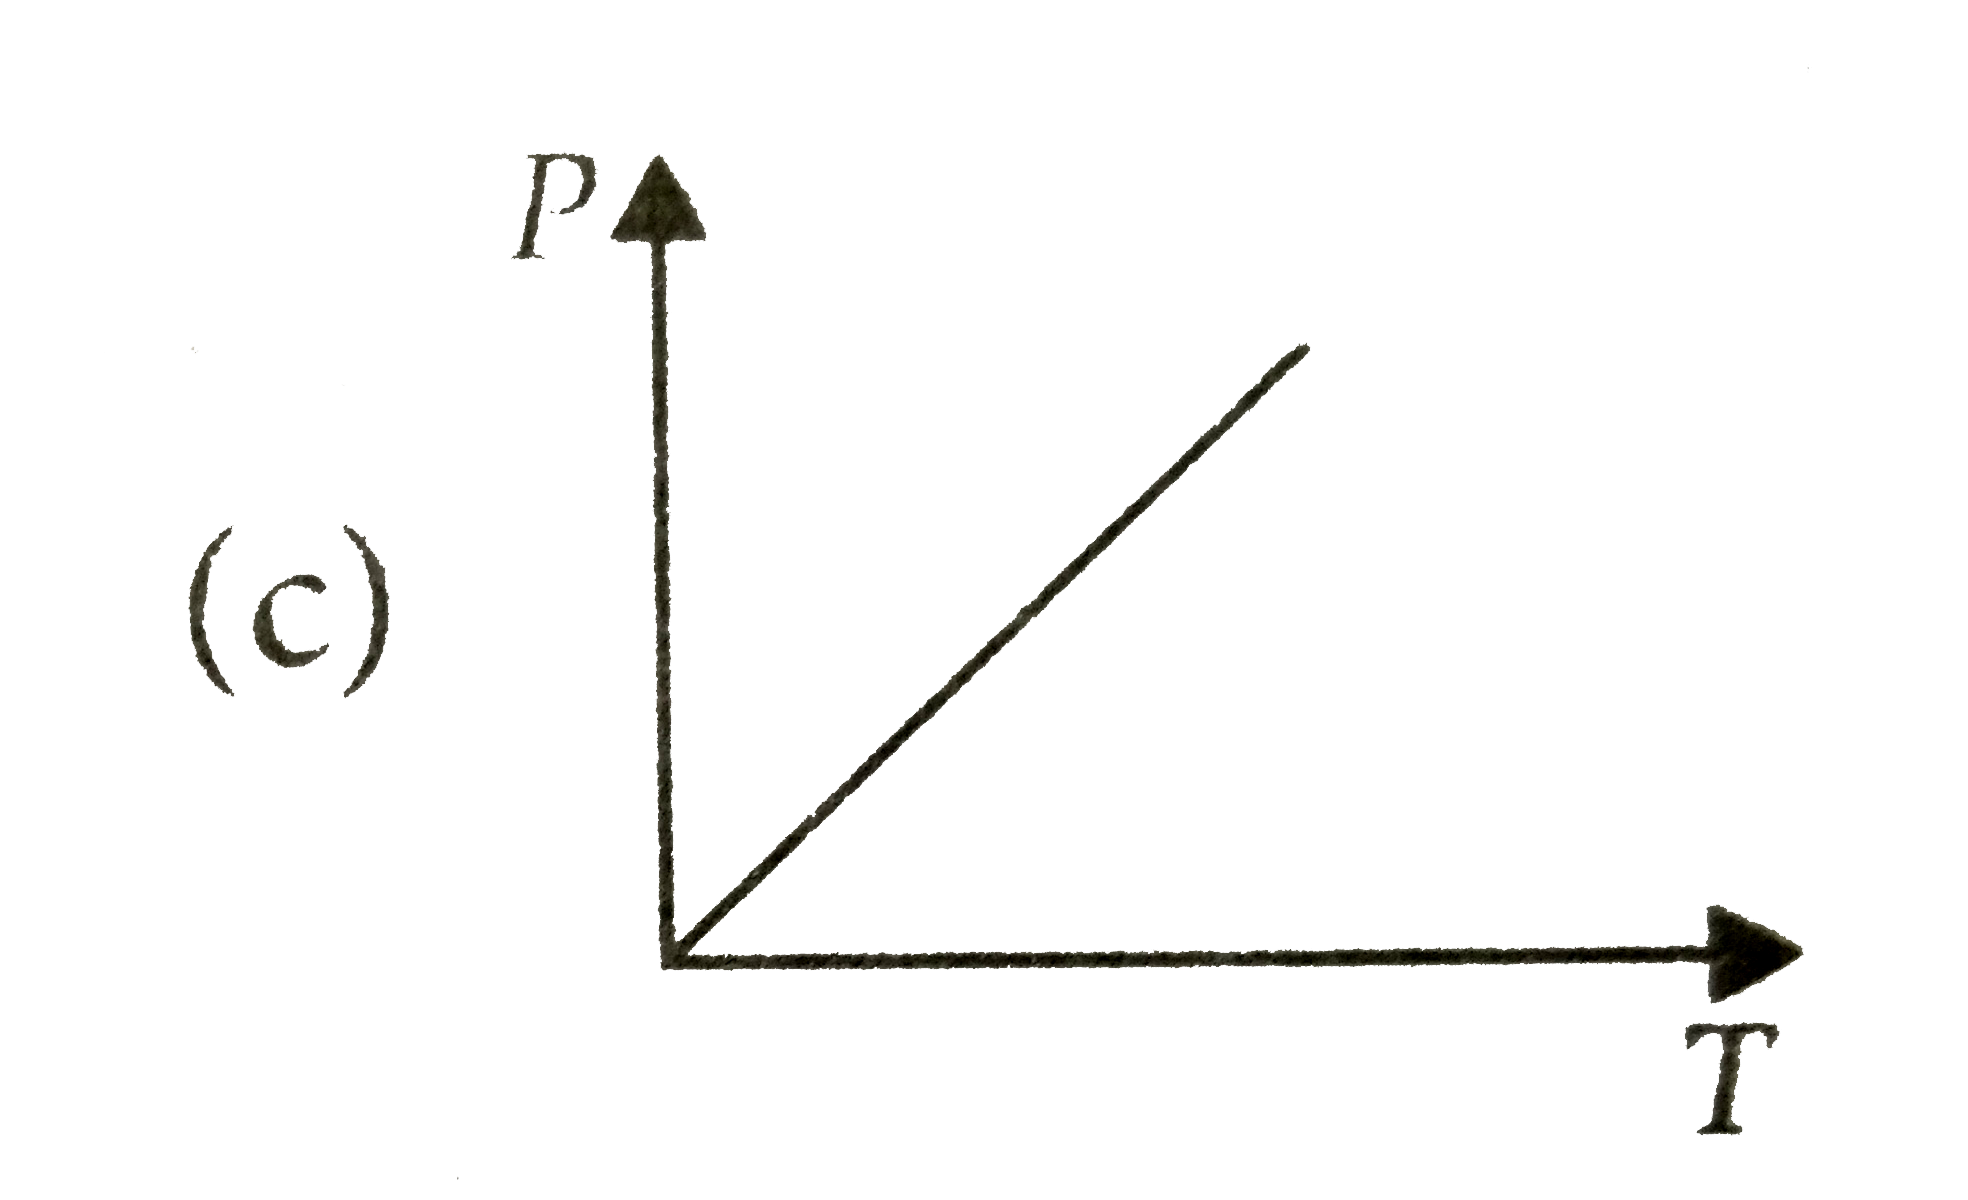
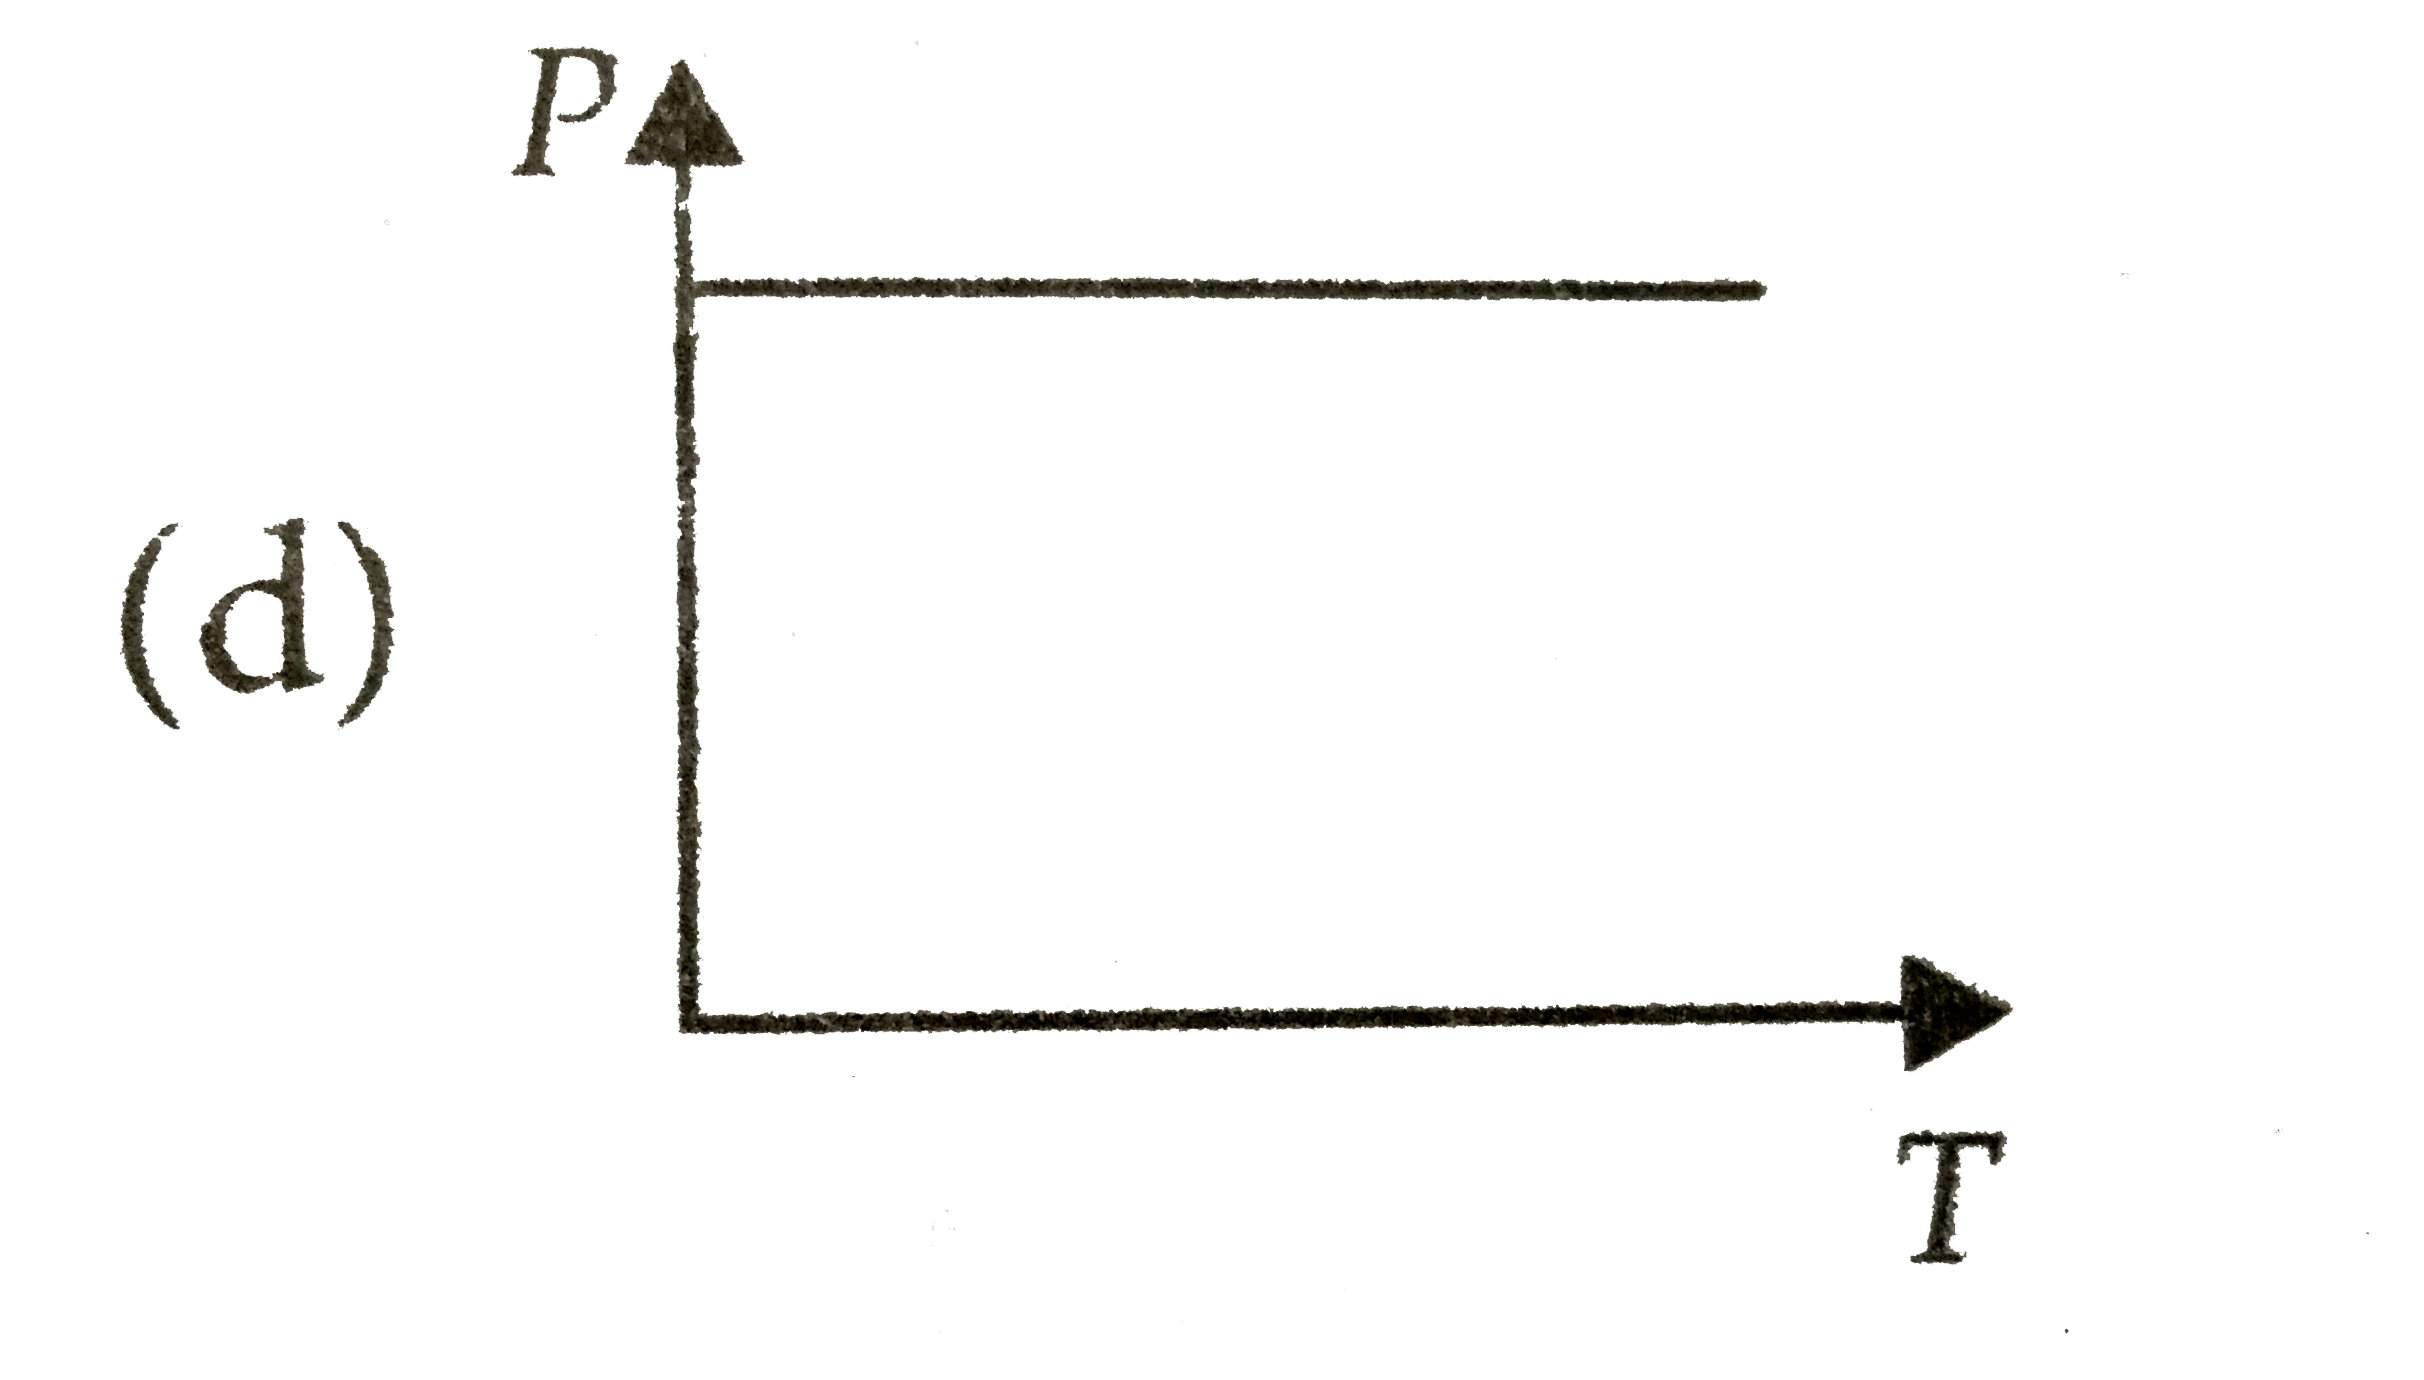
Which of the following P-V diagram represent the graph of isometric process?
A
B
C
D
Video Solution
Text Solution
The correct Answer is:C
In isometric process volume is contstant
P∝T
|
Topper's Solved these Questions
- THERMODYNAMICSBook:NCERT FINGERTIPSChapter:THERMODYNAMICSExercise:Heat Engines
Explore 4 Videos
- THERMODYNAMICSBook:NCERT FINGERTIPSChapter:THERMODYNAMICSExercise:Refrigerators And Heat Pumps
Explore 10 Videos
- THERMODYNAMICSBook:NCERT FINGERTIPSChapter:THERMODYNAMICSExercise:Thermodynamic State Variables
Explore 2 Videos
- THERMAL PROPERTIES OF MATTERBook:NCERT FINGERTIPSChapter:THERMAL PROPERTIES OF MATTERExercise:Assertion And Reason
Explore 10 Videos
- UNITS AND MEASUREMENTSBook:NCERT FINGERTIPSChapter:UNITS AND MEASUREMENTSExercise:Assertion And Reason
Explore 15 Videos
Similar Questions
Knowledge Check
Which of the following P−V diagrams best represents an isothermal process?
A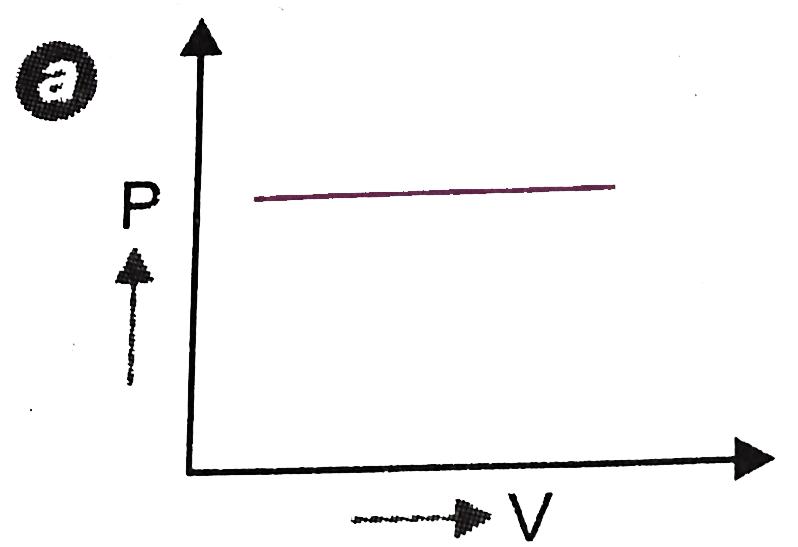 B
B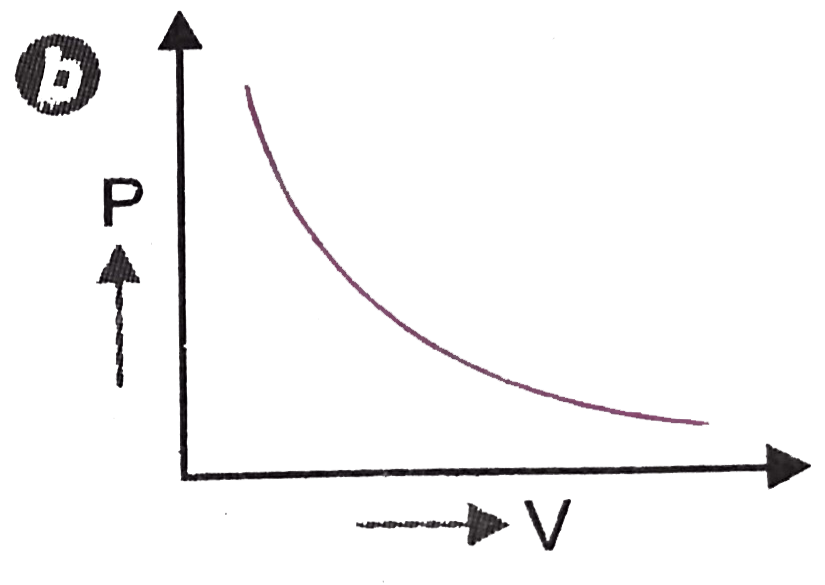 C
C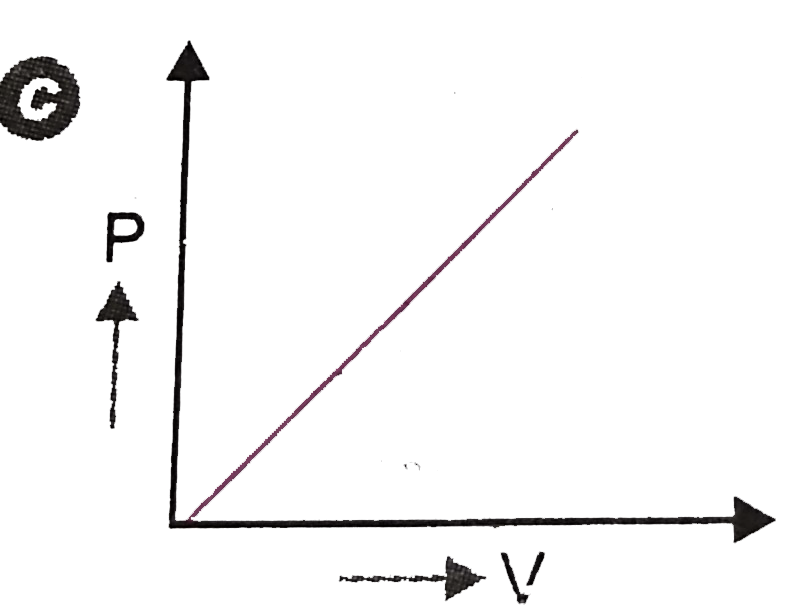 D
D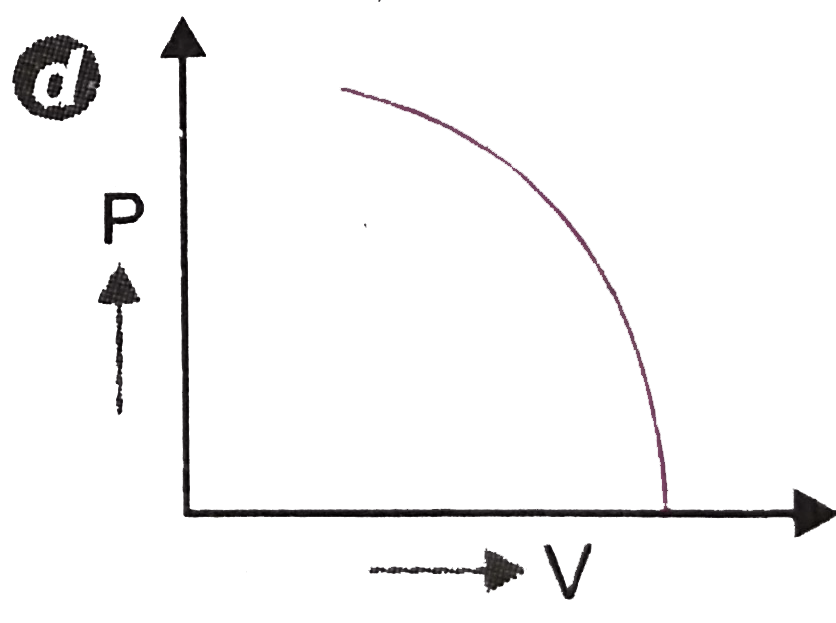
Which of the following p-V diagrams best represents an isothermal process ?
A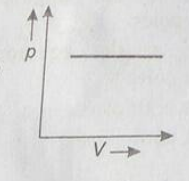 B
B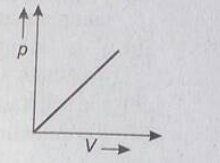 C
C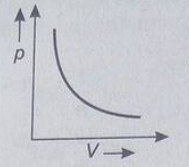 D
D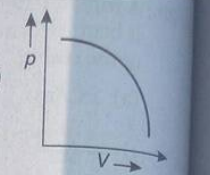
Which of the following p-V diagrams best represents an isothermal process ?
A B
B C
C D
D
Which of the following I-V graph represents ohmic conductors?
View SolutionWhich of the following P-V curve best represents. As isothermal process?
View SolutionSample of gases are taken through isothermal and adiabatic process. Choose which of the following diagram correctly represent isothermal and adiabatic process
View Solutionwhich of the following graph represents the variation of resistivity (ρ) with temperature (T) for copper?
View SolutionAn ideal gas is subjected to a cyclic process ABCD as depicted in the P-V diagram given below
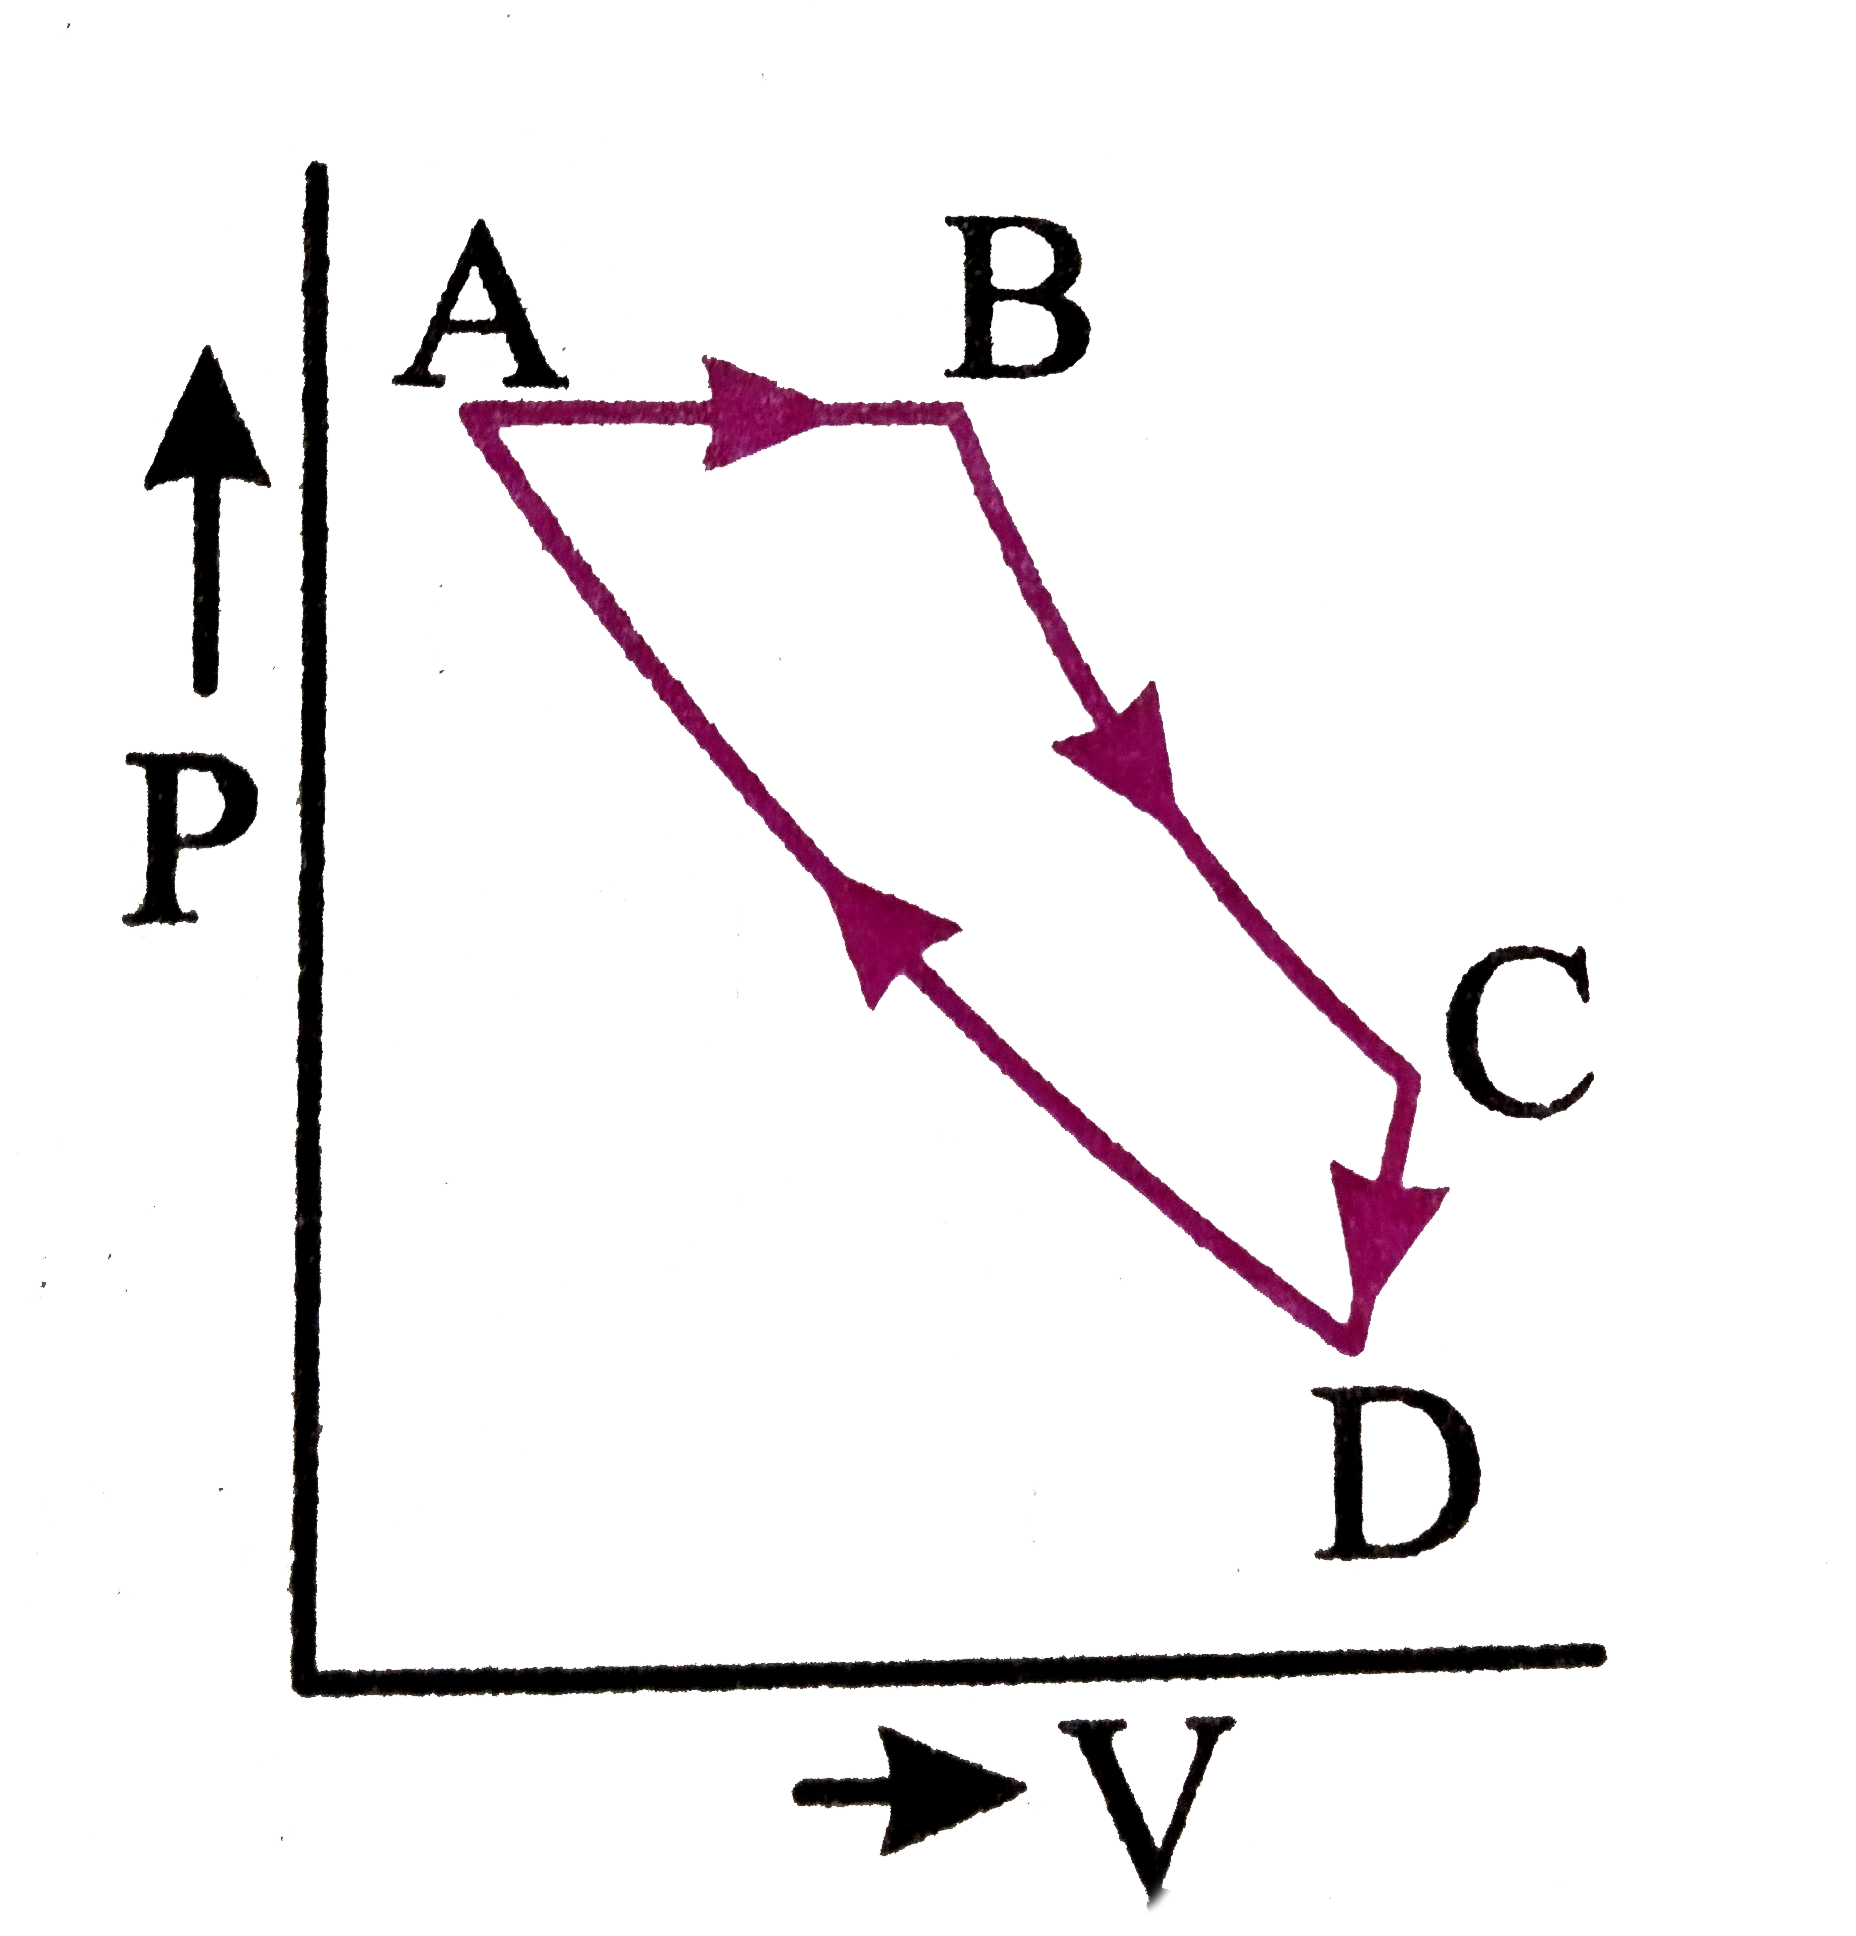
Which of the following curves represents the equivalent cyclic process?
View Solution


