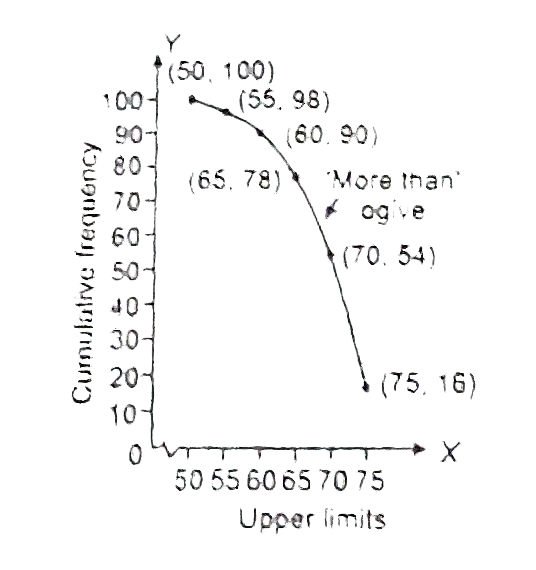
The following table gives production yield per hectare of wheat of 100 farms of a village.

Change the distribution, and draw its ogive

Now, we will draw the ogive by plotting the points (50,100),(55,98),(60,90),(65,78), (70,54) and (75,16)

Topper's Solved these Questions
- STATISTICS BOOK - NAGEEN PRAKASHANCHAPTER - STATISTICS EXERCISE - Exercise 14 A
17 Videos
- STATISTICS BOOK - NAGEEN PRAKASHANCHAPTER - STATISTICS EXERCISE - Exercise 14 B
17 Videos
- STATISTICS BOOK - NAGEEN PRAKASHANCHAPTER - STATISTICS EXERCISE - Revision Exercise Long Answer Questions
5 Videos
- SOME APPLICATIONS OF TRIGONOMETRYBOOK - NAGEEN PRAKASHANCHAPTER - SOME APPLICATIONS OF TRIGONOMETRYEXERCISE - Long Answer Questions
5 Videos
- TRIANGLES BOOK - NAGEEN PRAKASHANCHAPTER - TRIANGLES EXERCISE - Revision Exercise Long Questions
4 Videos
Similar Questions
The following table gives production yield per hectare of wheat of 100 farms of a village.Change the distribution to a more than type distribution, and draw its ogive.
View SolutionThe following table gives production yield per hectare of wheat of 100 farms of a village.

Find the mean production.
View Solution
Knowledge Check
The following table gives the frequency distribution of number of peas per pea pod of 198 pods :

What is the median of this distribution ?A3B4C5D6
The following table gives production yield per hectare of wheat of 100 farms of a village: Production yield 50-55 55-60 60-65 65-70 70-75 75-80 in kg per hectare: No. of farms: 2 8 12 24 38 16 Draw ‘less than’ ogive and ‘more than’ ogive.
View SolutionThe following table production yield in kg per hectare of wheat of 150 farms in a village . Culculate the mean , median and mode of the production yeild.
Production Yield (kg per hectare)50−5353−5656−5959−6262−6565−6868−7171−7474−77Number of Farms 3 8 14 30 36 28 16 10 5
View SolutionThe following table gives the height of 42 trees in meters:

Change the above distribution to less than type distribution and draw its ogive. Hence obtain the median value.
View SolutionThe following table gives the distribution of income of 100 families in a village. Calculate the standard deviation: Income Rs. 0-1000 1000-2000 2000-3000 3000-4000 4000-5000 5000-6000 No. of Families 18 26 30 12 10 4
View SolutionThe following table gives the distribution of income of 100 families in a village. Calculate the standard deviation: Income Rs., 0-1000, 1000-2000, 2000-3000, 3000-4000, 4000-5000, 5000-6000 No. of Families, 18, 26, 30, 12, 10, 4
View SolutionThe following distribution gives the daily income of 50 workers of a factory.

Convert the distribution above to a less than type cumulative frequency distribution, and draw its ogive.
View SolutionThe following distribution gives the daily income of 60 workers of a factory. Convert the distribution above to a less than type cumulative frequency distribution, and draw its ogive.
View Solution
