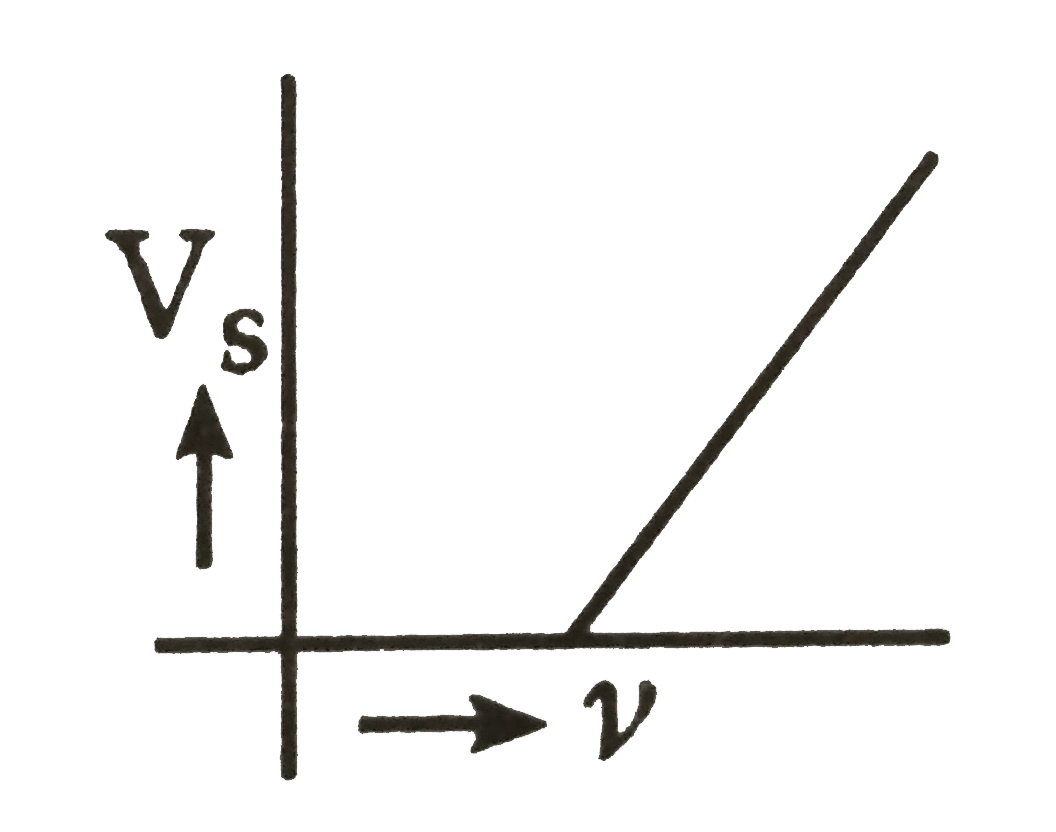
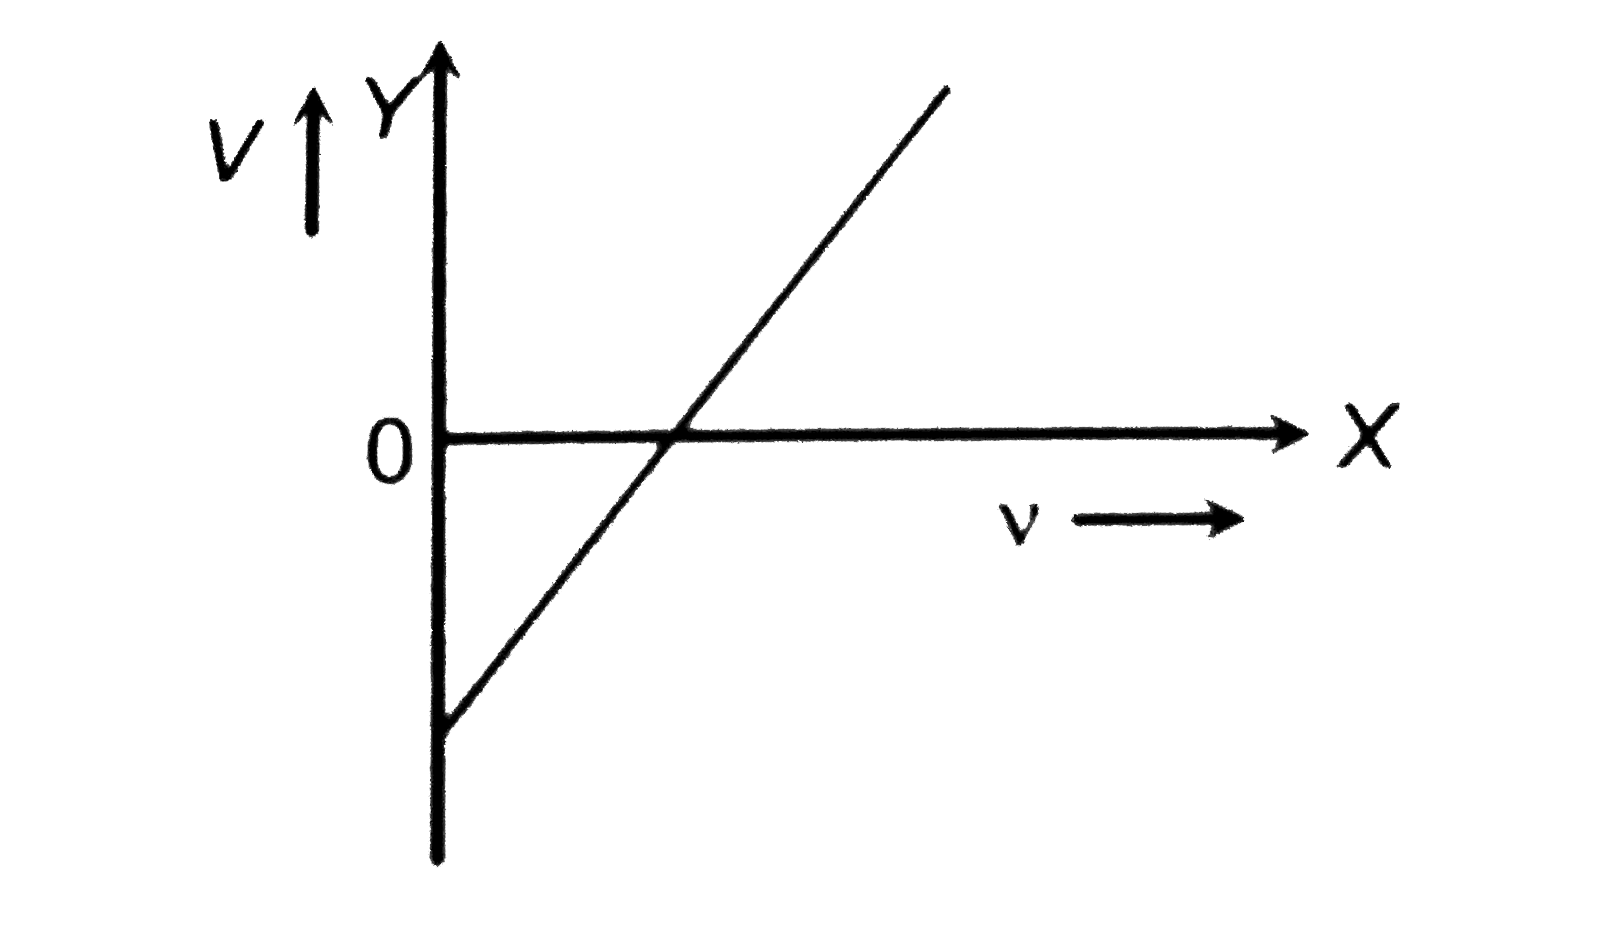
In a photoelectric experiment , the stopping potential Vs is plotted against the frequency v of the incident light . The resulting curve is a straight line which makes an angle θ with the v - axis. Then tanθ will be equal to (Here E0 = work function of the surface_
h/e
e/h
−ϕ/e
eh/ϕ
The correct Answer is:A
eV=hv−hv0⇒V=hev−hev0
Topper's Solved these Questions
Similar Questions
Knowledge Check
In a photoelectric experiment , the stopping potential Vs is plotted against the frequency v of the incident light . The resulting curve is a straight line which makes an angle θ with the v - axis. Then tanθ will be equal to (Here E0 = work function of the surface_
Ah/eBe/hC−ϕ/eDeh/ϕIn a photoelectric experiment, kinetic energy of photoelectrons was plotted against the frequency of incident radition (v), as show in figure. Which of the following statements is correct ?
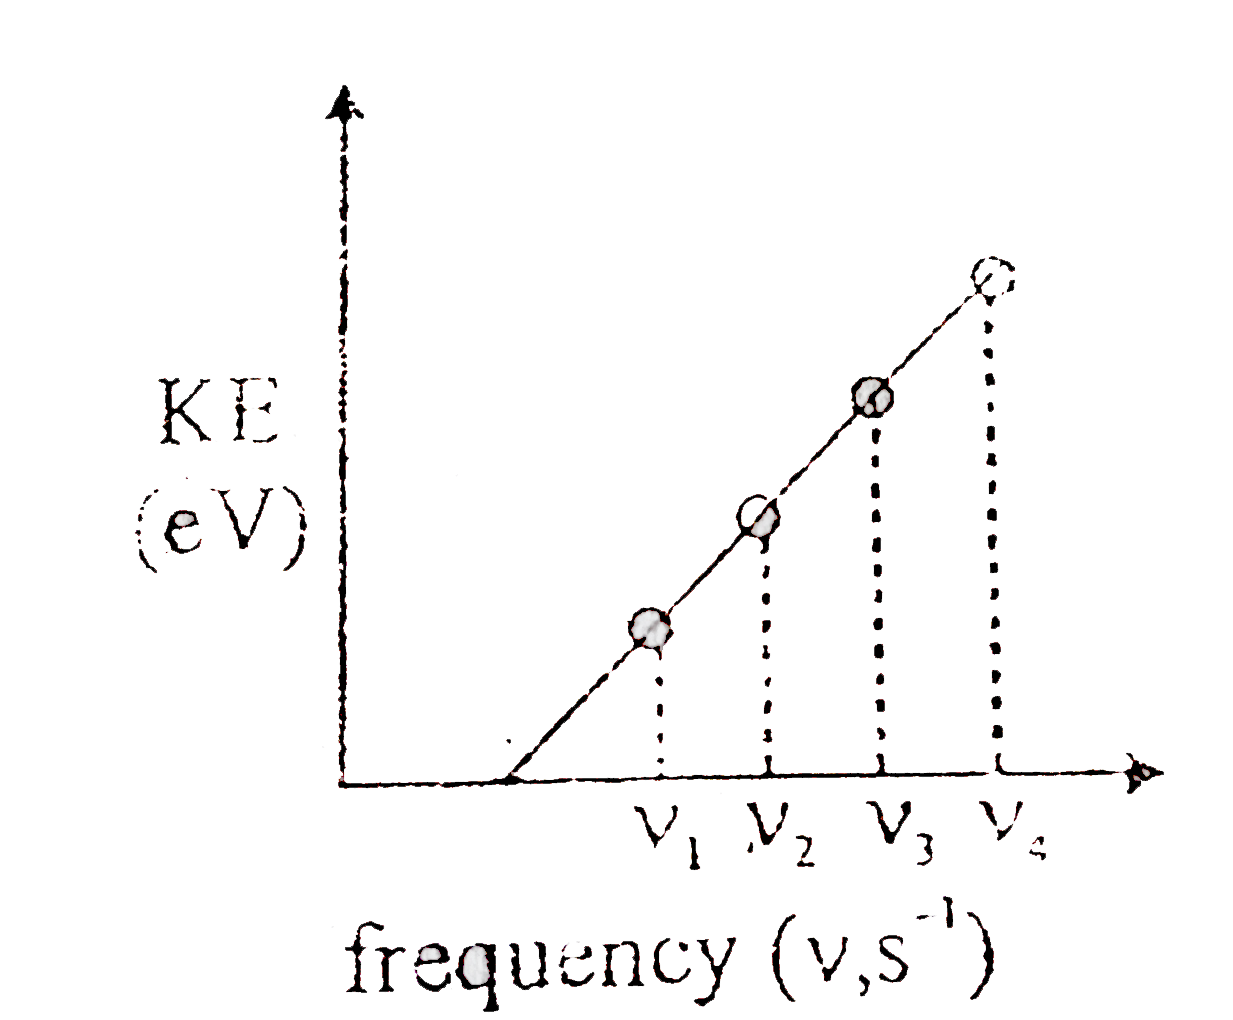 AThe thershold frequency is v1.BThe slope of this line is equal to Plank's constantCAs the frequency of incident wavelength in creases beyond thrshold frequency Kinetic energy of photoelectrons decreasesDIt is impossible to obtain such a graph.
In photoelectric effect the slope of straight line graph between stopping potential (V0) and freqency of incident light (v) gives:
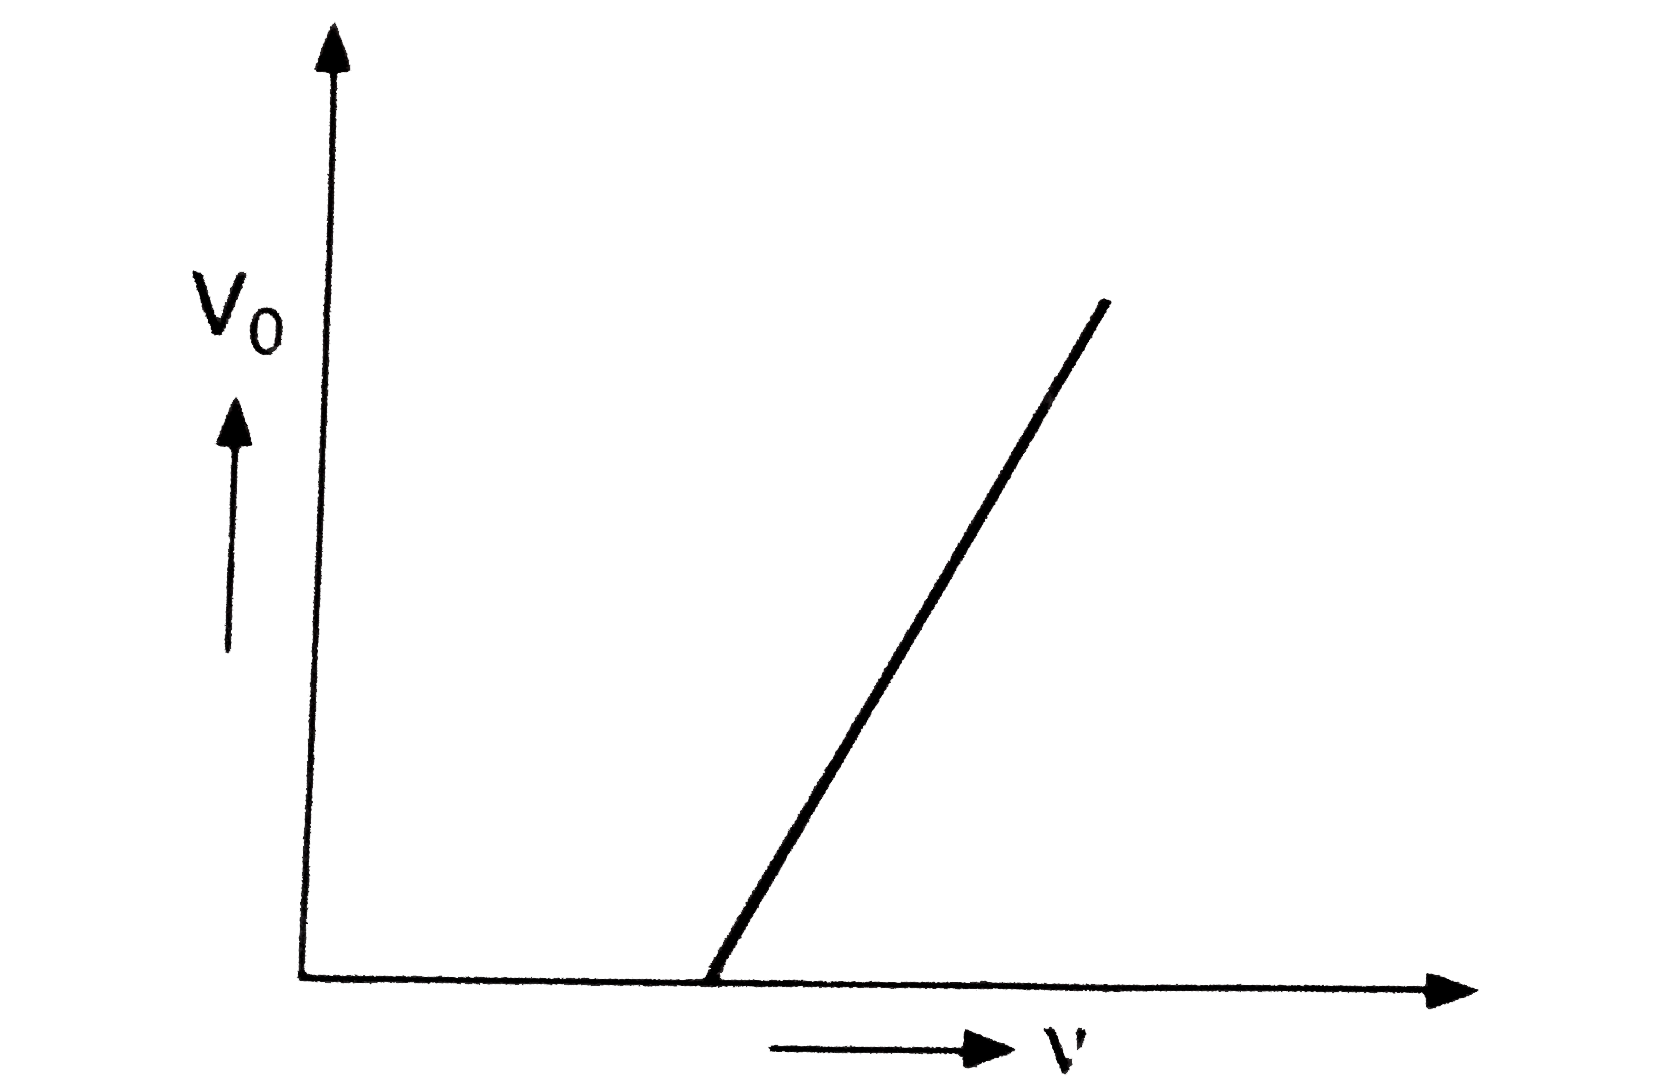 Acharge on electronBwork function of emitterCPlanck's constantDratio of Planck's constant to charge on electron
In a photoelectric experiment, a student plotted the graph of stopping potential (Vs) against the frequency of incident radiation (v). But he could not write the unit of the slope of the graph. What is the corrent unit ?
View SolutionFor a photocell, the work function is ϕ and the stopping potential is Vs . The wavelength of the incident radiation is
View SolutionFrom the graph shown, the value of work function if the stopping potential (V), and frequency of the incident light vare on y and x-axes respectively is
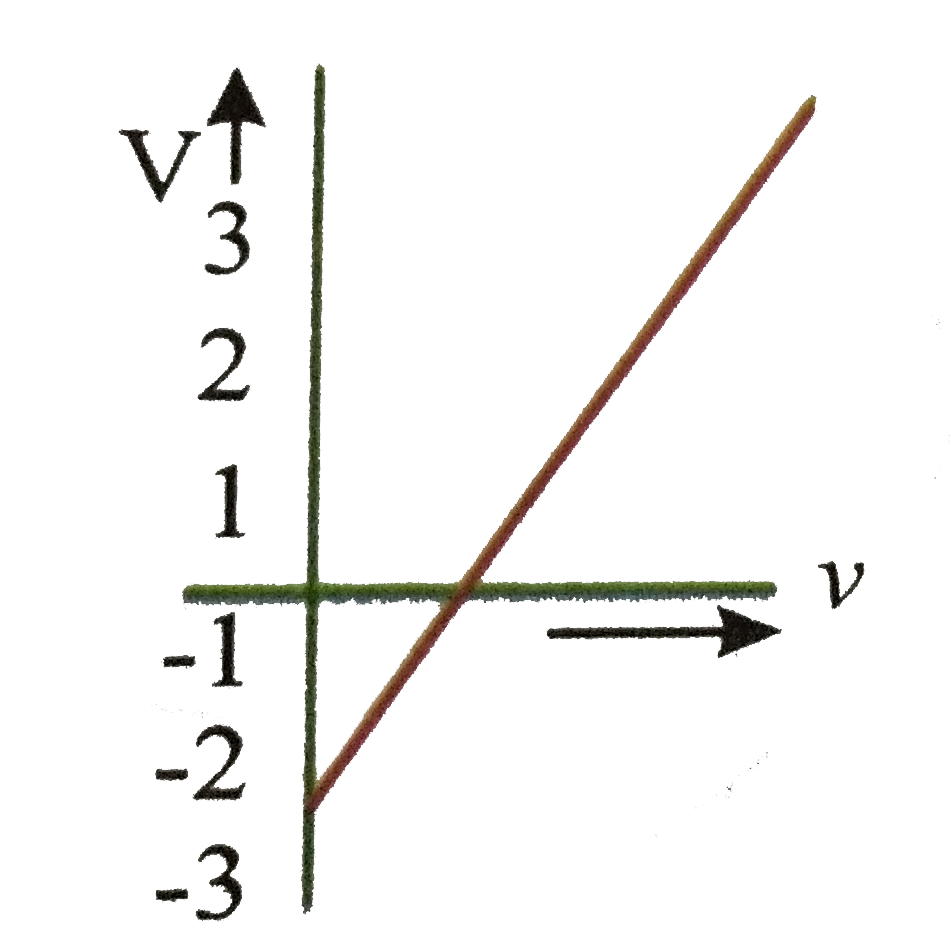
View SolutionThe stopping potential V for photoelectric emission from a metal surface is plotted along Y - axis and frequency v of incident light along X - axis . A straight line is obtained as shown . Planck's constant is given by
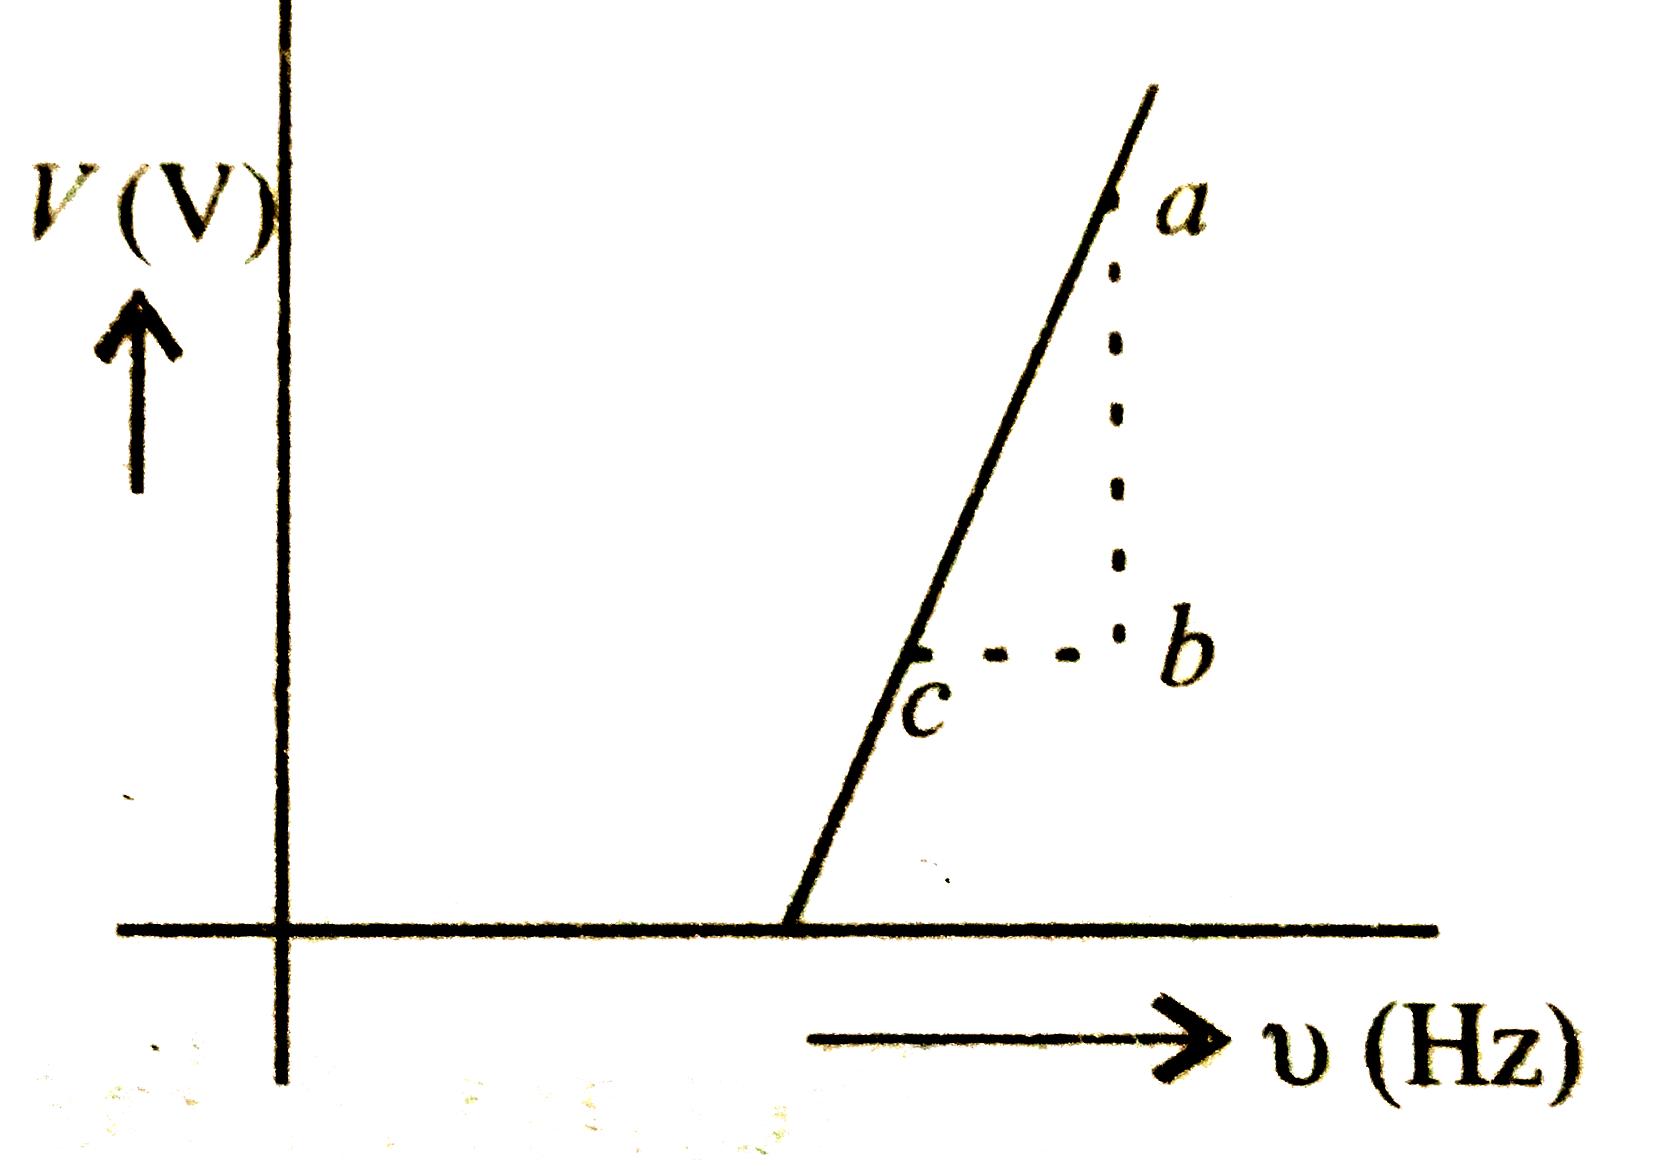
View SolutionIn a photoelectric experiment, the graph of frequency v of incident light (in Hz) and stopping potential V (in V) is as shown in the figure. Planck's constant is (e is the elementary charge)
View Solution

_S01_084_Q01.png)
